
ABSTRACT
Vision is one of the most important senses for animals, allowing them to interact with their environment and with further implications for evolutionary histories. However, relevant soft tissues, such as the eye and associated structures, are not preserved in fossil vertebrates, limiting our knowledge of their visual capabilities. Here, we quantified absolute and relative orbit size for 400 species of dinosaurs and other extinct archosaurs using linear measurements of the preserved skeletal elements as a proxy for visual capabilities. Our results demonstrate that the orbit makes up on average 20% of skull size with a strong and consistent correlation across all sampled groups. This trend is largely independent of temporal distribution, species richness, and phylogeny. In fact, relative orbit size is narrowly constrained and did not surpass 45% of skull size, suggesting physiological and functional controls. Estimated eye size was found to be absolutely larger in herbivores, whereas carnivores tended to have smaller eyes absolutely and compared with skull size. Relatively large eyes only occurred in small-bodied species and vice versa. However, eye size alone was not sufficient to discriminate between different activity patterns or to characterize visual capabilities in detail.
INTRODUCTION
Vision is an important sense for animals, vital for hunting and foraging, predator/prey interactions, mate choice, diel activity patterns, locomotion, and other ecological activities (Hall & Heesy, Citation2011; Knell et al., Citation2013; Schmitz & Motani, Citation2010). In an evolutionary context, information on the visual capabilities of extinct species can reveal how vision allowed adaptations to new environments, such as the transition from water to land (MacIver et al., Citation2017) and the origin of nocturnality in the ancestors of mammals (Angielczyk & Schmitz, Citation2014; Heesy & Hall, Citation2010). However, the preservation of soft tissues is a rare occurrence in fossil vertebrates and inferences on their anatomy, position, and function generally have to be made based on the preserved skeletal elements. Eyes and surrounding tissues (such as the ocular musculature, blood vessels, and nerves) are no exception and are not preserved in fossil vertebrates so our knowledge of eye anatomy and visual capabilities consequently remains elusive.
Nevertheless, advances in digital visualization and imaging techniques have allowed reconstructions and inferences of some soft-tissue anatomy in fossil species. Typical examples of this approach include the reconstruction of the gross brain and neurovascular anatomy from physical or digital casts of the brain cavity (Witmer et al., Citation2008) and the reconstruction of different muscles based on the position of the attachment sites and spatial constraints (Lautenschlager, Citation2013). Despite some inevitable uncertainty (see Witmer [Citation1995] and Witmer & Thomasson [Citation1995]) with such reconstructive methods, these techniques are now routinely used in paleontology to obtain neurosensorial, functional, and evolutionary data on extinct vertebrates (Bertrand et al., Citation2022; Bright, Citation2014; Cunningham et al., Citation2014).
In contrast, the detailed reconstruction of the complete eye anatomy proves more challenging: unlike the brain and inner ear, the eye is not tightly enclosed by bones, which could provide information on its exact shape; similarly, the eyeball is not in direct contact with the orbital bones but attaches via the ocular musculature, which makes morphological inferences difficult. Previous studies have tried to address these problems by using osteological proxies to obtain visual properties of fossil species: for example, the dimensions of the sclerotic ring, albeit rarely and often incompletely preserved, have been used to reconstruct overall eye size as well as activity patterns in dinosaurs (Choiniere et al., Citation2021; Schmitz & Motani, Citation2011), fossil birds (Schmitz, Citation2009), ichthyosaurs (Fernández et al., Citation2005; Motani et al., Citation1999), and the synapsid ancestors of modern mammals (Angielczyk & Schmitz, Citation2014) (including the application of this approach in modern vertebrates [Hall, Citation2008a, Citationb]). Other studies have focused on the orbit morphology itself and its implications for cranial mechanics and dietary adaptation (Chure, Citation1998; Henderson, Citation2003; Lautenschlager, Citation2022; Marcé-Nogué et al., Citation2015; Rinehart et al., Citation2009), while only a handful of works have reconstructed visual fields in extinct vertebrates (MacIver et al., Citation2017; Stevens, Citation2006). Marugán-Lobón and Buscalioni (Citation2003) quantified orbit size in relation to rostral and braincase size as part of a larger study on skull disparity of over 100 fossil (dinosaurs and pterosaurs) and 50 modern archosaurs (birds) but this work did not consider further functional or sensory implications of orbit size or its temporal, ecological, or phylogenetic correlations. This scarcity of studies is in stark contrast to the work on visual systems done in extant animals (see Cerio & Witmer [Citation2020], Martin [Citation2017], and Schmitz [Citation2009] for a summary) and reflects the difficulty to infer visual capabilities for fossil species.
Many of the previous studies have been hampered by small sample sizes or a focus on a few species. This is often unavoidable due to the dependence on the preservation of specific skeletal elements (i.e., sclerotic rings) to obtain data. However, overall eyeball size, if it can be obtained from fossils, can be used as an informative proxy for visual capabilities in extinct species. Although visual acuity depends on a number of factors, including pupil aperture, lens configuration, eye shape, focal length, retina anatomy, and others (Martin, Citation1983; Schmitz, Citation2009), there is a general relationship between overall eyeball size and visual performance (Martin, Citation1994; Schmitz & Motani, Citation2010): larger eyes can accommodate more photoreceptive cells in the retina, can capture more light, and have a larger focal length (Howland et al., Citation2004; Martin, Citation1983; Schmitz & Motani, Citation2011), thereby increasing the resolution of the captured image.
Recent studies have demonstrated a close relationship between orbit size and eyeball size in avians (Schmitz, Citation2009) and crocodilians (Cerio & Witmer, Citation2023). This relation allows the estimation of eye size in dinosaurs and other archosaurs based on their relative phylogenetic position bracketed by both modern groups (Witmer & Thomason, Citation1995). Dinosaurs and their kin further represent an ideal group for the investigation of visual properties due to their fossil record covering more than 150 million years and their well-understood phylogenetic relationships. Furthermore, the diverse ecologies, dietary adaptations, and spanning several orders of magnitude in body size, permit tests of if and how orbit and eye sizes changed with these properties. Evidence from previous studies on orbit shape in different archosauromorph groups suggests that orbit size (and thereby presumably eye size) decreases relative to skull size due to physiological and functional requirements (Lautenschlager, Citation2022; Marugán-Lobón & Buscalioni, Citation2003). Results from extant studies have recovered a negative allometric relationship between eye size and body mass in crocodilians (Cerio & Witmer, Citation2023) and other vertebrates (Howland et al., Citation2004), and similar trends have been recovered in selected fossil archosaurs (Marugán-Lobón & Buscalioni, Citation2003).
However, it has not been tested if the findings from modern archosaurs are also valid for extinct groups, such as dinosaurs and other fossil archosaurs. Here, we reconstructed absolute and relative (in comparison to skull length) eye size () in dinosaurs and other archosaurs (including archosauromorphs as an outgroup) to answer the following questions: (1) Does orbit size follow a negative allometric trend as in modern archosaurs and other vertebrates? (2) Are absolute and relative orbit size influenced by ecological factors (i.e., diet), temporal distribution, or phylogenetic relationships? (3) Is orbit size biased by fossil species richness and the availability of sampled specimens? (4) Are orbit size and estimated eye size indicative of visual capabilities?
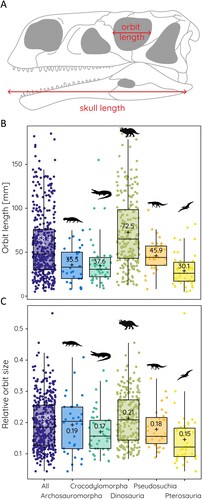
FIGURE 1. Absolute and relative orbit size in different archosauromorph groups. A, schematic illustration of obtained measurements. B, boxplots showing orbit lengths, and C, relative orbit sizes for different groups. ‘+’ and numerical values indicate mean value.
MATERIALS AND METHODS
Specimen Sampling
In total, 382 specimens of fossil archosauromorphs were sampled from the literature. These largely correspond to specimens sampled for a previous study (Lautenschlager, Citation2022) and a complete list is available in the Supplementary Files. Due to different measurements being collected some specimens had to be removed from the original sample by Lautenschlager (Citation2022) as the full skull morphology was not preserved, whereas newly described species were added to the current sample. Juvenile specimens and other early ontogenetic stages (as far as obvious from the fossil material) were disregarded. All species were grouped here based on definitions in Ezcurra (Citation2016): Archosauromorpha (= all non-archosaurian archosauromorphs), Pseudosuchia (= all non-crocodylomorph pseudosuchians), Pterosauria, Dinosauria (all non-avian dinosaurs), and Crocodylomorpha (restricted to Mesozoic taxa). Dinosauria were further grouped into: basal Ornithischia (all non-ornithopod ornithischians), Thyreophora, Marginocephalia, Ornithopoda, Sauropodomorpha (all non-sauropod sauropodomorphs), Theropoda (= non-maniraptoriform theropods), Maniraptoriformes, and Paraves.
For this study, the following measurements and information were collected: (i) orbit diameter (= orbit size in this context), as defined by the distance from the rostralmost margin of the lacrimal to the caudal-most margin of the postorbital (). Although more concrete points of reference (e.g., nasolacrimal foramen as in Cerio & Witmer [Citation2023]) would be desirable for the consistency of measurements, this was not possible for the sampled specimens as no feature was consistently present, preserved or figured. However, rostrocaudal orbit diameter has been used in the past to quantify orbit dimensions across different vertebrate groups (Hall, Citation2008b; Marcé-Nogué et al., Citation2015; Schmitz, Citation2009). In fact, orbit diameter is functionally more relevant in representing eyeball space than homologous points. For specimens with a distinctly non-circular orbit shape (e.g., keyhole or figure-of-eight), only the dorsal portion of the orbit was considered for the measurements, as only this portion of the orbit would have been occupied by the eyeball. The ventral portion of these orbits would have been filled by other soft tissues (e.g., muscles, sinuses, etc.). (ii) Skull length, as defined by the distance from the tip of the premaxilla to the caudal margin of the quadrate following the approach chosen by Marugán-Lobón and Buscalioni (Citation2003) and Bestwick et al. (Citation2022) (). Although skull shapes differ across archosauromorph groups, skull length represents a consistent comparative and quantifiable baseline available for a large sample size (in contrast to body mass estimates often based on post-cranial bone measurements, which can equally vary across groups). Furthermore, basal skull length (premaxilla to quadrate distance) is an established metric for investigating cranial disparity and ignores exaggerated ornamentation and structures, such as ceratopsian frills. While the same is true for braincase (postrostral) length, this information is often more difficult to collect and braincase morphology may not reflect functional and ecological adaptations (Bright et al., Citation2016). (iii) Information on the taxonomic, dietary, and temporal distribution was collected if not already in the data collected in Lautenschlager (Citation2022). (iv) The phylogenetic relationships of all sampled species were represented by an informal supertree as used in Lautenschlager (Citation2022). Newly sampled specimens were added accordingly, while species that were removed were pruned from the tree.
Data collection for (i)–(iii) was performed as part of a year 1 undergraduate course at the University of Birmingham by 22 paleontology students over a period of 11 weeks. Training on data collection was provided by the lead author at the start of the course. The data set was divided into groups of approximately 20–30 species and each group was independently assigned to two students to ensure consistency in the data collection. Where measurements differed only negligibly the mean of the two measurements was used. In case of substantial differences, the measurements were checked and, if necessary, collected again by the lead author. All data were further checked as part of a marked course assignment for which each student had to write a report about the data collected for their group of species.
Relative and Absolute Eye Size
Relative orbit size was calculated as the ratio between orbit diameter and skull length. Absolute eye size was estimated using the regressions for eyeball size vs. orbit size found for the two extant archosaur groups, avians (Schmitz, Citation2009) and crocodilians (Cerio & Witmer, Citation2023). As the regression equations for both extant groups produced slightly different estimates and given the wide range of orbit morphologies in fossil species, the results were used to generate a lower and upper estimate for eye size. For modern crocodilians, Cerio and Witmer (2022) found slightly different relationships between orbit size and eyeball size for crocodiles and alligators. Because the regression for crocodiles is more similar to that of birds from Schmitz (Citation2009), the regression for alligators was used to account for the maximal possible differences in the eyeball estimates. Even then, both estimates led to very similar results. For orbit sizes below 75 mm, the bird estimate produced larger values than the crocodilian estimate and vice versa.
Correlation analyses of relative eye size (= orbit length against skull length) were performed for all specimens as a single group and also divided into different taxonomic and temporal sub-groups. Taxonomic, temporal, and dietary groups were statistically compared using standard analysis of variance (ANOVA); regressions were compared using analysis of covariance (ANCOVA). Phylogenetic generalized least squares (PGLS) regressions of the data were performed using the gls function from the R package nlme (Pinheiro et al., Citation2018). The analyses were performed in R version 4.3.0 (R Core Team, Citation2023) and PAST (Hammer & Harper, Citation2001). Relative orbit size and absolute eye size were mapped onto the archosauromorph supertree to visualize distribution and evolution using Mesquite 3.7 (Maddison & Maddison, Citation2021).
Species Richness
Inconsistent fossilization is known to affect the preservation of individual skeletal elements and thereby morphological character availability (Brown et al., Citation2013; Cashmore et al., Citation2021). To evaluate whether total species richness and species sampling may bias the data collection and inferences for orbit and eye size evolution, results were compared with the total number of species occurring in each time interval (at stage-level). Fossil occurrence data for Mesozoic archosauromorphs were obtained from the Paleobiology Database (PBDB; paleobiodb.org). These occurrence data were cleaned to remove trace taxa (ichnotaxa) and egg taxa (ootaxa), as well as taxa that were taxonomically indeterminate at species level. The total number of species in this occurrence dataset was compared with the number of species sampled for this study. No further standardization was performed on the data. This face-value (= raw, uncorrected) count of total species richness was then plotted alongside species richness from the sampled data (described above).
RESULTS
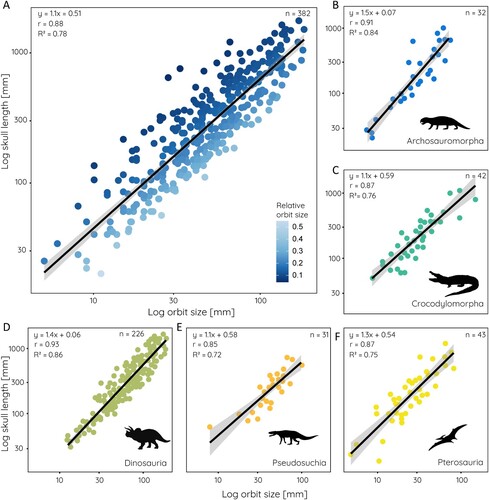
The measurement of orbit size across all sampled groups yields a mean orbit size of 58.4 mm with a range from 5–185 mm (). This wide range reflects the several orders of magnitudes in body size difference and skull lengths (20–1750mm). Compared against skull length, the mean relative orbit size is 0.2 showing that on average the orbit occupies ca. 20% of the skull length (ranging from 0.15 in pterosaurs to 0.21 in dinosaurs) (). Relative orbit length follows a consistent pattern in that there is a strong correlation between orbit size and skull length. This correlation is statistically significant with an r = 0.88 and an R2 = 0.78 for the whole (log-transformed) sample (). The strength of correlation/determination (statistically significant for all) differs somewhat for the various groups among the data set (). It is lowest for pseudosuchians (r = 0.85, R2 = 0.72), somewhat higher in pterosaurs (r = 0.87, R2 = 0.76) and crocodylomorphs (r = 0.87, R2 = 0.76), and highest in non-archosaurian archosauromorphs (r = 0.91, R2 = 0.84) and dinosaurs (r = 0.93, R2 = 0.86). Among the major groups, the regressions for non-archosaurian archosauromorphs and pterosaurs differ statistically significantly from all other groups (Supplementary Table 1). In all studied groups, orbit size scales negatively with skull size.
FIGURE 2. Scatterplots of orbit size against skull length for: A, all sampled species; B, non-archosaurian archosauromorphs; C, crocodylomorphs; D, dinosaurs; E, pseudosuchians; and F, pterosaurs. Equation from phylogenetic generalized least square regression, r- and R2-values, and sample size given for each.
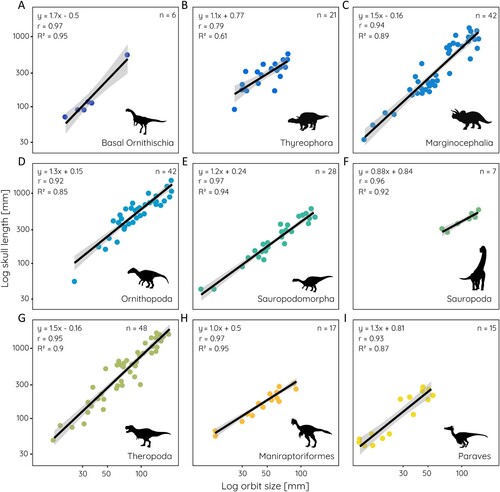
The relationship between orbit size and skull length differs also among the sampled dinosaur groups (). Sauropodomorphs (r = 0.97, R2 = 0.94) and sauropods (r = 0.96, R2 = 0.92), basal ornithischians (r = 0.97, R2 = 0.95), non-maniraptoriform theropods (r = 0.95, R2 = 0.90), and maniraptoriforms (r = 0.97, R2 = 0.95) show strong correlations. However, values for basal ornithischians and sauropods are likely influenced by the small sample size (n = 6 and n = 7) for these groups. On the other hand, thyreophorans (r = 0.79, R2 = 0.61) have the weakest correlation among the sampled groups, although the sample size is limited as well and the morphological heterogeneity among the group is high. Within dinosaurs, most groups are significantly different in their regressions from each other, with the exception of basal ornithischians and paravians (Supplementary Table 2).
FIGURE 3. Relative orbit size in different dinosaur groups. Scatterplots of orbit size against skull length for: A, basal Ornithischia; B, Thyreophora; C, Marginocephalia; D, Ornithopoda; E, Sauropodomorpha; F, Sauropoda; G, Theropoda; H, Maniraptoriformes; and I, Paraves. Equation from least square regression, r- and R2-values, and sample size given for each.
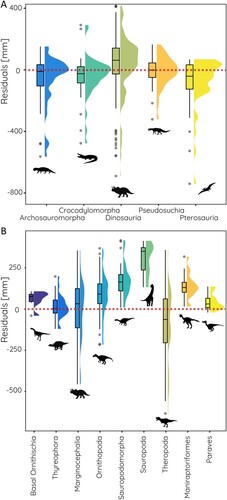
The comparison of the model residuals shows that orbit sizes for most groups fall close to the predicted value based on the regressions with only a few species having substantially smaller values than expected (). Notable exceptions are found in dinosaurs (in which a considerable part of the group have orbit sizes both larger and smaller than predicted) and pterosaurs (with several species having smaller orbit sizes than predicted). For the major groups within dinosaurs, basal ornithischians, ornithopods, sauropodomorphs and sauropods, maniraptoriforms, and paravians show orbit sizes larger than expected ().
FIGURE 4. Residual values indicating orbit sizes above and below regression results (positive values indicating orbit sizes higher than predicted for given skull size, negative values indicated smaller orbit sizes than predicted). Comparisons shown between A, major archosauromorph groups; and B, major dinosaur groups. Red dotted line indicates regression value.
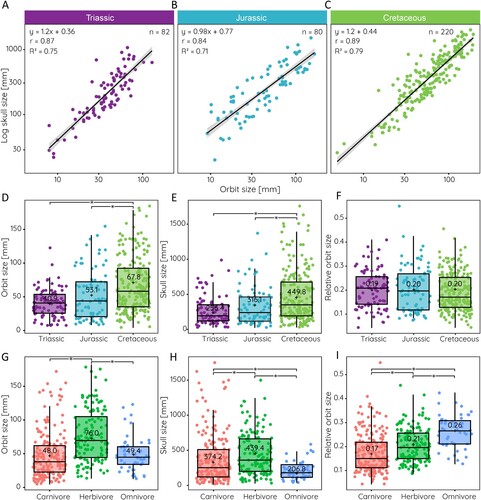
When observed through time, Jurassic species (irrespective of group) have the lowest correlation between orbit size and skull length (r = 0.84, R2 = 0.71). The strength of the correlation decreases slightly from the Triassic (r = 0.87, R2 = 0.75) and increases again in the Cretaceous (r = 0.89, R2 = 0.79) (). However, the latter signal is probably due to the overwhelming majority of dinosaur species in the sample during the Cretaceous. Similarly, orbit size increases from the Triassic (mean = 40.9 mm) to the Cretaceous (mean = 67.8 mm) (). However, relative orbit size remains largely constant throughout the Mesozoic (mean = 0.19–0.20) (), likely due to a concomitant trend to increase skull length (). Separated by diet, herbivorous species appear to have on average larger orbits (), but also larger skulls (). For relative orbit size, carnivorous species appear to have on average the smallest orbits compared with skull length (mean = 0.17), whereas omnivores have the relatively largest orbits (mean = 0.26) with significant differences between all three dietary groups ().
FIGURE 5. Orbit size, skull size, and relative orbit size through time and for different dietary categories. Scatterplots of orbit size against skull length in the: A, Triassic; B, Jurassic; and C, Cretaceous. Boxplots comparing: D, orbit size; E, skull length; and F, relative orbit size during the Mesozoic; and G–I, for different dietary categories. Equation from least square regression, r- and R2-values, and sample size given in A–C, statistical significance (p < 0.05) in D–I indicated by *.
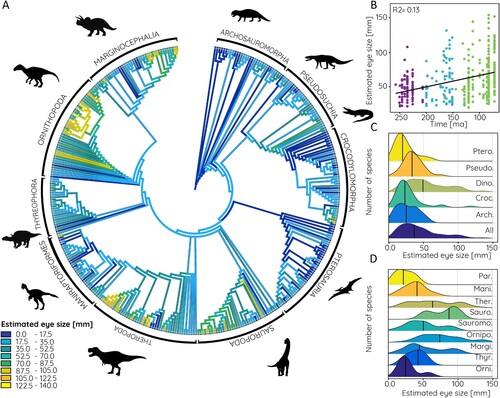
In a phylogenetic context, there is a consistent trend throughout all groups to start with a moderate to high relative orbit size in the respective basal species and a decrease in relative orbit size in derived members (). This is particularly prominent in basal archosauromorphs, pterosaurs, sauropodomorphs, and ornithischians in general. Relative orbit size distribution centers around a value between 0.15 and 0.20, but with a bimodal distribution in non-archosaurian archosauromorphs, and to a lesser degree also in dinosaurs and pterosaurs (). Within Dinosauria, a similar trend is found in basal ornithischians and marginocephalians, whereas non-maniraptoriform theropods and paravians show a trimodal distribution (). Absolute eye size shows an almost inverse trend to relative orbit size. All groups show small eye sizes below 50 mm in basal species. In non-archosaurian archosauromorphs, crocodylomorphs, and pterosaurs eye sizes do not increase substantially across the respective phylogenies. In contrast, pseudosuchian eye size increases moderately in derived species. In dinosaurs, several groups stand out for increased eye size. These include sauropods, non-maniraptoriform theropods, ornithopods, and derived marginocephalians with an estimated eye size of 70–125 mm ( and ). These trends are very similar for eye size estimates based on modern crocodilian and avian data.
FIGURE 6. Relative orbit size in phylogenetic context. A, Relative orbit size mapped onto archosauromorph supertree, compared B against time, and frequency distribution shown for C, major archosauromorph and D, dinosaur groups. Abbreviations: Arch., Archosauria; Croc., Crocodylomorpha; Dino., Dinosauria; Mani., Maniraptoriformes; Margi., Marginocephalia; Orni., Basal Ornithischia; Ornipo., Ornithopoda; Par., Paraves; Pseudo., Pseudosuchia; Ptero., Pterosauria; Sauro., Sauropoda; Sauromo., Sauropodomorpha; Ther., Theropoda; Thyr., Thyreophora.
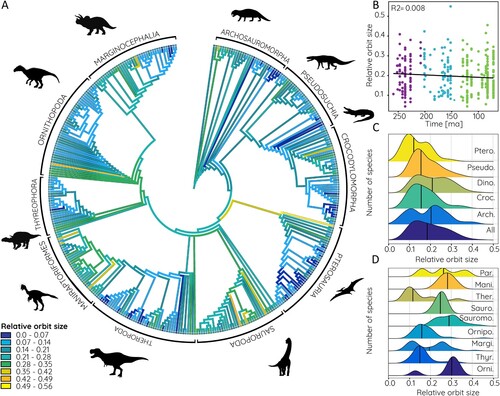
FIGURE 7. Estimated eye size based on data from modern birds in phylogenetic context. A, Relative orbit size mapped onto archosauromorph supertree, B, compared against time, and frequency distribution shown for C, major archosauromorph and D, dinosaur groups. Abbreviations: Arch., Archosauria; Croc., Crocodylomorpha; Dino., Dinosauria; Mani., Maniraptoriformes; Margi., Marginocephalia; Orni., Basal Ornithischia; Ornipo., Ornithopoda; Par., Paraves, Pseudo., Pseudosuchia; Ptero., Pterosauria; Sauro., Sauropoda; Sauromo., Sauropodomorpha; Ther., Theropoda; Thyr., Thyreophora.
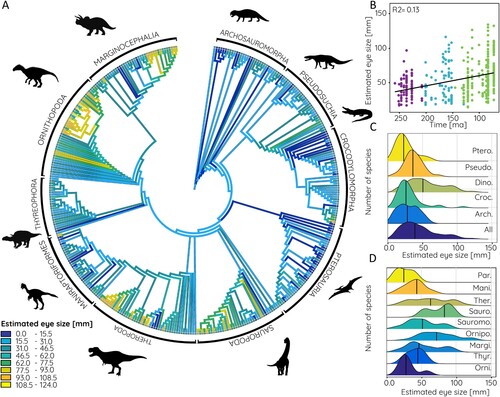
FIGURE 8. Estimated eye size based on data from modern crocodilians in phylogenetic context. A, Relative orbit size mapped onto archosauromorph supertree, B, compared against time, and frequency distribution shown for C, major archosauromorph and D, dinosaur groups. Abbreviations: Arch., Archosauria; Croc., Crocodylomorpha; Dino., Dinosauria; Mani., Maniraptoriformes; Margi., Marginocephalia; Orni., Basal Ornithischia; Ornipo., Ornithopoda; Par., Paraves; Pseudo., Pseudosuchia; Ptero., Pterosauria; Sauro., Sauropoda; Sauromo., Sauropodomorpha; Ther., Theropoda; Thyr., Thyreophora.
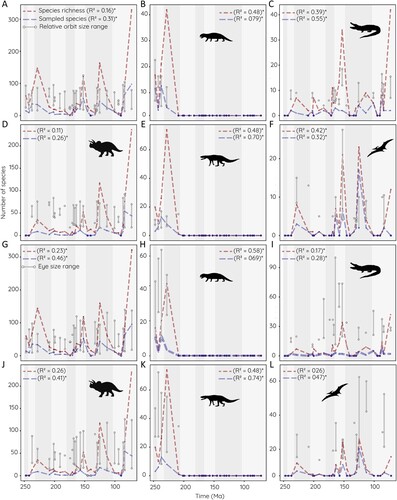
To evaluate whether variations in relative orbit and absolute eye size are correlated with total species richness, both measurements were compared with counts of species per time interval at stage-level resolution. The number of sampled species tracks closely with total species richness regardless of the group (). Stages with a high number of species allowed for more specimens to be sampled. On the other hand, this trend is not found for relative orbit size. Measurements are consistently ranging between 0.1 and 0.4 with little fluctuation throughout the Mesozoic for the entire sample. Stages with a large number of species do not show a wider range of relative orbit sizes; neither do low species numbers translate to restricted ranges of relative orbit size. This trend is also found in dinosaurs and crocodylomorphs and, tentatively, in non-archosaurian archosauromorphs and pseudosuchians as well. However, the short temporal range makes it difficult to identify large-scale trends. It is only in pterosaurs that peaks in species richness (moderately) coincide with larger orbital ratio variability. Results for absolute eye size are very similar. Estimated eye size remains largely constant throughout the Mesozoic and it is only at the end of the Cretaceous that larger eye size ranges are observed. This however may be related to the appearance of large-sized dinosaurs rather than the increase in species richness.
FIGURE 9. Relative orbit size and estimated eye size compared with species richness. A–F, relative orbit size, and G–L, estimated eye size (averaged from data based on modern birds and crocodilians) plotted against face-value (= raw, uncorrected) species richness and sample size for individual stages of the Mesozoic. A, G, all archosauromorph species; B, H, non-archosaurian archosauromorphs; C, I, crocodylomorphs; D, J, dinosaurs; E, K, pseudosuchians; and F, L, pterosaurs. Correlation coefficient and statistical support (p < 0.05 indicated by *) given for each correlation.
DISCUSSION
Relative and Absolute Orbit Size
The results demonstrate that the evolution of orbit size in dinosaurs and other archosauromorphs follows a consistent trend, largely independent of temporal distribution, species richness, and phylogenetic affinities. There is a strong correlation between orbit size and skull length in all sampled groups. However, non-archosaurian archosauromorphs and pterosaurs were found to differ significantly from other major groups in their correlation. This is not surprising considering the evolution of unusually large skull sizes in groups such as erythrosuchids (Bestwick et al., Citation2022) and the diversity of skull morphologies in pterosaurs (Foth et al., Citation2012). Within dinosaurs, the level of correlation is even stronger among individual groups. Basal ornithischians, sauropodomorphs, sauropods, and all theropods have particularly high r and R2 values. The majority of dinosaur groups differ significantly in their correlations from each other with the exception of basal ornithischians, which may be explained by the retention of plesiomorphic skull morphologies. However, in some groups, such as basal ornithischians (n = 6) and sauropods (n = 7) these signals are likely an artifact of small sample sizes, as also noted by Marugán-Lobón and Buscalioni (Citation2003) in their study demonstrating that the sample size has not substantially increased in the last 20 years. Nevertheless, in most dinosaur groups, orbit size can be predicted from skull length confidently.
Orbit size and eye size scale negatively with skull length in dinosaurs and other archosauromorphs and these results confirm other studies which recovered a negative allometric relationship in vertebrate eyes more generally, including different groups of birds, mammals, reptiles, and fishes (Brooke et al., Citation1999; Hall & Ross, Citation2007; Howland et al., Citation2004; Kiltie, Citation2000; Ross et al., Citation2007). These and other studies compare orbit and eye size (or eye mass) to overall body mass, rather than skull length as in this study. However, considering that archosauromorphs, and in particular dinosaurs, span several orders of magnitude in body size, skull length was considered a more reliable metric for this study and less prone to skew the correlation due to extremes in body size (Bestwick et al., Citation2022).
Although absolute orbit size ranges between 5–185 mm, relative orbit size is more narrowly confined and does not exceed a ratio of 0.45 or 45% of the skull length (one outlier, the pterosaur Anurognathus ammoni with an orbit ratio of 0.55 aside). In fact, mean relative orbit size for all sampled species is 0.2 and varies only slightly (0.15–0.21) in individual archosauromorph groups (). A similar mean value and upper threshold for relative orbit size was found by Marugán-Lobón and Buscalioni (Citation2003) with a maximum of 40% for the modern Falco tinnunculus (common kestrel). Interestingly, a similar maximum limit of relative orbit size appears to be more widely present in non-mammalian and mammalian synapsids (Marugán-Lobón et al., Citation2022). While Permo–Triassic non-eucynodont synapsids reach maximum orbit ratios of 45%, this value is considerably lower (ca. 30%) in Mesozoic eucynodonts and mammals (Marugán-Lobón et al., Citation2022).
When major archosauromorph groups are considered, the orbit size of most species generally falls within the range predicted by the phylogenetic linear regression. Dinosaurs deviate the strongest with a large proportion of the species having smaller or larger than predicted values. This is likely an effect of the large range of skull and body sizes spanning several orders of magnitude. In particular ornithopods, sauropods, and maniraptoriformes have larger orbit sizes than expected, all of which show trends towards gigantism in the course of their evolution (Apaldetti et al., Citation2018; O’Gorman & Hone, Citation2012; Zanno & Makovicky, Citation2013) but relatively small skull sizes (Bestwick et al., Citation2022). It is noteworthy, that, although giant body sizes are present in the group as well, non-maniraptoriform theropods tend to have smaller orbit sizes than predicted. In particular, Carnosauria and Tyrannosauroidea have skull sizes proportional to body sizes but small orbits due to functional constraints as an adaptation to a hypercarnivorous ecology (Lautenschlager, Citation2022).
Ecological Factors and Sampling Biases
The orbit ratio remains constant through the Mesozoic (, , ) despite substantial fluctuations in species richness, the emergence of new clades, extinction events, and episodes of faunal turnover. Diet appears to play some role in shaping relative orbit size with statistically significant differences recovered between carnivores, herbivores, and omnivores. Still, mean relative orbit size varies only slightly between species of different dietary adaptations (0.17–0.26). This consistency across large time scales, dietary categories and phylogenetic groups suggests that relative orbit size is generally constrained. Looking at skull geometry and disparity more generally, Marugán-Lobón and Buscalioni (Citation2003) found that orbit size is substantially constrained in size relative to braincase size (which itself is strongly correlated with skull length) in fossil and modern archosaurs. In contrast, rostrum length was found to be more variable, suggesting loosened constraints in that skull region possibly related to plasticity in response to diet.
It is likely that the aforementioned constraints on absolute and relative eye size are limited physiologically and functionally and cannot be increased above certain thresholds without compromising advantages in visual acuity. Large eyes are physiologically expensive, require a substantial amount of nutrients to maintain, and can have other negative consequences, such as added weight, counteracting camouflage, limiting locomotor capabilities, and susceptibility to damage (Hall & Heesy, Citation2011; Laughlin et al., Citation1998; Lönnstedt et al., Citation2013; Martin & Katzir, Citation2000; Moran et al., Citation2015; Zaret & Kerfoot, Citation1975). Additionally, recent research has demonstrated that large, circular orbits are mechanically less efficient than elliptical and keyhole-shaped orbits, which in turn restrict eyeball size due to their anisometric shape (Lautenschlager, Citation2022).
Implications for Eye Size and Visual Acuity
Among vertebrates, ichthyosaurs are considered to have evolved the largest eyes with a diameter of 300 mm or more, which exceeds the largest eyes of modern marine mammals considerably (ca. 110 mm eye diameter in the blue whale) (Howland et al., Citation2004; Motani et al., Citation1999; Nilsson et al., Citation2012). Among terrestrial vertebrates, horses and zebras (ca. 40–60 mm), and ostriches and emus (up to 70 mm) have the absolutely largest eyes, whereas large megaherbivores such as elephants and giraffes have only a more moderate eye size in absolute terms (ca. 40 mm) (Howland et al., Citation2004; Schmitz, Citation2009). Visual acuity is thought to be relatively poor in the latter, relying more on other senses (Howland et al., Citation2004). Dinosaurs and most of the other archosauromorph groups exceed these eye sizes based on the estimates obtained from orbit dimensions. The mean eye size for all sampled species is 58.4 mm, substantially driven by dinosaurs in which mean eye size is 72.5 mm but reaching a maximum of up to 125 and 140 mm, depending on the avian or crocodilian estimates, respectively. However, it should be noted that the eye size estimates are based on modern archosaurs with maximum orbit sizes of 80 mm. All orbit/eye size correlations above this threshold are based on the extrapolation of the data as no modern archosaurs exist with orbit sizes comparable to large ornithischians (up to 185 mm) and theropods (up to 172 mm). While this extrapolation is unavoidable it leads to larger differences between the crocodilian-based and avian-based eye size estimates. For Shantungosaurus (the species with the largest orbit and eye estimate respectively) the difference between estimates is 16 mm (or around 12%). For orbit sizes below 80 mm, this difference is less than 1 mm (or less than 1%). Absolute eye size estimates for the largest species should therefore be considered with caution and within the upper and lower estimates provided by the modern archosaur data.
Large eye size is a general proxy for increased visual performance. For eyes with a large diameter, an equally larger retinal surface area can be assumed (Schmitz, Citation2009) and several studies have found a relationship between eye size and activity patterns and foraging/hunting behavior (Baker & Venditti, Citation2019; Potier et al., Citation2017; Thomas et al., Citation2006). Larger eyes generally operate better in low-light conditions or can resolve more details in a given light setting (Thomas et al., Citation2006; Warrant, Citation2004), implying that they are predominantly found in nocturnal and crepuscular species. However, the strict correlation between eye size and visual capabilities (and by inference behavioral properties) is more complicated. Visual performance is not just dependent on overall eye size but also on aperture and axial length. A larger aperture can potentially be achieved in large eyes, but the correlation is not straightforward (Schmitz, Citation2009). The same is true for axial length, but as eyeballs are not necessarily fully spherical, a large axial length can be achieved in eyes with a small diameter-to-length ratio (e.g., tubular eyes) (Schmitz & Motani, Citation2010).
It is further difficult for some vertebrate groups to confidently estimate eye size from orbit dimensions and shape (e.g., primates; Kirk, Citation2006) and eye size is more reliably recovered in large species (Schmitz, Citation2009). However, eye size estimates based on data for modern birds and crocodilians are very similar and the phylogenetic bracketing approach suggests that these estimates are reasonable for fossil archosauromorphs.
Based on the current data, large eyes appear predominantly in large-sized dinosaurs irrespective of diet, including sauropods, non-maniraptoriform theropods (e.g., Ceratosauria, Abelisauridae, Tyrannosauridae), and derived ornithopods and marginocephalians. While large eyes have been hypothesized to correlate with predatory behavior to aid in hunting (Lautenschlager, Citation2022), this can be ruled out as evolutionary pressure for herbivorous groups. However, non-predatory foraging requires good sensory acuity as well. Herbivores capable of locating plant resources efficiently or discriminating between low- and high-quality plants will benefit from increased food and nutrient intake. For many modern mammalian herbivores, olfactory cues produced by flowers and fruits, as well as leaf odors are relevant for selective foraging (Stutz et al., Citation2016), including some of the aforementioned megaherbivores with moderately sized eyes and low visual acuity, such as elephants (Schmitt et al., Citation2018); others rely on additional visual cues during foraging (Hirata et al., Citation2019; Howery et al., Citation2000; Stutz et al., Citation2017). Large eye sizes and, therefore, high visual acuity in dinosaurian megaherbivores are therefore not surprising and may have aided foraging in these groups.
Reconstructions of the endocranial anatomy of ornithopod and marginocephalian dinosaurs show enlarged olfactory bulbs in both natural and digital endocasts (Knoll et al., Citation2021; Lauters et al., Citation2022; Paulina-Carabajal et al., Citation2022) suggesting a good sense of smell. Optic lobes, which represent the brain region responsible for processing visual information, were not identified in ornithischian dinosaurs, with the exception of Leaellynasaura (Rich & Rich, Citation1989). However, these structures are usually obscured by the venous sinuses and may not be reconstructed due to poor specimen preservation, hence the absence of discernible optic lobes on endocasts is not necessarily evidence for a reduced size. As such, it is possible that large ornithopod and marginocephalian dinosaurs may have relied on a combination of olfactory and visual cues during foraging. Evidence from increased relative olfactory bulb size in theropods and neornithines suggests odor detection was an important part of hunting behavior (Zelenitsky et al., Citation2009, Citation2011). However, herbivorous and/or omnivorous theropods, such as ornithomimosaurs and oviraptorids, possessed the lowest olfactory acuity among non-avian theropods (Zelenitsky et al., Citation2009), but, based on data from this study, above-average relative orbit sizes (0.26–0.35) and estimated eye sizes of up to 68 mm.
Similarly, large eyes in both carnivorous and herbivorous species could have been an adaptation to hunting and foraging in low-light conditions as found in some modern bird species (Thomas et al., Citation2006). However, eye size alone is not sufficient to discriminate between different activity patterns and further information such as aperture size from preserved sclerotic rings would be required (Schmitz & Motani, Citation2010, Citation2011). Furthermore, different adaptations in the soft-tissue architecture of the eye, such as photoreceptor types (cone cells for color detection vs. rod cells for detection of light intensity) and density on the retinal surface, are common in nocturnal animals or those living in low-light environments (Warrant, Citation2004). As such, these features are not preserved in the fossil record and could further confound the identification of diel activity patterns. Similarly, sclerotic rings are only rarely preserved and the sample of species for which activity patterns have been reconstructed (Schmitz & Motani, Citation2011) is too low to make meaningful comparisons with our data. However, existing reconstructions indicate that nocturnality (inferred from orbit and sclerotic ring dimensions) is not correlated with body size in different dinosaur species (Choiniere et al., Citation2021; Schmitz & Motani, Citation2011). Alternatively, large eye size can also be indicative of habitat selection. For example, modern bird species that dwell in densely vegetated forested areas and understories possess larger eyes than species occupying open habitats (Ausprey, Citation2021; Martínez-Ortegaet al., 2014). Large eye size in archosaurian herbivores could therefore have provided an advantage in terms of habitat use rather than forage time.
CONCLUSION
The quantification of orbit and eye size across a wide range of archosaur groups demonstrates a strong and consistent relationship between these measurements and skull length with a high degree of predictability if one of these properties is known. Relative orbit size was found to be largely independent of phylogeny, temporal distribution and species richness suggesting that functional and physiological constraints imposed limits on minimum and maximum eye size. Our results thereby confirm previous assumptions and results relying on a substantially larger and more comprehensive sample size. The relatively largest eyes were predominantly found in small species and vice versa. Absolutely larger eyes, and thereby higher visual acuity, occurred in both carnivorous and herbivorous archosaur species, with herbivorous dinosaurs having some of the largest estimated eye sizes in the dataset. This implies an increased dependence on visual cues during foraging in groups such as derived ornithopods. However, orbit size alone was not found to provide additional detail on activity patterns, requiring further information from rarely preserved skeletal elements, such as sclerotic rings.
AUTHOR CONTRIBUTIONS
SL designed the study, supervised undergraduate students, prepared the manuscript and collected additional data. EMD helped with species richness analyses and collected additional data. CMB helped with supervision of undergraduate students and checked data. SL, EMD, and CMB contributed to the creation and writing of the final manuscript. All other authors collected data as part of an undergraduate module at the University of Birmingham.
SUPPLEMENTARY FILE(S)
Supplementary data. Species list_measurements_references.xlsx
Supplementary Table 1: ANCOVA results for major archosaur groups
Supplementary Table 2: ANCOVA results for major dinosaur groups
Supplemental Material
Download Zip (132.4 KB)ACKNOWLEDGMENTS
J. Marugan-Lobon is thanked for helpful comments on an earlier version of the manuscript. D. Cerio and K. Chapelle provided constructive reviews which considerably improved the manuscript.
DISCLOSURE STATEMENT
No potential conflict of interest was reported by the author(s).
LITERATURE CITED
- Angielczyk, K. D., & Schmitz, L. (2014). Nocturnality in synapsids predates the origin of mammals by over 100 million years. Proceedings of the Royal Society B, 281(1793), 20141642.
- Apaldetti, C., Martínez, R. N., Cerda, I. A., Pol, D., & Alcober, O. (2018). An early trend towards gigantism in Triassic sauropodomorph dinosaurs. Nature Ecology & Evolution, 2(8), 1227–1232.
- Ausprey, I. J. (2021). Adaptations to light contribute to the ecological niches and evolution of the terrestrial avifauna. Proceedings of the Royal Society B, 288(1950), 20210853.
- Baker, J., & Venditti, C. (2019). Rapid change in mammalian eye shape is explained by activity pattern. Current Biology, 29(6), 1082–1088.
- Bertrand, O. C., Shelley, S. L., Williamson, T. E., Wible, J. R., Chester, S. G., Flynn, J. J., … & Brusatte, S. L. (2022). Brawn before brains in placental mammals after the end-Cretaceous extinction. Science, 376(6588), 80–85.
- Bestwick, J., Godoy, P.L., Maidment, S.C., Ezcurra, M.D., Wroe, M., Raven, T.J., Bonsor, J.A. and Butler, R.J., 2022. Relative skull size evolution in Mesozoic archosauromorphs: potential drivers and morphological uniqueness of erythrosuchid archosauriforms. Palaeontology, 65(3), p.e12599.
- Bright, J. A. (2014). A review of paleontological finite element models and their validity. Journal of Paleontology, 88(4), 760–769.
- Bright, J. A., Marugán-Lobón, J., Cobb, S. N., & Rayfield, E. J. (2016). The shapes of bird beaks are highly controlled by nondietary factors. Proceedings of the National Academy of Sciences, 113(19), 5352–5357.
- Brooke, M. D. L., Hanley, S., & Laughlin, S. (1999). The scaling of eye size with body mass in birds. Proceedings of the Royal Society of London. Series B: Biological Sciences, 266(1417), 405–412.
- Brown, C. M., Evans, D. C., Campione, N. E., O'Brien, L. J., & Eberth, D. A. (2013). Evidence for taphonomic size bias in the Dinosaur Park Formation (Campanian, Alberta), a model Mesozoic terrestrial alluvial-paralic system. Palaeogeography, Palaeoclimatology, Palaeoecology, 372, 108–122.
- Cashmore, D. D., Butler, R. J., & Maidment, S. C. (2021). Taxonomic identification bias does not drive patterns of abundance and diversity in theropod dinosaurs. Biology Letters, 17(7), 20210168.
- Cerio, D. G., & Witmer, L. M. (2020). Modeling visual fields using virtual ophthalmoscopy: incorporating geometrical optics, morphometrics, and 3D visualization to validate an interdisciplinary technique. Vision Research, 167, 70–86.
- Cerio, D. G., & Witmer, L. M. (2023). Orbital soft tissues, bones, and allometry: Implications for the size and position of crocodylian eyes. The Anatomical Record, 306, 2537–2561.
- Choiniere, J.N., Neenan, J.M., Schmitz, L., Ford, D.P., Chapelle, K.E., Balanoff, A.M., Sipla, J.S., Georgi, J.A., Walsh, S.A., Norell, M.A. and Xu, X., 2021. Evolution of vision and hearing modalities in theropod dinosaurs. Science, 372(6542), 610–613.
- Chure D. J. (1998). On the orbit of theropod dinosaurs. GAIA: Revista de geociências, 15, 233–240.
- Cunningham, J. A., Rahman, I. A., Lautenschlager, S., Rayfield, E. J., & Donoghue, P. C. (2014). A virtual world of paleontology. Trends in Ecology & Evolution, 29(6), 347–357.
- Ezcurra, M. D. (2016). The phylogenetic relationships of basal archosauromorphs, with an emphasis on the systematics of proterosuchian archosauriforms. PeerJ, 4, e1778.
- Fernández, M. S., Archuby, F., Talevi, M., & Ebner, R. (2005). Ichthyosaurian eyes: paleobiological information content in the sclerotic ring of Caypullisaurus (Ichthyosauria, Ophthalmosauria). Journal of Vertebrate Paleontology, 25(2), 330–337.
- Foth, C., Brusatte, S. L., & Butler, R. J. (2012). Do different disparity proxies converge on a common signal? Insights from the cranial morphometrics and evolutionary history of Pterosauria (Diapsida: Archosauria). Journal of Evolutionary Biology, 25(5), 904–915.
- Hall, M. I. (2008a). The anatomical relationships between the avian eye, orbit and sclerotic ring: implications for inferring activity patterns in extinct birds. Journal of Anatomy, 212(6), 781–794.
- Hall, M. I. (2008b). Comparative analysis of the size and shape of the lizard eye. Zoology, 111(1), 62–75.
- Hall, M. I., & Heesy, C. P. (2011). Eye size, flight speed and Leuckart's Law in birds. Journal of Zoology, 283(4), 291–297.
- Hall, M. I., & Ross, C. F. (2007). Eye shape and activity pattern in birds. Journal of Zoology, 271(4), 437–444.
- Hammer, Ø., & Harper, D. A. (2001). Past: paleontological statistics software package for educaton and data anlysis. Palaeontologia Electronica, 4(1), 1.
- Heesy, C. P., & Hall, M. I. (2010). The nocturnal bottleneck and the evolution of mammalian vision. Brain, Behavior and Evolution, 75(3), 195–203.
- Henderson D. M. (2003). The eyes have it: the sizes, shapes, and orientations of theropod orbits as indicators of skull strength and bite force. Journal of Vertebrate Paleontology, 22, 766–778.
- Hirata, M., Arimoto, C., Hattori, N., & Anzai, H. (2019). Can cattle visually discriminate between green and dead forages at a short distance while moving in the field?. Animal Cognition, 22, 707–718.
- Howery, L. D., Bailey, D. W., Ruyle, G. B., & Renken, W. J. (2000). Cattle use visual cues to track food locations. Applied Animal Behaviour Science, 67(1–2), 1–14.
- Howland, H. C., Merola, S., & Basarab, J. R. (2004). The allometry and scaling of the size of vertebrate eyes. Vision research, 44(17), 2043–2065.
- Kiltie, R. A. (2000). Scaling of visual acuity with body size in mammals and birds. Functional Ecology, 14(2), 226–234.
- Kirk, E. C. (2006). Effects of activity pattern on eye size and orbital aperture size in primates. Journal of Human Evolution, 51(2), 159–170.
- Knell, R. J., Naish, D., Tomkins, J. L., & Hone, D. W. (2013). Sexual selection in prehistoric animals: detection and implications. Trends in Ecology & Evolution, 28(1), 38–47.
- Knoll, F., Lautenschlager, S., Kawabe, S., Martínez, G., Espílez, E., Mampel, L., & Alcalá, L. (2021). Palaeoneurology of the early cretaceous iguanodont Proa valdearinnoensis and its bearing on the parallel developments of cognitive abilities in theropod and ornithopod dinosaurs. Journal of Comparative Neurology, 529(18), 3922–3945.
- Laughlin, S. B., de Ruyter van Steveninck, R. R., & Anderson, J. C. (1998). The metabolic cost of neural information. Nature Neuroscience, 1(1), 36–41.
- Lautenschlager, S. (2013). Cranial myology and bite force performance of Erlikosaurus andrewsi: a novel approach for digital muscle reconstructions. Journal of Anatomy, 222(2), 260–272.
- Lautenschlager, S. (2022). Functional and ecomorphological evolution of orbit shape in Mesozoic archosaurs is driven by body size and diet. Communications Biology, 5(1), 1–11.
- Lauters, P., Vercauteren, M., & Godefroit, P. (2022). Endocasts of ornithopod dinosaurs: Comparative anatomy. Progress in Brain Research, 275, 1–23
- Lönnstedt, O. M., McCormick, M. I., & Chivers, D. P. (2013). Predator-induced changes in the growth of eyes and false eyespots. Scientific Reports, 3(1), 2259.
- Maddison, W. P., & Maddison, D. R. (2021). Mesquite: a modular system for evolutionary analysis, v. 3.70. See http://mesquiteproject.org.
- MacIver, M.A., Schmitz, L., Mugan, U., Murphey, T.D. and Mobley, C.D. (2017). Massive increase in visual range preceded the origin of terrestrial vertebrates. Proceedings of the National Academy of Sciences, 114(12), E2375–E2384.
- Marcé-Nogué, J., Fortuny, J., De Esteban-Trivigno, S., Sánchez, M., Gil, L., & Galobart, À. (2015). 3D computational mechanics elucidate the evolutionary implications of orbit position and size diversity of early amphibians. PLoS ONE, 10(6), e0131320.
- Martin, G. R. (1983). Schematic eye models in vertebrates. In Progress in sensory physiology (pp. 43–81). Springer, Berlin, Heidelberg.
- Martin, G. R. (1994). Form and function in the optical structure of bird eyes. In Perception and motor control in birds (pp. 5–34). Springer, Berlin, Heidelberg.
- Martin, G. R. (2017). The sensory ecology of birds. Oxford University Press, Oxford.
- Martin, G. R., & Katzir, G. (2000). Sun shades and eye size in birds. Brain Behavior and Evolution, 56(6), 340–344.
- Martínez-Ortega, C., Santos, E. S., & Gil, D. (2014). Species-specific differences in relative eye size are related to patterns of edge avoidance in an Amazonian rainforest bird community. Ecology and Evolution, 4(19), 3736–3745.
- Marugán-Lobón, J., & Buscalioni, Á. D. (2003). Disparity and geometry of the skull in Archosauria (Reptilia: Diapsida). Biological Journal of the Linnean Society, 80(1), 67–88.
- Marugán-Lobón, J., Gómez-Recio, M., & Nebreda, S. M. (2022). The geometry of synapsid skull disparity. Historical Biology, 34(8), 1692–1700.
- Moran, D., Softley, R., & Warrant, E. J. (2015). The energetic cost of vision and the evolution of eyeless Mexican cavefish. Science Advances, 1(8), e1500363.
- Motani, R., Rothschild, B. M., & Wahl, W. (1999). Large eyeballs in diving ichthyosaurs. Nature, 402(6763), 747–747.
- Nilsson, D. E., Warrant, E. J., Johnsen, S., Hanlon, R., & Shashar, N. (2012). A unique advantage for giant eyes in giant squid. Current Biology, 22(8), 683–688.
- O’Gorman, E. J., & Hone, D. W. (2012). Body size distribution of the dinosaurs. PLoS ONE, 7(12), e51925.
- Paulina-Carabajal, A., Bronzati, M., & Cruzado-Caballero, P. (2022). Paleoneurology of Non-avian Dinosaurs: An Overview. In M.T. Dozo, A. Paulina-Carabjal, T.E. Macrini, and S. Walsh (Eds), Paleoneurology of Amniotes: New Directions in the Study of Fossil Endocasts, (pp. 267–332). Springer.
- Pinheiro, J., Bates, D., Debroy, S. & Sarkar, D. (2018). nlme: linear and nonlinear mixed effects models. R package 3.1-137. https://CRAN.R-project.org/package=nlme
- Potier, S., Mitkus, M., Bonadonna, F., Duriez, O., Isard, P. F., Dulaurent, T., Mentek, M. & Kelber, A. (2017). Eye size, fovea, and foraging ecology in accipitriform raptors. Brain Behavior and Evolution, 90(3), 232–242.
- R Core Team. (2023). R: A language and environment for statistical computing. Vienna, Austria: R Foundation for Statistical Computing. https://cran.r-project.org
- Rich, T. H., & Rich, P. V. (1989). Polar dinosaurs and biotas of the Early Cretaceous of southeastern Australia: National Geographic Society Research Reports, v. 5.
- Rinehart, L. F., Lucas, S. G., Heckert, A. B., Spielmann, J. A., & Celeskey, M. D. (2009). The Paleobiology of Coelophysis bauri (Cope) from the Upper Triassic (Apachean) Whitaker quarry, New Mexico, with detailed analysis of a single quarry block: Bulletin 45 (Vol. 45). New Mexico Museum of Natural History and Science.
- Ross, C. F., Hall, M. I., & Heesy, C. P. (2007). Were basal primates nocturnal? Evidence from eye and orbit shape. In M.J. Ravosa & M. Dagosto (Eds), Primate origins: Adaptations and Evolution (pp. 233–256). Springer.
- Schmitt, M. H., Shuttleworth, A., Ward, D., & Shrader, A. M. (2018). African elephants use plant odours to make foraging decisions across multiple spatial scales. Animal Behaviour, 141, 17–27.
- Schmitz, L. (2009). Quantitative estimates of visual performance features in fossil birds. Journal of Morphology, 270(6), 759–773.
- Schmitz, L., & Motani, R. (2010). Morphological differences between the eyeballs of nocturnal and diurnal amniotes revisited from optical perspectives of visual environments. Vision Research, 50(10), 93–946.
- Schmitz, L., & Motani, R. (2011). Nocturnality in dinosaurs inferred from scleral ring and orbit morphology. Science, 332(6030), 705–708.
- Stevens K.A. (2006). Binocular vision in theropod dinosaurs. Journal of Vertebrate Paleontology, 26, 321–330.
- Stutz, R. S., Banks, P. B., Proschogo, N., & McArthur, C. (2016). Follow your nose: leaf odour as an important foraging cue for mammalian herbivores. Oecologia, 182, 643–651.
- Stutz, R. S., Croak, B. M., Proschogo, N., Banks, P. B., & McArthur, C. (2017). Olfactory and visual plant cues as drivers of selective herbivory. Oikos, 126(2), 259–268.
- Thomas, R. J., Székely, T., Powell, R. F., & Cuthill, I. C. (2006). Eye size, foraging methods and the timing of foraging in shorebirds. Functional Ecology, 20, 157–165.
- Warrant, E. (2004). Vision in the dimmest habitats on earth. Journal of Comparative Physiology A, 190, 765–789.
- Witmer, L. M. (1995). Homology of facial structures in extant archosaurs (birds and crocodilians), with special reference to paranasal pneumaticity and nasal conchae. Journal of Morphology, 225(3), 269–327.
- Witmer, L. M., & Thomason, J. J. (1995). The extant phylogenetic bracket and the importance of reconstructing soft tissues in fossils. Functional morphology in vertebrate paleontology, 1, 19–33.
- Witmer, L. M., Ridgely, R. C., Dufeau, D. L., & Semones, M. C. (2008). Using CT to peer into the past: 3D visualization of the brain and ear regions of birds, crocodiles, and nonavian dinosaurs. In H. Endo & R. Frey (Eds), Anatomical imaging: towards a new morphology (pp. 67–87). Springer.
- Zanno, L. E., & Makovicky, P. J. (2013). No evidence for directional evolution of body mass in herbivorous theropod dinosaurs. Proceedings of the Royal Society B: Biological Sciences, 280(1751), 20122526.
- Zaret, T. M., & Kerfoot, W. C. (1975). Fish predation on Bosmina longirostris: Body-size selection versus visibility selection. Ecology, 56(1), 232–237.
- Zelenitsky, D. K., Therrien, F., & Kobayashi, Y. (2009). Olfactory acuity in theropods: palaeobiological and evolutionary implications. Proceedings of the Royal Society B: Biological Sciences, 276(1657), 667–673.
- Zelenitsky, D. K., Therrien, F., Ridgely, R. C., McGee, A. R., & Witmer, L. M. (2011). Evolution of olfaction in non-avian theropod dinosaurs and birds. Proceedings of the Royal Society B: Biological Sciences, 278(1725), 3625–3634