
 ?Mathematical formulae have been encoded as MathML and are displayed in this HTML version using MathJax in order to improve their display. Uncheck the box to turn MathJax off. This feature requires Javascript. Click on a formula to zoom.
Abstract
The distribution of key chemicals in mainstream cigarette smoke (MCS) particles of different sizes have implications for respiratory dose. In this study, a differential mobility spectrometer (DMS) and an electrical low-pressure impactor (ELPI) were used to characterize MCS particles generated from three cigarettes (3R4F, Dunhill, and Hongtashan). In addition, the ELPI was used to collect smoke particles of three different aerodynamic diameters (144, 431, and 722 nm) from 3R4F MCS, which were analyzed for nicotine, solanesol and tobacco-specific nitrosamines (TSNAs). The number concentration, particle size distribution, and count median diameter (CMD) of the MCS particles characterized by DMS and ELPI were compared quantitatively. The observed difference in the physical characterization results of MCS particles may be due to a myriad of discrepancies between the two techniques. Chemical analyses of the three ELPI selected particle sizes showed that, after normalization to total particulate matter (TPM), nicotine and TSNAs were distributed evenly, whereas solanesol showed a tendency to increase with increasing particle diameter. Notably, the distribution of nicotine and four TSNAs was independent of the three particle sizes; however, the amount of solanesol showed a slight dependency on particle size, varying by less than 23.4% over the size range considered.
1. Introduction
Mainstream cigarette smoke (MCS) consists of a complex physical mixture of gases and particles that are formed through incomplete combustion of tobacco (Wynder and Hoffmann Citation1967; Stedman Citation1968; Schmeltz Citation1972; Baker Citation2006). MCS comprises more than 7000 chemical constituents (Rodgman and Perfetti Citation2013), about 150 of which are thought to be toxicants. During cigarette smoking, the chemical compounds from the burning tobacco nucleate, condense and coagulate, and form various sizes of particles, generally as a log-normal distribution (Baker and Dixon Citation2006). The particles are typically sub-micron and are readily inhaled into the respiratory tract and lungs of smokers. Chemicals carried by MCS particles are associated with diseases such as chronic obstructive pulmonary disease and lung cancer (US DHHS, Citation2014). To predict the deposition of smoke particles in the lung, the size distribution and number concentration of MCS particles should be measured accurately (Kane et al. Citation2010; Sahu et al. Citation2013). In addition, it is important to know the distribution of chemicals in smoke particles of different sizes for assessing the potential changes in chemical deposition and clearance pattern in the lungs.
Particle size distribution and number concentration, important parameters in the characterization of MCS, have long been of interest to researchers in the fields of tobacco science, aerosol science and respiratory toxicology (Chang, Peters, and Ueno Citation1985; Davies Citation1988; Martonen Citation1992; Baker and Dixon Citation2006). Numerous techniques have been developed to measure aerosol particles; however, MCS is a very dynamic aerosol system, with an extremely high particle concentration. Indeed, the concentration of fresh cigarette smoke is 108–1010 particles/cm3; as a result, not all aerosol measurement techniques are applicable to MCS. Furthermore, the dominant mechanism underlying particle size changes is coagulation, which is dependent on the residence time of the smoke particles (Kane et al. Citation2010). In other words, smoke particles will coagulate in the mouth both during puffing and during any mouth hold prior to inhalation, resulting in changes in smoke particle size.
Kijowski (Citation1985) reviewed particle size studies on cigarette smoke, describing measurements by microscopy (Holmberg and Yeatts Citation1976), a light scattering technique (Leaderer et al. Citation1984), an aerodynamic particle sizer (McCusker et al. Citation1982), a centrifugal method (Hinds Citation1978), and other methods. Due to its high particle number concentration, however, fresh MCS is an extremely dynamic system and many of the techniques employed for stable aerosol are not applicable to the rapidly changing aerosol of MCS. Therefore, it is important that steps are taken to avoid coagulation of the smoke particles in the time interval between smoke generation and particle measurements. In most measurement techniques, fresh smoke is diluted to minimize the effects of coagulation (Ingebrethsen Citation1986). According to a review of various studies on MCS particles (Bernstein Citation2004), the reported count median diameter (CMD) ranged from 90 to 420 nm. The variety of approaches, dilution ratios, and aging times applied in those studies are contributing factors in the lack of agreement among reported data (Alderman and Ingebrethsen Citation2011).
More recently, with the development of new technologies, two approaches enabling real-time measurements of smoke particles have been developed for the characterization of MCS. First, a differential mobility spectrometer (DMS) facilitates the measurement of a particle’s electrical mobility diameter (Dm), which is dependent on the ratio of charge to aerodynamic drag. The DMS-500 (Model DMS-500, Cambustion, Cambridge, UK) with 38 channels measures particles with mobility sizes ranging from 5 to 1000 nm (Symonds et al. Citation2007). Adam et al. (Citation2009) used a DMS to measure smoke particles generated from a pure Virginia tobacco cigarette with a reported CMDm ranging from 180 to 280 nm and a number concentration ranging from 1.4 × 10⁹ to 1.5 × 10¹⁰ particles/cm3. Alderman and Ingebrethsen (Citation2011) combined a smoking cycle simulator (SCS) with a DMS (SCS-DMS) to characterize MCS particles from 21 brands of commercial cigarettes under two puffing conditions. They found that the CMDm of MCS smoked under the more intense puffing conditions of 60-mL volume/2-s duration was 145–189 nm, which was 12–22 nm smaller than that measured under the standard ISO 35-mL volume/2-s duration puffing conditions (ISO Citation2012). The number concentration of MCS particles from all brands of cigarette was in the range of 3.32 × 10⁹ to 10.6 × 10⁹ particles/cm3.
Second, an electrical low-pressure impactor (ELPI) is a cascade impactor for real-time measurement of a particle’s aerodynamic diameter (Da), which is defined as the diameter of a spherical particle with a density of 1000 kg/m3 and the same settling velocity. The ELPI with 12 stage impactors and multichannel electrometers measures particles with aerodynamic sizes ranging from 7 nm to 10 μm (Keskinen, Pietarinen, and Lehtimäki Citation1992). Becquemin et al. (Citation2009) used a smoking machine (SM) coupled with an ELPI to measure the particle size of MCS generated from six types of cigarette, reporting CMDa ranging from 210 to 290 nm. There was no significant difference in particle size among the cigarettes tested. In addition, Kane et al. (Citation2010) investigated puffing conditions that affect the particle size distribution and number concentration of fresh MCS by an ELPI technique. They found that higher puff flow rates and lower filter ventilation led to smaller CMDa of smoke particles, consistent with reduced time for coagulation. Xiang et al. (Citation2014) also used an ELPI to characterize the particles of MCS generated by a single-channel SM. They reported that the aerodynamic diameter of cigarette smoke ranged from 21 to 1956 nm and the particle number concentrations were on the order of 105–109 particles/cm3 for different sizes of smoke particles.
Various methods have been used to measure the distribution of chemicals in MCS particles of different sizes (Jones et al. Citation1975; Morie and Baggett Citation1977; Jenkins et al. Citation1979). For example, Jones et al. (Citation1975) used a centrifugal size classifier to collect particles with diameters of 150–1540 nm and characterized the distribution of C14-labeled dotriacontane, C14-labeled hexadecane, decachlorobiphenyl, and C14-labeled nicotine added to cigarettes with respect to smoke particle size. In addition, Morie and Baggett (Citation1977) used a cascade impactor to study the distribution of nicotine, indole, and other compounds in smoke particles of different sizes. Lastly, Jenkins et al. (Citation1979) employed a combination of radiolabeled materials and size separation of the labeled particles by a spiral centrifuge to study the chemical variability of MCS as a function of aerodynamic particle size.
Although there has been progressing in the characterization of MCS particles using ELPI and DMS systems, it is difficult to compare published data from measurements of MCS by these techniques owing to the variety of cigarettes tested, the differing principles of instrument operation, and the differing dilution ratios of cigarette smoke (Adam et al. Citation2009; Becquemin et al. Citation2009; Kane et al. Citation2010; Alderman and Ingebrethsen Citation2011; Xiang et al. Citation2014). Therefore, it is important to compare the two techniques with the same test cigarettes to clarify reported differences in the CMD and number concentration of MCS particles. In addition, the ELPI is a useful instrument that, by placing aluminum foil on the impactors, facilitates the collection of particles of various sizes for further analysis.
In this study, the CMD and number concentration of MCS particles generated from three different cigarettes (University of Kentucky 3R4F reference cigarette and two commercial cigarettes, Hongtashan and Dunhill) were measured by both ELPI and DMS systems, and the data were compared. In addition, SM-ELPI and SCS-ELPI were used to generate and collect MCS particles of various aerodynamic diameters ranging from 7 nm to 10 μm from the 3R4F reference cigarette. After normalization of the data to total particulate matter (TPM), the distribution of nicotine, solanesol, and four tobacco-specific N′-nitrosamines (TSNAs) in smoke particles of different sizes (Da, 144, 431, and 722 nm) was assessed.
2. Material and methods
2.1. Cigarettes
Kentucky reference cigarettes 3R4F were obtained from the University of Kentucky (Center for Tobacco Reference Products, University of Kentucky, Lexington, KY). The Dunhill and Hongtashan cigarettes were sourced from British (British American Tobacco Company, London, UK) and Chinese (China tobacco Yunnan industrial Co., Ltd, Kunming, China) markets, respectively. The filter ventilation, pressure drop, and tar yield of the three products are shown in .
Table 1. Parameters of cigarette samples.
All cigarettes were conditioned at 22 ± 1 °C and 60 ± 3% relative humidity for more than 48 h before analyses.
2.2. Experimental set-up
In this work, physical characterization of MCS particles was carried out by using an SCS-DMS system and an SM-ELPI system. In addition, chemical characterization of size-fractionated MCS particles for nicotine, solanesol, and TSNAs by an SCS-ELPI and an SM-ELPI was performed.
2.2.1. Measurements of MCS by SCS-DMS
The instrumental set-up of the SCS-DMS system has been described in detail elsewhere (Alderman and Ingebrethsen Citation2011). In brief, the SCS is used to produce flow from the cigarette and apply the first dilution of smoke. The MCS particles are then introduced into the DMS system for the second dilution and physical characterization. The SCS sample head contains a pinch valve that is closed between puffs. To create a puff through the cigarette, the pinch valve is opened and the variable valve is closed slightly. Cigarette smoke is then drawn into the DMS through an orifice, whose pressure drop can be measured and which can strictly control the smoking flow by variable dilution, whilst maintaining constant volume sampling (25 L/min). After passing through a rotary diluter (dilution ratio, 25:1), the smoke particles are charged by a corona diffusion charger and then drawn into the DMS classifier. The trajectories of particles within the classifier are dependent on their mobility. In the SCS-DMS system, the MCS is produced via the ISO puffing regime (puff volume, 35 mL; puff duration, 2 s; puff interval, 60 s) (ISO Citation2012). The total dilution ratio of smoke particles is approximately 600:1.
2.2.2. Measurement of MCS by SM-ELPI
The set-up of a single-channel SM coupled to an ELPI (SM-ELPI) has been described in previous work (Xiang et al. Citation2014). In brief, the SM is used to produce smoke from the cigarette under the ISO puffing regime. In contrast to the SCS system, only a small amount of smoke (4 mL) is introduced into the ELPI for physical characterization. By means of pressurized air, the smoke is drawn into two consecutive ejector diluters, each with the same dilution ratio of 8.6 and then drawn into the ELPI. The ELPI comprises a corona charger, which is used to charge the particles; 12 impactors; and a multichannel electrometer. The 12 different impactors each have a progressively smaller aerodynamic cutoff diameter and the particles that are collected at each stage are quantified by the multichannel electrometer. The inlet flow of the ejector diluters and the ELPI is 5 L/min and 10 L/min, respectively. In the SM-ELPI system, the MCS is produced via the ISO puffing regime. The total dilution ratio of smoke particles is approximately 1700:1.
2.2.3. Collection of MCS by SCS-ELPI and SM-ELPI
To collect MCS particles by the ELPI, the ELPI was coupled either to the SCS or to the SM. In the SCS-ELPI set-up, the SCS was connected directly to the ELPI. With auto-adjustment of the variable valve, the ISO puffing profile was produced and the whole smoke sample was introduced into the ELPI.
In the SM-ELPI set-up, the SM was connected to the inlet of the ELPI via a three-way connection. Dilution air and smoke particles were drawn into the ELPI under the negative pressure effect. The SM controlled an electromagnetic valve, which was opened to create a 2-s puff. By adjusting the flow of dilution air, a square-profile 35-mL puff was produced.
2.3. Analysis of nicotine, solanesol, and TSNAs
2.3.1. Collection of MCS
For the chemical analysis of different-size smoke particles, MCS was generated from 3R4F cigarettes by either the SM or SCS and drawn into the ELPI. The smoke particles were deposited, according to their aerodynamic diameter, on 12 aluminum foils on the surface of the impactors. For each analysis, 10 cigarettes were smoked and the whole 35-mL volume smoke of every puff (n = 7 puffs) was introduced into the ELPI and deposited on the aluminum foils. The foils were then removed from the impactors and weighed. TPM from the fourth (Da, 144 nm), sixth (Da, 431 nm), and seventh (Da, 722 nm) foil was subjected to chemical analysis.
2.3.2. Chemical analysis of nicotine
For nicotine analysis, the smoke particles collected on the aluminum foils were removed into sample vials and extracted with 5 mL of 2-propanol solution containing 2-methyl quinoline, which was used as an internal standard. After oscillation for 30 min, the extract was syringe-filtered through a 0.22-μm membrane directly into an autosampler vial and then analyzed by gas chromatography and mass spectrometry (GC-MS). One microliter of extract was injected and the nicotine was separated by using a DB-35MS capillary column with an injector temperature of 250 °C, a flow rate of 1.0 mL/min and the following capillary column temperature program: initial temperature, 100 °C; hold for 3 min; ramp, 8 °C/min to 260 °C; hold for 10 min. For mass spectrometry, the SIM mode was used for determination of nicotine (m/z 84) and 2-methyl quinoline (m/z 143).
2.3.3. Chemical analysis of solanesol
For solanesol analysis, each foil was placed into a sample vial and 3 mL of methanol was added. After shaking for 60 min, the extract was syringe-filtered through a 0.22-μm membrane directly into an autosampler vial and then analyzed by high-performance liquid chromatography (HPLC). A 100-μl aliquot of extract was injected and solanesol was determined by using a C18 (ODS) column (250 mm × 3.0 mm id, 5.0 μm) with a mobile phase of 95:5 acetonitrile/methanol (v/v), a flow rate of 0.5 mL/min, and a detector wavelength of 205 nm.
2.3.4. Chemical analysis of TSNAs
For the analysis of four TSNAs, specifically nitrosoanabasine (NAB), nitrosoanatabine (NAT), 4-(methylnitrosamino)-1-(3-pyridyl)-1-butanone (NNK), and N′-nitrosonornicotine (NNN), the foils were transferred to a flask with 5 mL of 0.1 M ammonium acetate solution, and an internal standard solution containing NAB-d4, NAT-d4, NNK-d4, and NNN-d4 was added. After shaking for 30 min, the extract was syringe-filtered through a 0.22-μm membrane directly into an autosampler vial. A 2-μl aliquot of extract was injected and analyzed by HPLC tandem mass spectrometry (HPLC-MS/MS). The TSNAs and deuterated TSNAs were separated by using a Zorbax Eclipse XDB-C18 column (150 mm × 4.6 mm id, 5.0 μm) with the following linear gradient of A (10 mM ammonium formate in water) and B (acetonitrile): 10:90 A/B (v/v) from 0 to 3 min; 25:75 A/B from 3 to 7 min; 10:90 A/B from 7 to 8 min; 10:90 A/B hold until 12 min.
3. Results
3.1. Physical characterization of MCS particles
3.1.1. Number concentration of MCS particles
The number concentration of MCS particles from the three test products measured by the SCS-DMS method is shown in . For the 3R4F, Hongtashan, and Dunhill products, the particle number concentration increased by approximately 122, 141, and 183%, respectively, from the first to the last puff. The particle concentrations of MCS from the three products were different: for the 3R4F (tar yield, 9.2 mg), Hongtashan (tar yield, 7 mg), and Dunhill (tar yield, 4 mg) products, the number concentration of the last puff of MCS was 6.20 × 10⁹, 5.74 × 10⁹, and 3.63 × 10⁹ particles/cm3, respectively. Thus, the higher the tar yield of the cigarette, the higher the particle concentration of the MCS.
Figure 1. Number concentration of MCS particles from three brands of cigarette. (a) Measured by SCS-DMS. (b) Measured by SM-ELPI.
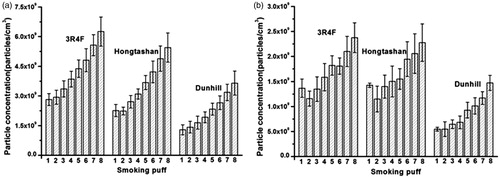
shows the particle concentration of MCS from the three test products measured by the SM-ELPI method. Similar to the SCS-DMS system, the particle concentration tended to increase with puff number for all three products, and the last puff had the highest particle concentration. The particle concentration of the last puff of MCS from the 3R4F, Hongtashan, and Dunhill products was 2.38 × 10⁹, 2.28 × 10⁹, and 1.47 × 10⁹ particles/cm3, respectively. Comparison of the data from SCS-DMS and SM-ELPI showed that the particle number concentration measured by SCS-DMS was 2.5-fold higher than that measured by SM-ELPI.
3.1.2. Particle size distribution and count median diameter of MCS
To compare the particle sizes obtained by the DMS and ELPI systems, the mobility diameter and aerodynamic diameter must be converted to the same domain. Hinds (Citation1999) described the relationship relating the mobility diameter to the aerodynamic diameter as follows:
(1)
(1)
where Dm and Da are the mobility and the aerodynamic diameter, respectively; Cs is the Cunningham slip correction factor; ρ0 is the reference density (1 g cm−3); ρp is the density of the particles, and χ is the shape factor. The shape factor is 1 for spherical cigarette smoke particles (Johnson et al. Citation2015). For particles overlapping in size, the slip correction should be negligible (Khlystov, Stanier, and Pandis Citation2004). Thus, the relationship of Dm and Da will become
(2)
(2)
The effective density of cigarette smoke particles is 1.18 g cm−3 (Johnson et al. Citation2015). Thus,
(3)
(3)
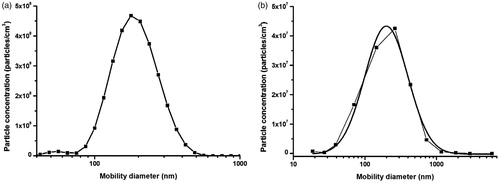
The size distribution of smoke particles measured by the SCS-DMS and the SM-ELPI is shown in . In general, the particle size distribution showed a log-normal distribution (positively skewed) in both sets of measurements. Due to different particle classification, the results from the SCS-DMS and SM-ELPI methods showed a slight variation in particle size distribution patterns. The geometric standard deviation (GSD) for the particle size distribution of MCS measured by SCS-DMS was 1.44 ± 0.05, which is approximately equal to data reported using DMS (Adam et al. Citation2009). The GSD from the SM-ELPI method was 2.29 ± 0.17, which is approximately equal to the data reported using ELPI (Becquemin et al. Citation2009).
Figure 2. Size distribution of smoke particles of the third puff of a 3R4F cigarette. (a) Measured by SCS-DMS. (b) Measured by SM-ELPI.
The log-normal fit CMDm of MCS particles was measured from the particle size distributions. shows the CMDm of MCS particles from the three test cigarettes measured by SCS-DMS. In general, the CMDm decreased puff by puff for all three types of cigarette. Thus, from the first puff to the last puff, the CMDm decreased from 195 to 174, 210 to 177, and 208 to 175 nm for MCS particles from 3R4F, Hongtashan, and Dunhill, respectively. Thus, there was no obvious difference in the particle size distribution of MCS among the three products.
Figure 3. CMDm of MCS particles from 3 brands of cigarette. (a) Measured by SCS-DMS. (b) Measured by SM-ELPI.
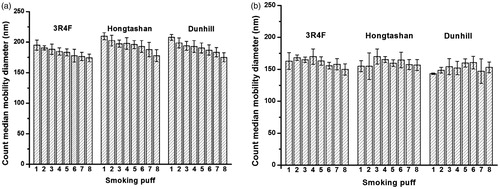
The log-normal fit CMDm of MCS particles from the three test cigarettes measured by SM-ELPI is shown in . In contrast to the data obtained by the SCS-DMS method, no obvious puff-by-puff decrease in CMDm was observed. The CMDm varied from 150 to 170, 155 to 170, and 143 to161 nm for MCS particles from 3R4F, Hongtashan, and Dunhill, respectively. Overall, the CMDm measured by SM-ELPI was in the same range for the three brands of cigarette. Notably, the CMDm values measured by SM-ELPI were slightly smaller than those measured by SCS-DMS.
3.2. Distribution of nicotine, solanesol, and TSNAs in the fractions of MCS particles
3.2.1. TPM collected on ELPI aluminum foil
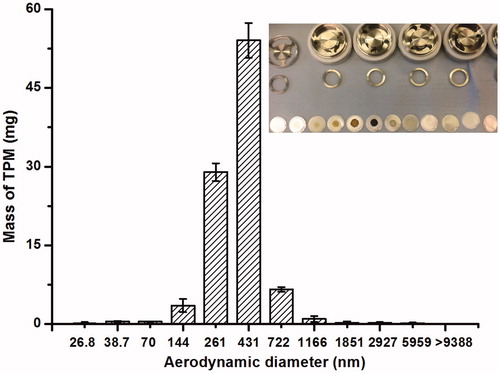
In a preliminary analysis of the size distribution of particles in MCS, 10 3R4F cigarettes were smoked by the SM or SCS, and the TPM for each of the different aerosol sizes was collected. As shown in , MCS particles were deposited mainly on the fourth (Da, 144 nm), fifth (Da, 261 nm), sixth (Da, 431 nm), and seventh (Da, 722 nm) aluminum foil, with only a small quantity of particles deposited on the eight other foils. Where more particles were collected, a darker color of aluminum foil was observed. The mass ratio of the TPM collected on the sixth, fifth, seventh, and fourth aluminum foil was 13:8:1.5:1.
Figure 4. Mass of TPM collected on 12 aluminum foils.
To characterize the distribution tendency of selected chemicals in different MCS particles sizes (Da, 144, 431, and 722 nm), three representative TPM samples collected on aluminum foil from three different impactor stages (fourth, sixth, and seventh) after both SCS-ELPI (n = 3) and SM-ELPI (n = 3) were analyzed.
3.2.2. Distribution of nicotine in three fractions of MCS particles
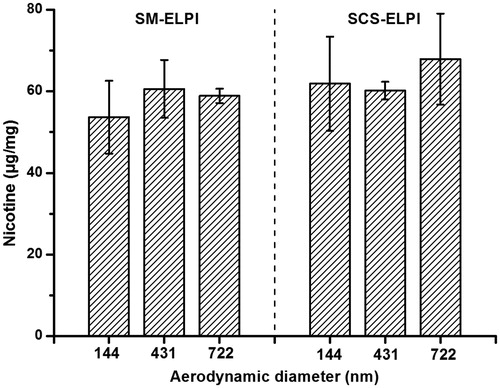
For nicotine, quantitative analysis of the TPM extract samples from the fourth, sixth, and seventh aluminum foil was conducted by GC-MS. For each foil analyzed, the total amount of nicotine was divided by the amount of TPM. The distribution of nicotine in MCS particles of different sizes is shown in , which indicates that the average amount of nicotine was approximately 60 μg per mg of TPM. There was no obvious difference in the nicotine to TPM mass ratio of different particle sizes, indicating that the distribution of nicotine in TPM is independent of particle size.
Figure 5. Distribution of nicotine in MCS particles of different sizes determined by SM-ELPI and SCS-ELPI.
3.2.3. Distribution of solanesol in three fractions of MCS particles
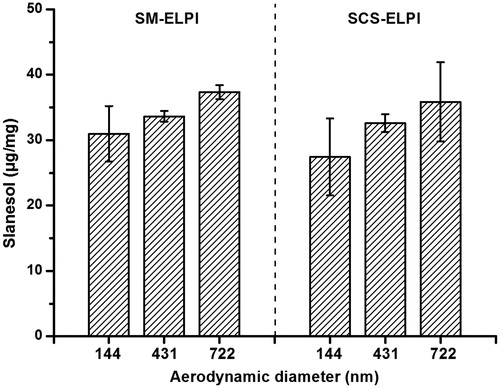
For solanesol, quantitative analysis of the TPM extract samples from the fourth, sixth, and seventh aluminum foil was conducted by HPLC. For each foil analyzed, the total amount of solanesol was divided by the amount of TPM. The distribution of solanesol in MCS particles of different sizes is shown in , which indicates that the average amount of solanesol was approximately 35 μg per mg of TPM. Both sets of data showed a slight trend of increasing solanesol with particle size; in other words, solanesol was more likely to be present in larger MCS particles.
Figure 6. Distribution of solanesol in MCS particles of different sizes determined by SM-ELPI and SCS-ELPI.
3.2.4. Distribution of TSNAs in three fractions of MCS particles
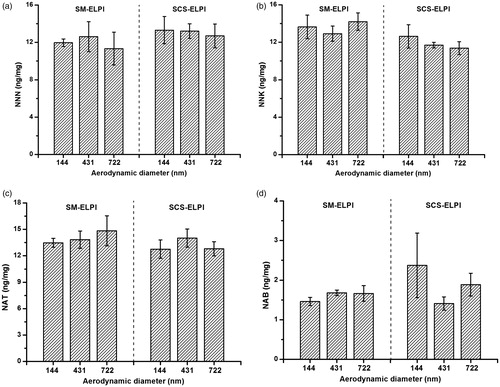
For TSNAs, quantitative analysis of the TPM extract samples from the fourth, sixth, and seventh aluminum foil was conducted by HPLC-MS/MS. The distribution of NNN, NAT, NAB, and NNK in MCS particles of different sizes is shown in . The average amount of each TSNAs was approximately 12, 13, 13, and 1.7 ng per mg of TPM for NNN, NNK, NAT, and NAB, respectively. There was no obvious trend in the distribution of TSNAs in particles of different sizes, indicating that the distribution of TSNAs in MCS particles is independent of particle size. The standard deviation for the analysis results of NAB was larger, reflecting the lower level of NAB in particles of MCS.
Figure 7. Distribution of TSNAs in MCS particles of different sizes determined by SM-ELPI and SCS-ELPI. (a) NNN; (b) NNK; (c) NAT; (d) NAB.
4. Discussion
In this work, the SCS-DMS and SM-ELPI systems were used to measure the number concentration and CMDm of MCS particles generated from three types of cigarette. An ELPI was then used to collect smoke particles of representative sizes from 3R4F MCS, which were analyzed for nicotine, solanesol, and TSNAs.
4.1. Trend in particle concentration of MCS
Both SCS-DMS and SM-ELPI showed that the particle concentration of MCS increased with the tar yield of the product, indicating that the particle number concentration is closely related to TPM. In addition, the particle concentration of MCS increased with puff number, owing to a decrease in filtration of the tobacco rod and coagulation of particles.
The rise in particle number with increasing puff number probably has its origin in the reduction of cigarette length. The filtering effect of the tobacco rod itself is decreased, and the time for particle coagulation is lowered (Adam et al. Citation2009).
For the 3R4F reference cigarette, the particle number concentration measured by SCS-DMS ranged from 2.85 × 10⁹ to 6.2 × 10⁹ particles/cm3 and that measured by SM-ELPI ranged from 1.16 × 10⁹ to 2.38 × 10⁹ particles/cm3. These values are of the same order of magnitude as those reported in other studies (Bernstein Citation2004; Alderman and Ingebrethsen Citation2011); however, the concentrations measured by SCS-DMS were 2- to 2.5-fold higher than those measured by SM-ELPI in this study. In the DMS system, smoke particles are measured on the basis of electric mobility diameter; by contrast, the ELPI system distinguishes particles by their aerodynamic diameter. Whether the instrument measures mobility or aerodynamic diameters, the number of particles should be the same. However, there could be myriad of discrepancies between the two methods, for example, measurement size ranges and stages, conversion software, and system losses. The specific discrepancies were not investigated in this work.
4.2. Trend in particle distribution of MCS
A log-normal distribution of MCS particle size distribution was measured by both SCS-DMS and SM-ELPI. However, the GSD of SM-ELPI was 59% larger than that of SCS-DMS, indicating that SM-ELPI recorded a wider particle size distribution. There was no clear difference in the particle size distribution of MCS from the three test cigarettes, indicating that tar or TPM does not affect MCS particle size. The CMDm of MCS from the 3R4F reference cigarette ranged from 174 to 195 nm for SCS-DMS, and from 150 to 170 nm for SM-ELPI. These values are similar to the range of 152–198 nm reported in other studies (Alderman and Ingebrethsen Citation2011; Sahu et al. Citation2013). For the 3R4F, Hongtashan, and Dunhill products, the CMDm of MCS particles measured by SCS-DMS decreased from the first puff to the last puff by 11, 15, and 16%, respectively. The primary reason for the decrease in CMDm is the evaporation of water during measurements (Alderman and Ingebrethsen Citation2011). However, this decreasing trend in particle diameter with puff number was not observed by SM-ELPI.
According to Bernstein (Citation2004) and Alderman and Ingebrethsen (Citation2011), variations in methodological principles, dilution ratios and aging times can lead to a lack of agreement among aerosol measurements. In addition, the measurement size ranges and stages, and conversion software can affect the measured particle size distribution and CMDm. DMS enables measurements of particles over 38 channels in the range of 5–1000 nm, whereas ELPI measures particles ranging from 7 nm to 10 μm over 12 channels. This might partly explain the smaller GSD and more accurate measurement of CMDm by SCS-DMS.
4.3. Trend in chemical distribution in MCS particles
Early work on the distribution of chemicals in smoke particles indicated that the distribution of nicotine is independent of particle size, that of dotriacontane is particle size-dependent, while that of hexadecane shows some dependency on particle size (Jones et al. Citation1975). Another study showed slight chemical differences as a function of particle size, with pyrolytic products appearing “enriched” in particles smaller than 0.5 μm. In this study, different distributions of nicotine, solanesol, and TSNAs in MCS particles were observed. The distribution of nicotine was found to be independent of particle size, consistent with previous results (Jones et al. Citation1975). Similarly, the distribution of TSNAs in smoke particles was independent of particle size. Therefore, nicotine and TSNAs are thought to be uniformly distributed throughout the particulate matter. By contrast, the data indicated that the amount of solanesol approximately increases with MCS particle size, implying that solanesol is more likely to be present in larger particles. Solanesol has a molecular weight of 630 Da and a boiling point of 685.6 °C. The high boiling point of solanesol may be the reason for the observed distribution of solanesol.
These results may have implications for the dose of smoke toxicants to the lung. Studies are beginning to calculate and model the deposition of smoke particles in the respiratory systems (Robinson and Yu Citation2001; Asgharian et al. Citation2014; Pichelstorfer et al. Citation2016). Our current findings suggest that, for some smoke constituents, the relationship between concentration and particle size needs to be established for accurate predictions of lung tissue dose.
5. Conclusions
In this study, we have demonstrated a successful comparison of two online techniques for characterizing MCS particles, SCS-DMS and SM-ELPI, and have examined the distribution of nicotine, solanesol, and TSNAs in smoke particles of different sizes. For smoke particles measurements, the number concentration of MCS particles measured by SCS-DMS was 2.5-fold higher than that measured by SM-ELPI, which might result from the myriad of discrepancies between the two systems.
The distribution of nicotine, solanesol, and four TSNAs in smoke particles of different sizes (Da, 144, 431, and, 722 nm) showed that the smoke constituents have different dependencies on particle size. Future work should focus on the distribution of other carcinogens in MCS particles of various sizes. Our results, combined with a model for predicting the respiratory deposition of MCS particles of different size, will help to unravel the real dose of carcinogens received by human organs and provide accurate data for studies on smoking and health.
Correction Statement
This article has been republished with minor changes. These changes do not impact the academic content of the article.
Acknowledgments
The authors would like to thank John McAughey, Chuan Liu, Krishna Prasad and Jason Adamson for their suggestions and internal review at British American Tobacco. H.C., C.U.Y. and R.C. conceived the study. H.C. and C.U.Y. performed the experimental work at British American Tobacco, analyzed all data, and drafted the manuscript. H.C. and F.X. conducted the experimental work at ZTRI. H.L. reviewed the collected data, the data analyses, and the draft manuscript. All authors read and approved the final manuscript.
Additional information
Funding
References
- Adam, T., J. McAughey, C. McGrath, C. Mocker, and R. Zimmermann. 2009. Simultaneous online size and chemical analysis of gas phase and particulate phase of cigarette mainstream smoke. Analytical and Bioanalytical Chemistry 394 (4):1193–203. doi:10.1007/s00216-009-2784-y
- Alderman, S. L., and B. J. Ingebrethsen. 2011. Characterization of mainstream cigarette smoke particle size distributions from commercial cigarettes using a DMS500 fast particulate spectrometer and smoking cycle simulator. Aerosol Science and Technology 45 (12):1409–21. doi:10.1080/02786826.2011.596862
- Asgharian, B., O. T. Price, C. U. Yurteri, C. Dickens, and J. McAughey. 2014. Component-specific, cigarette particle deposition modeling in the human respiratory tract. Inhalation Toxicology 26 (1):36–47. doi:10.3109/08958378.2013.851305
- Baker, R. R. 2006. Smoke generation inside a burning cigarette: Modifying combustion to develop cigarettes that may be less hazardous to health. Progress in Energy and Combustion Science 32 (4):373–85. doi:10.1016/j.pecs.2006.01.001
- Baker, R. R., and M. Dixon. 2006. The retention of tobacco smoke constituents in the human respiratory tract. Inhalation Toxicology 18 (4):255–94. doi:10.1080/08958370500444163
- Becquemin, M. H., J. F. Bertholon, M. Auuoui, F. Roy, and B. Dautzenberg. 2009. Particle size in the smoke produced by six different types of cigarette tobacco. Revue des Maladies Respiratoires 26:12–8. doi:RMR-09-2007-24-7-0761-8425-101019-200720090
- Bernstein, D. M. 2004. A review of the influence of particle size, puff volume, and inhalation pattern on the deposition of cigarette smoke particles in the respiratory tract. Inhalation Toxicology 16 (10):675–89. doi:10.1080/08958370490476587
- Chang, P., L. K. Peters, and Y. Ueno. 1985. Particle size distribution of mainstream cigarette smoke undergoing dilution. Aerosol Science and Technology 4 (2):191–207. doi:10.1080/02786828508959048
- Davies, C. N. 1988. Cigarette smoke: Generation and properties of the aerosol. Aerosol Science and Technology 19 (4):463–9. doi:10.1016/0021-8502(88)90021-3
- Hinds, W. C. 1978. Size characteristics of cigarette smoke. American Industrial Hygiene Association Journal 39 (1):48–54. doi:10.1080/0002889778507712
- Hinds, W. C. 1999. Aerosol technology: Properties, behavior and measurements of airborne particles, 2nd ed. New York, NY: John Wiley & Sons.
- Holmberg, R. W., and L. B. Yeatts. 1976. Particle size characteristics of tobacco smoke. Analytical Chemistry Division of Annual Reports ORNL-5244. 72–4. Springfield, VA: National Technical Information.
- Ingebrethsen, B. J. 1986. Aerosol studies of cigarette smoke. Recent Advances in Tobacco Science 12:54–142.
- ISO. 2012. ISO 3308: Routine analytical cigarette-smoking machine - definitions and standard conditions. Geneva: International Organization for Standardization.
- Jenkins, R. A., R. W. Francis, H. Flachsbart, and W. Stober. 1979. Chemical variability of mainstream smoke as a function of aerodynamic particle size. Journal of Aerosol Science 10 (4):355–62. doi:10.1016/0021-8502(79)90029-6
- Johnson, T. J., J. S. Olfert, R. Cabot, C. Treacy, C. U. Yurteri, C. Dickens, J. McAughey, and J. P. R. Symonds. 2015. Transient measurement of the effective particle density of cigarette smoke. Journal of Aerosol Science 87:63–74. doi:10.1016/j.jaerosci.2015.05.006
- Jones, R. T., G. D. Lugton, S. R. Massey, and R. B. Richardson. 1975. The distribution with respect to smoke particle size of dotriacontane, Hexadecane and decachlorobiphenyl added to cigarettes. Beiträge zur Tabakforschung International 8 (2):89–92. doi:10.2478/cttr-2013-0361
- Kane, D. B., B. Asgharian, O. T. Price, A. Rostami, and M. J. Oldham. 2010. Effect of smoking parameters on the particle size distribution and predicted airway deposition of mainstream cigarette smoke. Inhalation Toxicology 22 (3):199–209. doi:10.3109/08958370903161224
- Keskinen, J., K. Pietarinen, and M. Lehtimäki. 1992. Electrical low pressure impactor. Journal of Aerosol Science 23 (4):353–60. doi:10.1016/0021-8502(92)90004-F
- Khlystov, A., C. Stanier, and S. N. Pandis. 2004. An algorithm for combining electrical mobility and aerodynamic size distributions data when measuring ambient aerosol. Journal of Aerosol Science 38 (1):229–38. doi:10.1080/02786820390229543
- Kijowski. 1985. UCSF, Truth Tobacco Industry Documents, Document ID:spbk0037. https://www.industrydocumentslibrary.ucsf.edu/tobacco/docs/#id=spbk0037
- Leaderer, B. P., W. S. Cain, R. Isseroff, and L. G. Berglund. 1984. Ventilation requirements in buildings II. Particulate matter and carbon monoxide from cigarette smoking. Atmospheric Environment 18 (1):99–106. doi:10.1016/0004-6981(84)90232-4
- Martonen, T. B. 1992. Deposition patterns of cigarette smoke in human airways. American Industrial Hygiene Association Journal 53 (1):6–18. doi:10.1080/15298669291359249.
- McCusker, K., F. C. Hiller, J. D. Wilson, P. C. McLeod, R. Sims, and R. C. Bone. 1982. Dilution of cigarette smoke for aerodynamic sizing with a SPART analyser. Journal of Aerosol Science 13 (2):103–10. doi:10.1016/0021-8502(82)90055-6
- Morie, G. P., and M. S. Baggett. 1977. Observations on the distribution of certain tobacco smoke components with respect to particle size. Beiträge zur Tabakforschung 9 (2):72–8. doi:10.2478/cttr-2013-0430
- Pichelstorfer, L., W. Hofmann, R. Winkler-Heil, C. U. Yurteri, and J. McAughey. 2016. Simulation of aerosol dynamics and deposition of combustible and electronic cigarette aerosols in the human respiratory tract. Journal of Aerosol Science 99:125–13. doi:10.1016/j.jaerosci.2016.01.017
- Robinson, R. J., and C. P. Yu. 2001. Deposition of cigarette smoke particles in the human respiratory tract. Aerosol Science and Technology 34 (2):202–15. doi:10.1080/027868201300034844
- Rodgman, A., and T. A. Perfetti. 2013. The chemical components of tobacco and tobacco smoke, 2nd ed. Boca Raton, FL: CRC Press.
- Sahu, S. K., M. Tiwari, R. C. Bhangare, and G. G. Pandit. 2013. Particle size distribution of mainstream and exhaled cigarette smoke and predictive deposition in human respiratory tract. Aerosol and Air Quality Research 13 (1):324–32. doi:10.4209/aaqr.2012.02.0041
- Schmeltz, I. 1972. The chemistry of tobacco and tobacco smoke. New York, NY: Plenum Press.
- Stedman, R. L. 1968. The chemical composition of tobacco and tobacco smoke. Chemical Reviews 68 (2):153–207. doi:10.1021/cr60252a002
- Symonds, P. R. J., K. S. Reavell, J. S. Olfert, B. W. Campbell, and S. J. Swift. 2007. Diesel soot mass calculation in real-time with a differential mobility spectrometer. Journal of Aerosol Science 38 (1):52–68. doi:10.1016/j.jaerosci.2006.10.001
- US Department of Health and Human Services. 2014. The health consequences of smoking- 50 years of progress: A report of the Surgeon General. Washington, DC: US Department of Health and Human Services. http://www.surgeongeneral.gov/library/reports/50-years-of-progress/index.html
- Wynder, E. L., and D. Hoffmann. 1967. Tobacco and tobacco smoke. London: Academic Press.
- Xiang, L., K. Haohui, Z. Xinying, P. Bin, N. Cong, S. Guanglin, and L. Huimin. 2014. Characterization of particle size distribution of mainstream cigarette smoke generated by smoking machine with an electrical low pressure impactor. Journal of Environmental Sciences 26:827–33. doi:10.1016/S1001-0742(13)60472-6