
Abstract
Background
Despite extensive exploration of asthma, the mechanism of asthma has not been fully elucidated. Cough variant asthma (CVA) is considered as precursor to classical asthma (CA). Comparative study between CA and CVA may be helpful in further understanding the pathogenesis of asthma.
Methods
Peripheral blood mononuclear cells (PBMCs) were isolated from CVA, CA and healthy adults. Each group consisted of five cases. Total RNA was extracted from the PBMCs. Agilent 4 × 44 K human genome oligo microarray was used to detect whole genome expression. Allogeneic clustering, Gene Ontology and KEGG analysis were performed to investigate differentially expressed genes (DEGs). Then, ten candidate genes were screened and verified by real-time PCR.
Results
Gene expressions were significantly different among the three groups, with 202 DEGs between the CA and the CVA groups. The Gene Ontology analysis suggested that the DEGs were significantly enriched in ‘histone H4-K20 demethylation’ and ‘antigen processing and presentation of endogenous antigens’. HDC, EGR1, DEFA4, LTF, G0S2, IL4, TFF3, CTSG, FCER1A and CAMP were selected as candidate genes. However, the results of real-time PCR showed that the expression levels of FCER1A, IL4 and HDC in the cough variant asthma group were significantly different from those in the other two groups (p < 0.05).
Conclusions
The pathogenesis of CVA and CA may be related to genes such as FCER1A, HDC and IL4. Further studies incorporating a larger sample size should be conducted to find more candidate genes and mechanisms.
Introduction
Asthma is a lifelong respiratory disease, usually characterized by chronic airway inflammation, hypersensitivity of the respiratory tract and reversible obstruction of airflow. Persistent inflammation in the airways leads to permanent airway remodeling. This disease is a major concern worldwide that creates a heavy burden on human health and society and reduces quality of life. According to a previous report, in 2016, 360 million people globally suffered from asthma, and approximately 420,000 people died from the disease (Citation1). Both genetic factors (genetic polymorphisms and family history) and environmental factors (tobacco smoke, air pollution, allergens) contribute to the development of asthma (Citation2). However, the exact pathogenesis of this disease has not been fully elucidated. In asthma genetics, a trend toward a few main topics developed over the last 2 years. Among them, some studies focused on overlapping and/or very specific phenotypes: within the allergy spectrum but also reaching beyond, looking for common genetic traits shared between different diseases or disease entities (Citation3).
As a special type of asthma, cough variant asthma (CVA) is characterized by chronic cough as the main or only symptom and is also considered to be a peripheral airway inflammatory disease similar to asthma (Citation4). CVA and asthma have many similarities. For example, these conditions have similar pathobiological bases, including eosinophilic inflammation, airway hyperresponsiveness and airway remodeling (Citation5). However, the degree of airway inflammation, airway hyperresponsiveness and airway remodeling in CVA are minor. Some scholars regard CVA as the precursor to asthma, and 30%–40% of CVA cases will develop into typical asthma without proper treatment (Citation6). Fortunately, early appropriate treatment in CVA is curative. Research has demonstrated that inhaled corticosteroids or a combination of inhaled corticosteroids and long-acting beta-agonists (ICS/LABA) can alleviate the degree of inflammation and remodeling in asthmatics (Citation7). Curing CVA and blocking CVA development to classical asthma are the first line of defense in the treatment of asthma. Unfortunately, the transformational mechanism of CVA to typical asthma has not been explored.
Asthma is caused by a complex interaction between genes and the environment, and gene expression is regulated by epigenetic modifications through gene and environment interactions. Are there differences in gene expression between CVA and classical asthma? Comparative studies between classical asthma and CVA may be helpful for further understanding the pathogenesis of asthma. Whole-genome microarray analysis is an important technique in the field of genetic research, and it possesses many advantages of which the greatest is the ability to improve traditional experiments by allowing the observation of differences in one or multiple genes in a single test (Citation8). Here, we first performed a pilot study on gene expression differences among CVA patients, asthmatic patients and healthy adults by the whole-genome microarray technique. Then, we screened candidate genes by enrichment analysis and validated them by real-time PCR.
Materials and methods
Study subjects
Healthy adults from the physical examination center of the Sichuan Provincial People’s Hospital were randomly selected as the healthy control group (g1, HC). Patients who were diagnosed with classical asthma (g2, CA) or CVA (g3, CVA) in the Outpatient Department of Respiratory Medicine of the Sichuan Provincial People’s Hospital and West China Hospital of Sichuan University from March 1, 2016, to December 31, 2016, were screened for eligibility for this study. The diagnostic criteria of CA were from GINA 2015 (Citation9), CVA was diagnosed using the following criteria: chronic cough often accompanied by significant irritant cough at night, positive bronchial stimulation test or PEF mean variation rate > 10% or positive bronchial dilation test, effective to anti-asthma treatment (Citation10). The inclusion criteria were as follows: 20–65 years of age, female, no family history of asthma, no smoking history, no oral or intravenous antiallergic medications and corticosteroids within 4 weeks, and no history of acute respiratory infection within 4 weeks. The exclusion criteria were as follows: severe asthma, other respiratory diseases (i.e. chronic obstructive pulmonary disease, bronchiectasis, pulmonary fibrosis, pneumonia, tuberculosis), serious cardiovascular diseases (cardiac function at or above grade II according to the NYHA standard), hepatorenal insufficiency, pregnancy and lactation, and malignant tumor. Each group consisted of five subjects. The study was approved by the Medical Ethics Committee of the Sichuan Provincial People’s Hospital (approval number: 2016 No. 103), and all participants provided written informed consent in advance.
Methods
Peripheral blood mononuclear cell isolation and RNA extraction
Peripheral blood mononuclear cells (PBMCs) were isolated from peripheral blood by density gradient centrifugation using Lymphoprep (Axis Shield, Norway) following the manufacturer’s instructions. Total RNA was extracted using trizol reagent following the manufacturer’s instructions, purified and preserved at –80 °C for further detection.
Genome-wide gene expression by GeneChip microarray and data analysis
The genome-wide gene expression analysis was completed with the assistance of Shanghai Biotechnology Corporation (Shanghai, China). An Agilent 4 × 44 K human genome oligo microarray was used for gene expression profiling of the RNA samples previously described. Finally, the differentially expressed genes (DEGs) were analyzed by cluster analysis and enrichment analysis (Gene Ontology (GO) analysis and Kyoto Encyclopedia of Genes and Genomes (KEGG) analysis). A total of 10 candidate genes were selected.
Candidate gene verification by real-time PCR
Real-time PCR was applied to fourteen samples as one sample in the CVA group did not have sufficient RNA. GAPDH was used as the internal reference gene. The twenty different primers used together with that for GAPDH are listed in . Real-time PCR was performed as follows: RNA samples were thawed at 4 °C, and cDNA first chain reaction solution was prepared using a 20 μL total volume containing 4 μL of 5× RT Buffer, 1 μL of enzyme mix, 1 μL of primer mix, 14 μL of RNA template (0.5 μg) and H2O in the PCR tube. SYBR Green qPCR was run in 384-well optical reaction plates, and the reactions were conducted using a 10 μL total volume containing 5 μL of 2× SYBR Green PCR buffer (ABI, USA), 0.5 μL of forward primer (10 μM), 0.5 μL of reverse primer (10 μM), 5 ng of template, and X (up to 10) μL of ddH2O. The reaction conditions were as follows: 95 °C for 10 min, followed by 40 cycles of 95 °C for 15 s and 60 °C for 1 min. Analysis was performed using a 7900 HT Sequence Detection System (ABI, USA).
Table 1. List of primers used in real-time PCR for the detection of the 10 candidate genes.
Quality control
NanoDrop ND-2000 spectrophotometer (Thermo Scientific, US) and Agilent Bioanalyzer 2100 (Agilent Technologies, USA) were used for RNA quality control. The RNA Integrity Number (RIN) software algorithm based on a numbering system from 1 to 10, with 1 being the most degraded profile and 10 being the most intact. Our study required RIN ≥ 6.0 and 28 s/18s ≥ 0.7; coefficient of variation (CV) was used to judge whether the system was stable or not by comparing and analyzing the data between groups in GeneChip microarray. In the experiment, the CV value of 10 times repeated probe point signal was used to evaluate the stability of chip and technology; melting-curve analysis was used as the quality control standard of real-time PCR, and all samples were repeated for three times. All the melting-curve in our study were single-peak and had strong repeatability.
Statistical analysis
Normally distributed data are expressed as the mean ± standard deviation (χ ± SD), Nonnormally distributed data are expressed as the median (Interquartile range, IQR). The expression level of each mRNA is expressed as a log2 transformed value and was normalized to a mean of zero. ANOVA was used for comparisons between groups. DEGs were analyzed by cluster analysis. A p values of less than 0.05 was considered statistically significant. Statistical analysis was performed with SPSS (Professional Version 22).
Results
Characteristics of individuals in each group
The characteristics of the individuals in each group are summarized in . Age, body mass index (BMI), FEV1/FVC (FEV1:Forced expiratory volume in one second; FVC: forced vital capacity) and FEV1%/Pred were not significantly different among the HC, CA and CVA groups. Fraction of exhaled nitric oxide (FeNO) between CA and CVA groups was not significantly different (20(16.5), 24(26.5), p > 0.05); all individuals from the CA and CVA groups had a history of allergic rhinitis. The course of disease between the CA and CVA groups was significantly different (8 ± 11.38 years vs. 1.8 ± 1.6 years, P < 0.01). All individuals had normal white blood cell counts; one patient with asthma had an elevated percentage of eosinophils in blood (≥5%); one patient with classical asthma had an elevated IgE level (≥100 IU/mL); four and three individuals from the CA and CVA groups, respectively, were using inhaled corticosteroids; and no individual was using oral corticosteroids.
Table 2. Characteristics of individuals in each group.
Gene expression and cluster analysis
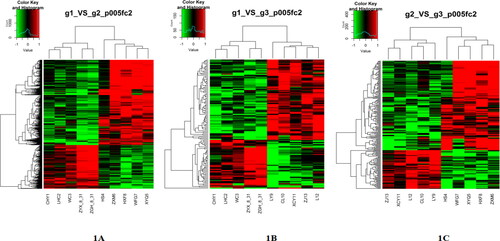
The DEGs showed a two-fold increase or decrease in cluster analysis. The cluster analysis divided the fifteen samples into three categories, which were completely consistent with the experimental grouping (. From the gene expression level, we found 779 DEGs between the HC group and the CA group; 264 genes were upregulated, and 515 genes were downregulated. There were 119 DEGs between the HC group and the CVA group; 44 genes were upregulated, and 75 genes were downregulated. When the CVA group was compared with the CA group, there were 202 DEGs, of which 141 genes were upregulated and 61 genes were downregulated.
Figure 1. Heatmap of the groups. Gene expression heatmap of the groups. (A) Heatmap between the HC group and the CA group. (B) Heatmap between the HC group and the CVA group. (C) Heatmap between the CA group and the CVA group. Green indicates low expression, and red indicates high expression. Samples in group g1 (HC, healthy control): CHY1, LHC2, WC3, ZYX-8–31, ZGH-8–31. g2 (CA, classical asthma): HS4, ZXM6, HXF8, WFG7, XYQ5. g3 (CVA, cough variant asthma): LY9, CL10, XCY11, ZJ13, L12.
Enrichment analysis and candidate gene selection
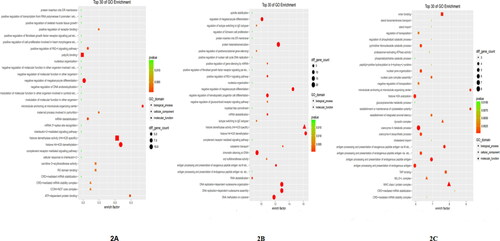
The enrichment analysis included FF pathway analysis. GO analysis suggested that the DEGs between the HC and CA groups were significantly enriched in biological processes including ‘histone H4-K20 demethylation’, cellular components such as ‘CCR4-NOT core complex’, and molecular functions including ‘histone demethylase activity (H4-K20 specific)’. Between the HC and CVA groups, the DEGs were significantly enriched in biological processes including ‘histone H4-K20 demethylation’ and ‘DNA methylation on cytosine’ and molecular functions including ‘histone demethylase activity (H4-K20 specific)’. Between the CA and CVA groups, the DEGs were significantly enriched in biological processes including ‘antigen processing and presentation of endogenous antigens’, cellular components such as ‘MHC class I protein complex’, and molecular functions including ‘TAP binding’ (see additional information in .
Figure 2. Top 30 GO enrichment terms between groups. (A) Top 30 GO enrichment terms between the HC group and the CA group, (B) Top 30 GO enrichment terms between the HC group and the CVA group, (C) Top 30 GO enrichment terms between the CA group and the CVA group. HC: healthy control group; CA: classical asthma group; CVA: cough variant asthma group.
KEGG pathway enrichment analysis showed that the DEGs between the HC and CA groups were significantly enriched in biological pathways including ‘ECM-receptor interaction’ and ‘systemic lupus erythematosus’ (). Between the HC and CVA groups, the DEGs were significantly enriched in biological pathways such as ‘asthma’, ‘systemic lupus erythematosus’, and ‘Fc epsilon RI signaling pathway’ (). Between the CA and CVA groups, the DEGs were significantly enriched in biological pathways such as ‘pantothenate and CoA biosynthesis’, ‘asthma’ and ‘Fc epsilon RI signaling pathway’ (). Between the CA group and the CVA group, we identified the KEGG pathway of hsa05310, which is described as ‘asthma’, as shown in .
Figure 3. Changes of KEGG pathway of ‘asthma’ between the CA and the CVA group. Green represents downregulated genes. Light green represents the genes are present in this species. CA: classical asthma group; CVA: cough variant asthma group.
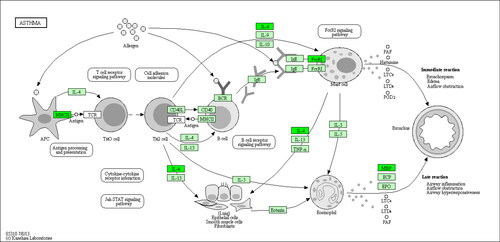
Table 3. Top 15 enriched pathways between the HC and CA groups.
Table 4. Top 15 enriched pathways between the HC and CVA groups.
Table 5. Top 15 enriched pathways between the CA and CVA groups.
Combining the DEGs with GO and KEGG analysis, we screened ten DEGs (HDC, EGR1, DEFA4, LTF, G0S2, IL4, TFF3, CTSG, FCER1A and CAMP) as candidate genes and completed the verification test by real-time PCR.
Real-time PCR for candidate gene verification
The real-time PCR results showed that the gene expression levels of FCER1A, HDC and IL4 in the CVA group were upregulated compared with those in the CA group (p < 0.05). The expression levels of these three genes were also upregulated in the CVA group compared with those in the HC group (p < 0.05). Among the three groups, the relative expression levels of the other seven genes, EGR1, DEFA4, LTF, G0S2, TFF3, CAMP and CTSG, were not significantly different (p > 0.05). The details are shown in .
Table 6. Comparison of the relative expression of candidate genes in groups.
Discussion
As an atypical type of asthma, CVA is the most common cause of chronic cough in China and has a similar pathogenesis to asthma. Some scholars regard CVA as the precursor to asthma. Genetic factors together with environmental exposures promote the development of asthma; many studies on genetic mechanisms have been completed and have revealed more than 400 genes related to asthma (Citation11). Over the past 3 years, well powered genetic studies of asthma have increased the number of independent asthma-associated genetic loci to 128 (Citation12). Despite the substantial efforts made to study asthma, only a few susceptibility genes, such as IL1, IL33, thymic stromal lymphopoietin (TSLP), HLA, IL-1 receptor-like 1 (IL1RL1), the 17q12-21 locus encoding ORM1-like 3 (ORMDL3), and ADAM33, have been identified by genome-wide association studies (GWAS) (Citation11). The contribution of genetic factors to the risk of asthma has been confirmed in previous studies, where heritability estimates ranged from 35% to 80% (Citation13). The wide range of heritability estimates explained the role of environmental exposures in the risk of asthma. Thus, it can be concluded that asthma is a complex multifactorial disease. Study also found that different respiratory symptom with asthma associated variants gene locus (Citation14), and in view of the relationship between CVA and asthma, our study used CVA to provide novel insights that may help open new avenues for future research on asthma.
On the basis of gene expression and cluster analysis, we found that gene expression profiles among the HC, CA and CVA groups were significantly different. All the profiles were consistent with their groups, indicating that our groupings and sample collections were correct.
After candidate gene screening and validation, we found that the expression of three genes, IL4, FCER1A and HDC, was upregulated in the CVA group compared with the HC and CA groups. This finding indicated that some genes, such as IL4, FCER1A and HDC, may be related to the process of transformation from CVA to asthma. These three genes were closely related to asthma. The IL4 gene is located at 5q31.1, which is in a susceptibility region for asthma. Interleukin-4, the genetic product of IL4, causes naive CD4+ T cells to highly express STAT6 and GATA3 and differentiate into Th2 cells, which play a critical role in the pathogenesis of asthma (Citation15). FCER1A encodes the alpha subunit of IgE receptors, which also plays a central role in asthma. Candidate gene studies and GWAS showed that single nucleotide polymorphisms (SNPs) in FCER1A were major genetic determinants of IgE levels (Citation16–19). HDC encodes l-histidine decarboxylase, which can catalyze histidine to histamine. Histamine is a major component participating in the pathophysiology of asthma. Ohtsu et al. (Citation20) found that tissues from HDC-deficient mice lacked histamine-synthesizing activity and that the numbers of mast cells were decreased. Many researchers agree that HDC is closely related to asthma (Citation21). To the best of our knowledge, we first found that IL4, FCER1A and HDC were highly related to CVA. However, these genes were not highly expressed in the CA group in our study, which was not consistent with previous studies. The endotypes of asthma can be divided into the ‘Th2-high’ and ‘Th2-low’ subtypes; they are relatively stable subgroups and can be defined by underlying distinct genetic or molecular characteristics (Citation22). The Th2-high subtype occurs in many but not all patients (Citation23).In the early stage of asthma, its gene expression may be up-regulated. Furthermore, a small sample size may result in errors. Therefore, we speculated that the differences between subtypes (CVA and CA) and the sample size could explain the results.
In terms of signaling pathway analysis, we found that the signaling pathway of ‘asthma’ (hsa05310, ) had a high enrichment factor in the CVA group compared with the HC or CA group. This pathway contains seven signaling pathways related to the pathogenesis of asthma, and in our study, we found that two of these pathways, the ‘Jak-STAT signaling pathway’ (between the HC and CVA groups) and the ‘Fc epsilon RI signaling pathway’ (between the HC and CVA groups and the CA and CVA groups) had high enrichment factors. The Jak-STAT signaling pathway is a paradigm of receptor-mediated signal transduction and a shining example of the clinical translation of basic immunology (Citation24). Asthma is associated with Th2 cell orientations, and the expression of IgE is an important part of the pathogenesis of asthma. The Jak-STAT signaling pathway was hypothesized to play a critical role in the development of asthma by regulating the level of IgE and the balance between Th1 and Th2 cells (Citation25). Mast cells are another important member that participates in the pathogenesis of asthma. During allergic reactions, mast cell activation is mediated through FcɛRI, which is defined as a receptor binding to monomeric IgE on the mast cell surface. Following its crosslinking, the IgE-bound FcTimes New Roman (OTF)RI with the cognate antigen results in the release of arachidonic acid metabolites, vasoactive amines (early phase) and cytokines and chemokines (late phase) (Citation26). Multiple signaling pathways contribute to the development of FcTimes New Roman (OTF)RI-mediated mast cell responses, among which the Fc epsilon RI signaling pathway is the most important. Based on the above findings, we can conclude that CVA has a similar pathogenesis to asthma. The mechanistic differences between CVA and classical asthma may be explained by the fact that CVA has a higher Th2 cell level, IgE level and mast cell activation to some degree. This hypothesis may also be consistent with the theory that CVA is the precursor to classical asthma. Unfortunately, we did not detect subsets of T cells, and the IgE levels in the two groups did not support these conclusions, but we could not eliminate this possibility. Another explanation is that different phenotypes of asthma may have different gene expression levels (Citation27). We verified that CVA is one of the phenotypes of asthma and has specific gene transcript differences from classical asthma.
The DEGs related to the signaling pathway described above included IL4, MS4A2, FCER1A, IL5RA and CLC. All of them were upregulated in the CVA group, but we only identified IL4 and FCER1A. In the future, we will continue to identify the other genes. The DEGs EGR1, G0S2, DEFA4, LTF, TFF3, CTSG and CAMP were not validated by real-time PCR, but we could not confirm that the difference among the seven genes was not statistically significant between the groups.
There are some limitations in our study. First, we did not perform the induced sputum test, and the subtypes of asthma were unknown; the gene expression profiles of different phenotypes of asthma might be different. Second, our study only had five cases in each group, and all the individuals were female. The reason why we chose females is that all the individuals in the CVA group were female by chance. To allow comparisons between the groups and avoid significant differences, we chose females in all the other groups, which was also consistent with the epidemiological history of asthma. The incidence rate of asthma is higher in females than in males. Admittedly, our study was only a pilot study and had a very small sample size. Thus, the results and conclusions may be limited.
In summary, in this pilot study, we found that gene expression in PBMCs among patients with CVA, patients with classical asthma and healthy adults was significantly different. Some DEGs functionally related to asthma, antigen presentations and expression were identified between the CVA and classical asthma groups or between the CVA group and healthy adults. Here, we first consider that the pathogenesis of CVA and classical asthma may be related to certain genes, such as FCER1A, HDC and IL4, and related to some mechanistic processes, such as Th2 cell orientations, IgE levels and mast cell activation. Once again, we showed that CVA is a phenotype of asthma and a precursor to asthma. Further studies may be designed to increase the sample size and find more candidate genes and mechanisms.
Conclusions
In this pilot study, we first found that gene expression in PBMCs among patients with CVA, patients with and healthy adults was significantly different. Some DEGs between the CVA and classical asthma groups were functionally related to asthma, antigen presentations and expression. Here, we first consider that the pathogenesis of CVA and classical asthma may be related to genes such as FCER1A, HDC and IL4. Further studies may be performed to increase the sample size and find more candidate genes and mechanisms.
Acknowledgements
The authors thank the ATS MECOR (Methods in Epidemiologic, Clinical and Operations Research) China Committee in 2018 for guiding the drafting of the manuscript and Dr. Song LUO (MPH, Johns Hopkins Bloomberg School of Public Health) for reviewing the manuscript.
Disclosure statement
The authors declare that they have no competing interests.
Additional information
Funding
References
- Vos T, Abajobir AA, Abate KH, Abbafati C, Abbas KM, Abd-Allah F, Abdulkader RS, Abdulle AM, Abebo TA, Abera SF, et al. Global, regional, and national incidence, prevalence, and years lived with disability for 328 diseases and injuries for 195 countries, 1990–2016: a systematic analysis for the Global Burden of Disease Study 2016. Lancet 2017;390(10100):1211–1259. doi:https://doi.org/10.1016/S0140-6736(17)32154-2.
- Martinez FD. Genes, environments, development and asthma: a reappraisal. Eur Respir J 2007;29(1):179–184. doi:https://doi.org/10.1183/09031936.00087906.
- Kabesch M, Tost J. Recent findings in the genetics and epigenetics of asthma and allergy. Semin Immunopathol 2020;42(1):43–60. doi:https://doi.org/10.1007/s00281-019-00777-w.
- Niimi A, Amitani R, Suzuki K, Tanaka E, Murayama T, Kuze F. Eosinophilic inflammation in cough variant asthma. Eur Respir J 1998;11(5):1064–1069. doi:https://doi.org/10.1183/09031936.98.11051064.
- Niimi A, Chung KF. Airway inflammation and remodelling changes in patients with chronic cough: do they tell us about the cause of cough?Pulm Pharmacol Ther 2004;17(6):441–446. doi:https://doi.org/10.1016/j.pupt.2004.09.004.
- Saito N, Itoga M, Tamaki M, Yamamoto A, Kayaba H. Cough variant asthma patients are more depressed and anxious than classic asthma patients. J Psychosom Res 2015;79(1):18–26. doi:https://doi.org/10.1016/j.jpsychores.2015.03.011.
- Shigeru K, Tadashi I, Yoshyuki U, Hisao K, Hidetada S, Takanobu S, Kenichi T, Akio N, Koichi N, Masaki F, et al. The Japanese Respiratory Society guidelines for management of cough. Respirology 2006;11(Suppl 4):S135–S186.
- Yu CD, Xu SH, Mou HZ, Jiang ZM, Zhu CH, Liu XL. Gene expression profile differences in gastric cancer, pericancerous epithelium and normal gastric mucosa by gene chip. WJG 2005;11(16):2390–2397. doi:https://doi.org/10.3748/wjg.v11.i16.2390.
- The Global Strategy for Asthma Management and Prevention. Global Initiative for Asthma (GINA), 2015. Available from URL: http://www.ginasthma.org/.
- Chinese Medical Association of respiratory disease branch Asthma Study Group. Cough diagnosis and treatment guidelines (2015). Clin J Tuberc Respir Dis 2016;39(5):323–354. (in Chinese).
- MacArthur J, Bowler E, Cerezo M, Gil L, Hall P, Hastings E, Junkins H, McMahon A, Milano A, Morales J, et al. The new NHGRI-EBI Catalog of published genome-wide association studies (GWAS Catalog). Nucleic Acids Res 2017;45(D1):D896–D901. doi:https://doi.org/10.1093/nar/gkw1133.
- El-Husseini ZW, Gosens R, Dekker F, Koppelman GH. The genetics of asthma and the promise of genomics-guided drug target discovery. Lancet Respir Med 2020; 8(10):1045–1056. doi:https://doi.org/10.1016/S2213-2600(20)30363-5.
- Torgerson DG, Ampleford EJ, Chiu GY, Gauderman WJ, Gignoux CR, Graves PE, Himes BE, Levin AM, Mathias RA, Hancock DB, et al., Genetic Research on Asthma in African Diaspora (GRAAD) Study. Meta-analysis of genome-wide association studies of asthma in ethnically diverse North American populations. Nat Genet 2011;43(9):887–892. doi:https://doi.org/10.1038/ng.888.
- Lee S, Lasky-Su JA, Lange C, Kim W, Kumar PL, McDonald M-LN, Vaz Fragoso CA, Laurie C, Raby BA, Celedón JC, et al. A novel locus for exertional dyspnea in childhood asthma. Eur Respir J 2021; 57(2):2001224. doi:https://doi.org/10.1183/13993003.01224-2020.
- Ouyang W, Löhning M, Gao Z, Assenmacher M, Ranganath S, Radbruch A, Murphy KM. Stat6-independent GATA-3 autoactivation directs IL-4-independent Th2 development and commitment. Immunity 2000;12(1):27–37. doi:https://doi.org/10.1016/S1074-7613(00)80156-9.
- Potaczek DP, Kabesch M. Current concepts of IgE regulation and impact of genetic determinants. Clin Exp Allergy 2012;42(6):852–871. doi:https://doi.org/10.1111/j.1365-2222.2011.03953.x.
- Potaczek DP, Sanak M, Mastalerz L, Setkowicz M, Kaczor M, Nizankowska E, Szczeklik A. The alpha-chain of high-affinity receptor for IgE (FcepsilonRIalpha) gene polymorphisms and serum IgE levels. Allergy 2006;61(10):1230–1233. doi:https://doi.org/10.1111/j.1398-9995.2006.01195.x.
- Granada M, Wilk JB, Tuzova M, Strachan DP, Weidinger S, Albrecht E, Gieger C, Heinrich J, Himes BE, Hunninghake GM, et al. A genome-wide association study of plasma total IgE concentrations in the Framingham Heart Study. J Allergy Clin Immunol 2012;129(3):840–845. doi:https://doi.org/10.1016/j.jaci.2011.09.029.
- Gieger C, Rodriguez E, Baurecht H, Mempel M, Klopp N, Gohlke H, Wagenpfeil S, Ollert M, Ring J, Behrendt H, et al. Genome-wide scan on total serum IgE levels identifies FCER1A as novel susceptibility locus. PLoS Genet 2008;4(8):e1000166. doi:https://doi.org/10.1371/journal.pgen.1000166.
- Ohtsu H, Tanaka S, Terui T, Hori Y, Makabe-Kobayashi Y, Pejler G, Tchougounova E, Hellman L, Gertsenstein M, Hirasawa N, et al. Mice lacking histidine decarboxylase exhibit abnormal mast cells. FEBS Lett 2001; 502(1–2):53–56. doi:https://doi.org/10.1016/S0014-5793(01)02663-1.
- Yamauchi K. Regulation of gene expression of l-histidine decarboxylase and histamine n-methyl-transferase, and its relevance to the pathogenesis of bronchial asthma. Nihon Rinsho 1996;54(2):377–388.
- Green RH, Pavord I. Stability of inflammatory phenotypes in asthma. Thorax 2012;67(8):665–667. doi:https://doi.org/10.1136/thoraxjnl-2012-201657.
- Fahy JV. Type 2 inflammation in asthma–present in most, absent in many. Nat Rev Immunol 2015;15(1):57–65. doi:https://doi.org/10.1038/nri3786.
- Villarino AV,’Kanno Y, O’Shea JJ. Mechanisms and consequences of Jak-STAT signaling in the immune system. Nat Immunol 2017; 18(4):374–384. doi:https://doi.org/10.1038/ni.3691.
- Pernis AB, Rothman PB. JAK-STAT signaling in asthma. J Clin Invest 2002;109(10):1279–1283. doi:https://doi.org/10.1172/JCI0215786.
- Kambayashi T, Koretzky GA. Proximal signaling events in Fc epsilon RI-mediated mast cell activation. J Allergy Clin Immunol 2007; 119(3):544–552. doi:https://doi.org/10.1016/j.jaci.2007.01.017.
- Baines KJ, Simpson JL, Wood LG, Scott RJ, Gibson PG. Systemic upregulation of neutrophil α-defensins and serine proteases in neutrophilic asthma. Thorax 2011; 66(11):942–947. doi:https://doi.org/10.1136/thx.2010.157719.