
Abstract
Objective
Type 2 (T2) inflammation offers a therapeutic target for biologics. Previous trials suggest obesity influences T2-biomarker levels in asthma, though have not accounted for key variables, e.g. inhaled (ICS)/oral corticosteroid (OCS) use. We hypothesized that body mass index (BMI) would affect T2-biomarker levels, after adjusting for covariates.
Methods
A retrospective analysis of data from two recent local trials of 153 participants with asthma (102 difficult-to-treat, 51 mild). Measurements included BMI, fractional exhaled nitric oxide (FeNO) and eosinophils. Correlation and regression analysis were performed for each biomarker to describe their relationship with BMI. Data was analyzed overall, and by asthma severity, T2-status and BMI tertile.
Results
Increasing BMI was associated with reduction in FeNO when stratified by BMI tertile (25 ppb lowest tertile, 18 ppb highest tertile; p = 0.014). Spearmans rank showed a negative correlation between BMI and FeNO in difficult-to-treat asthma (ρ= −0.309, p = 0.002). Linear regression adjusting for sex, age, smoking, atopy, allergic/perennial rhinitis, ICS and OCS confirmed BMI as a predictor of FeNO overall (β= −2.848, p = 0.019). Eosinophils were reduced in the highest BMI tertile versus lowest in difficult-to-treat asthma (0.2x10⁹/L, 0.3x10⁹/L respectively; p = 0.02).
Conclusions
Increasing BMI is associated with lower FeNO in asthma when adjusted for relevant covariates, including steroid use. There also appears to be an effect on eosinophil levels. Obesity, therefore, affects T2 biomarker levels with implications for disease endotyping and determination of eligibility for biologic therapy. Whether this is due to masking of underlying T2-high status or development of a truly T2-low endotype requires further research.
Keywords:
Introduction
Obesity-associated asthma is a more difficult-to-treat, poorly controlled phenotype with worse morbidity and mortality outcomes (Citation1–6). Currently available advanced therapies, such as monoclonal antibody treatment (e.g. mepolizumab, reslizumab, omalizumab, benralizumab, dupilumab) for severe asthma are tailored toward type 2 (T2)-high endotypes. There are limited biomarkers currently available to drive development of novel treatments in T2-low asthma. The T2-high biomarkers include total immunoglobulin E (IgE), peripheral eosinophil count and fractional exhaled nitric oxide (FeNO) and these define criteria for currently available biologic therapy eligibility. Previous studies have suggested that increase in weight may affect these biomarkers directly and affect their ability to identify T2-high endotypes (Citation7–10); this has implications for determination of eligibility for these T2-high endotype-directed advanced therapies in obese individuals. However, these studies have not taken into consideration the interaction of other important variables that affect biomarker interpretation, especially inhaled corticosteroid (ICS) and oral corticosteroid (OCS) use; both ICS and OCS are known to reduce eosinophil and FeNO levels (Citation11,Citation12). There is a need, therefore, to clarify whether BMI influences T2-biomarker levels after adjusting for covariates, and in particular, taking steroid burden into account.
Interpretation of biomarkers must always be with caution and consider factors that may influence their validity. For example, FeNO results can be directly or indirectly affected by smoking, caffeine, atopy, rhinitis, respiratory tract infection, height, and age among other variables (Citation13–16). To our knowledge, no studies have identified an association between BMI and T2-biomarkers in asthma when adjusted for both ICS and OCS use as well as other interacting variables such as smoking status, atopy and rhinitis. We hypothesized that increasing body mass index (BMI) would affect T2-biomarker levels (FeNO, total IgE, blood eosinophil count) in asthma, after adjusting for confounding variables including ICS and OCS use. We performed a post-hoc analysis of data from two recent in-house trials in asthma to test this hypothesis.
Methods
Baseline data were obtained for overweight (BMI 25.0 − 29.9 kg/m2) and obese (BMI ≥ 30 kg/m2) adults with difficult-to-treat asthma, and healthy-BMI (< 25 kg/m2), overweight and obese adults with mild asthma, from the datasets for two recent studies (trial identifiers: NCT03630432, NCT03858608). Full trial protocols including eligibility criteria are described elsewhere (Citation17,Citation18).
In brief, difficult-to-treat asthma was defined by characteristic symptoms and evidence of either airflow limitation with FEV1 variability (at least 200mls and 12% increase in FEV1 after bronchodilator or steroid, or between visits) or airway hyperresponsiveness with positive bronchial challenge; treatment with high dose ICS with or without maintenance OCS use, and uncontrolled disease defined as either Asthma Control Questionnaire (ACQ) score >1.5 or ≥ 2 OCS courses for exacerbation or ≥ 1 hospitalization for asthma in the previous year. Mild asthma participants were recruited from primary care with a recorded asthma diagnosis and prescription of asthma medication within the preceding twelve months. Mild active asthma was defined as ACQ ≤1.5, < 2 OCS courses and no hospitalizations for asthma in the preceding year, and maximum preventer treatment of moderate dose ICS/long-acting B2 agonist (LABA) combination. Exclusion criteria included ICU admission for asthma within the past 6 months, asthma exacerbation requiring OCS course or respiratory tract infection within the past 4 weeks, severe and/or unstable cardiac disease; and commencement of biologic therapy within the prior 6 months.
From the datasets the variables extracted for this analysis were BMI, smoking history, atopic status, ICS and OCS dose, FeNO, and blood eosinophils. Most recent total IgE, where available in clinical record, was retrospectively obtained for this analysis as this was not available from the initial studies.
The dataset was analyzed as a whole, with comparisons made between sub-groups based on disease severity (difficult-to-treat vs mild), BMI, and T2-status (T2-high vs T2-low). BMI tertile stratification was performed by arranging participants in order of BMI and dividing into three equal groups (first tertile being the lowest BMI group and third tertile the highest BMI group). BMI tertile stratification was performed both for the whole dataset and for the difficult-to-treat asthma sub-group. T2-high status was defined as either FeNO ≥ 25 parts per billion (ppb) or eosinophil count ≥ 0.15 × 10⁹/L, with T2-low status below these thresholds (Citation19). Continuous variables were described as mean (standard deviation) or median (interquartile range) depending on distribution, assessed using the Kolmogorov-Smirnov test. Categorical variables were described as number (percentage) and compared using chi-square test or Fisher’s exact test. Continuous variables were compared using independent t test or Mann Whitney U test, and analysis of variance (ANOVA) or Kruskal-Wallis, as appropriate. Associations between T2 biomarkers (FeNO, peripheral eosinophils, total IgE) and BMI were evaluated using scatter plots and Spearman’s correlation coefficient testing. Multiple linear regression was performed with a stepwise approach, after residual analysis confirmed linear assumptions (including normality, homoscedasticity, and equal variance) for test validity, to assess associations between BMI and each biomarker (FeNO, total IgE and peripheral eosinophil count) individually when adjusted for relevant co-variables (atopy, age, sex, smoking, inhaled and oral corticosteroid dose, allergic and perennial rhinitis). A p values of <0.05 was considered statistically significant. All data analyses were performed on IBM SPSS Statistics (version 27.0.1.0).
Results
Demographics and anthropometry
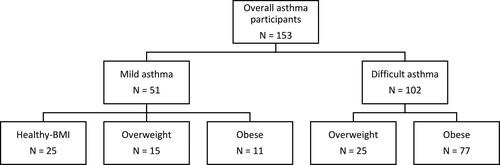
The final dataset of one hundred and fifty-three subjects included one hundred and two individuals with difficult-to-treat asthma (25 overweight, 77 obese), and fifty-one individuals with mild asthma (25 healthy weight, 15 overweight, 11 obese), as shown in .
Figure 1. Trial participants by disease severity and weight category
Demographics and clinical characteristics are shown () for the overall dataset and comparing groups with mild and difficult-to-treat asthma. Comparisons were then made between BMI tertiles, both within the whole dataset (), and within the difficult-to-treat asthma group ().
Table 1. Demographic and clinical characteristics overall and stratified by disease severity.
Table 2. Comparison of all patients divided into BMI tertiles.
Table 3. Comparison of difficult-to-control asthma patients divided into BMI tertiles.
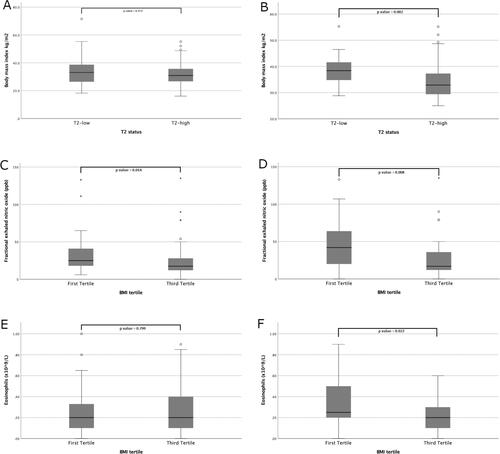
Overall median age was fifty-four years and there was a female predominance (60%). Median BMI was 31.1 kg/m2 overall, with a difference seen between mild and difficult-to-treat asthma groups (25.3 kg/m2 and 33.9 kg/m2 respectively, p values < 0.001). When stratified by T2-status, overall there was no difference in BMI between the T2-high (30.9 kg/m2, IQR 26.6 − 35.7 kg/m2) and the T2-low groups (33.1 kg/m2, IQR 26.0 − 38.9 kg/m2, ). Within the difficult-to-treat asthma group, BMI was higher in the T2-low group (38.4 kg/m2, IQR 34.4 − 42.0 kg/m2) than the T2-high group (32.9 kg/m2, IQR 29.3 − 37.7 kg/m2), p values = 0.002, whilst no significant difference was observed in ICS or OCS usage between these groups (). Likewise, within the difficult-to-treat asthma group, there was a difference in the proportion of patients with T2-high disease between the BMI tertiles (94% and 62% in the lowest and highest tertiles respectively, p values = 0.001).
Figure 2. (A) BMI for all patients categorised by T2-status. (B) BMI for difficult-to-control patients categorised by T2-status. (C) FeNO for all patients by BMI tertile. (D) FeNO for difficult-to-control patients by BMI tertile. (E) Eosinophils for all patients by BMI tertile. (F) Eosinophils for difficult-to-control patients by BMI tertile.
Corticosteroid use
Inhaled equivalent beclomethasone dipropionate dose overall was 1600 mcg, with an expected higher median dose in the difficult-to-treat asthma group compared to the mild asthma group (1900 mcg vs 400 mcg respectively, p < 0.001), but no difference when stratified by BMI tertiles or T2-status in the difficult-to-treat asthma group. The median oral maintenance prednisolone dose in the difficult-to-treat asthma cohort was 5 mg with no difference seen when divided by BMI tertile or T2-status.
T2 biomarkers
Overall median FeNO was 22 ppb with no difference between mild and difficult-to-treat asthma groups. Stratified into BMI tertiles (), median FeNO was 25 ppb, 23 ppb and 18 ppb in the first, second and third tertiles respectively (p = 0.024 between all tertiles; p = 0.014 between lowest and highest tertiles, ).
Median FeNO in the difficult-to-treat asthma group, when categorized into BMI tertiles (), was 42 ppb, 20 ppb, and 17 ppb in the first, second and third tertiles respectively (p = 0.027 between all tertiles; p = 0.008 between lowest and highest tertiles, ).
Eosinophil count overall was 0.2 × 10⁹/L with a higher count in the difficult-to-treat asthma group compared to the mild asthma group (0.3 × 10⁹/L vs 0.1 × 10⁹/L respectively, p values = 0.020). There was no difference between the BMI tertile groups in the overall population (), though, there was a difference between BMI tertiles in the difficult-to-treat asthma group (0.3 × 10⁹/L vs 0.2 × 10⁹/L in the lowest and highest tertiles respectively, p = 0.022, ).
Median total IgE was 148 kU/L with no difference between mild and difficult-to-treat asthma groups or when divided by T2-status or BMI tertile.
Correlation analysis
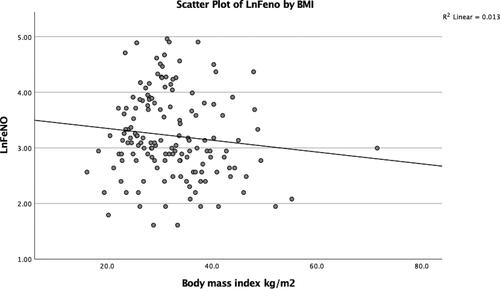
Spearman’s correlation showed no significant associations for either FeNO, eosinophil count or total IgE with BMI in the full dataset (n = 153). In the difficult-to-treat asthma group (n = 102), there was a correlation between BMI and FeNO (ρ = −0.309, two-tailed p values = 0.002), but no associations were seen for eosinophils or total IgE with BMI in this group (see scatterplot of log-transformed FeNO versus BMI ()).
Figure 3. Negative correlation between log-transformed FeNO and BMI.
Regression analysis
In stepwise multiple regression modeling for the overall data set (n = 153), BMI was a significant predictor of FeNO (β = −2.848, p = 0.019) after correcting for age, sex, atopic status, smoking status, allergic rhinitis, perennial rhinitis, inhaled and oral corticosteroid dose. In this model, every increase in BMI of 1 kg/m2 led to a decrease in FeNO of approximately 3 ppb. The overall model was a good fit, R2 = 0.616 (R = 0.79), with no suggestion of multicollinearity (VIF 1.3 − 2.3), and good overall predictor F(9,18) = 3.20, p = 0.017.
No significant results were obtained for eosinophils and total IgE.
Discussion
In this study, we hypothesized that body mass index (BMI) would affect T2-biomarker levels, after adjusting for covariates, especially steroid use. Our analysis demonstrated that increasing BMI was associated with a reduction in FeNO levels. Comparison of FeNO between BMI tertiles within the whole dataset showed a significant decrease in FeNO levels with increasing BMI. This finding was replicated within the difficult-to-treat asthma sub-group despite there being no difference in ICS or OCS dose between the groups, suggesting that the reduction in FeNO with increasing BMI was not due to steroid dose. We found a higher BMI (38.4 kg/m2) in the difficult-to-treat T2-low asthma group compared to the difficult-to-treat T2-high asthma group (32.9 kg/m2) despite similar corticosteroid use, and we showed a lower proportion of T2-high asthma in higher BMI tertiles. Further analysis showed a negative correlation between BMI and FeNO in the difficult-to-treat asthma group and in regression modeling using the full dataset, BMI accounted for 62% of the variation in FeNO and was a significant predictor after adjustment for relevant variables. Although ICS and OCS dose, smoking, atopy and rhinitis, have all previously been identified as affecting FeNO interpretation, previous studies have not adjusted for all of these, and correcting for ICS and OCS dose, in particular, is vital given the known effects on FeNO and eosinophil counts.
Our finding that increasing BMI is associated with a reduction in FeNO (independent of steroid dose) may have important implications for tailoring treatment in obese patients with asthma in this era of precision medicine. FeNO is a predictor of steroid response (Citation20) and is also one of the two key biomarkers used to determine eligibility for dupilumab. Obesity may impact on the eligibility for T2-high targeted treatments, but whether this is a masking effect is unclear. Another possibility is that adipokine-mediated inflammation may be resulting in a true T2-low status resistant to T2-high therapy. If the former is true, and T2-high status is being masked, T2-biomarker eligibility criteria may need to be adjusted in obesity-associated asthma.
The first study to show an inverse relationship between BMI and FeNO was described in 2006 and regression analysis adjusted for atopy, age, sex, FEV1 and ICS use, though did not adjust for other covariates such as OCS use (Citation8). A further study found similar results in patients with moderate-severe asthma compared to healthy control participants, with multivariate regression adjusting for age, sex, atopy, ACQ, airflow obstruction, diagnosis of gastro-oesophageal reflux, and use of both LABA and leukotriene receptor antagonists (Citation7). The authors postulated that obesity might result in increased airway oxidative stress, leading to increased airway inducible nitric oxide synthase (iNOS) uncoupling due to reduced L-arginine/asymmetric dimethyl arginine (ADMA) ratios, resulting in decreased airway epithelium NO (Citation9,Citation21). Another larger scale analysis found that obesity influenced the correlations of total IgE, peripheral eosinophils and FeNO, with sputum eosinophilia, though again adjusting only for age, sex and race (Citation10).
In our study, peripheral eosinophil count decreased with increasing BMI tertile within the difficult-to-treat asthma group (). Spearman’s rank analysis was not significant, however previous studies (Citation10) have shown negative correlation between rising BMI and eosinophil count despite evidence of an increase in pulmonary eosinophil uptake (Citation22) in asthma associated with obesity. Further work in this area has shown an adipokine-mediated effect on systemic and airway eosinophil survival and transit (Citation23–27).
Obesity-associated asthma has been linked with T2-low asthma endotypes however the prevalence of T2-low severe asthma remains controversial. Our study shows that increasing BMI affects interpretation of FeNO which may, in part, account for these disparities. It may be that obesity is affecting our capability to accurately characterize severe or difficult-to-treat asthma cohorts.
There are several limitations to this observational cross-sectional study and as such proof of causation cannot be confirmed. The study was not powered to detect differences in each biomarker with increased BMI and a prospective larger study would be required to confirm our findings. The groups were unequally weighted with a higher proportion of difficult-to-treat obesity-associated asthma participants than any other group. There were no healthy-BMI difficult-to-treat asthma or non-asthma groups for comparison. For pragmatic reasons, our definition of T2-high asthma did not include thresholds for total IgE (a distal marker of T2 inflammation) and even within the T2-low group total IgE was raised. Total IgE was retrospectively sought for this analysis from previous clinic attendance, resulting in missing data particularly from the mild asthma cohort, limiting any conclusions drawn. Whilst BMI is a useful indicator of obesity, it fails to describe and quantify body composition, and more clinically relevant measurements such as waist-to-height or waist-to-hip ratio were not obtained for the initial studies. Nonetheless a key strength of the study was the use of regression analysis adjusting for confounding variables, particularly oral and inhaled corticosteroid dose. Further research is needed to confirm our findings of the effects of obesity on FeNO and eosinophils given the wider implications for determining eligibility for T2-high targeted treatments and predicting responses to these treatments in the obesity-associated asthma population.
Conclusions
In conclusion, our study demonstrates that increasing body mass index is associated with reduction in FeNO, even after correcting for relevant confounders, in particular, steroid use. Whether this is due to a masking effect or fundamentally altered airway inflammation in obese patients with asthma is unclear. Further work is needed to clarify this, given the important implications for determination of eligibility for T2-high targeted treatments and the possibility that criteria may need to be adjusted for the obesity-associated asthma population.
Disclosure statement
The authors report no conflicts of interest.
Funding
None.
References
- Taylor B, Mannino D, Brown C, Crocker D, Twum-Baah N, Holguin F. Body mass index and asthma severity in the National Asthma Survey. Thorax. 2008;63(1):14–20. Jandoi:10.1136/thx.2007.082784.
- Sutherland ER, Goleva E, Strand M, Beuther DA, Leung DY. Body mass and glucocorticoid response in asthma. Am J Respir Crit Care Med. 2008;178(7):682–687. Oct 1doi:10.1164/rccm.200801-076OC.
- Stanescu S, Kirby SE, Thomas M, Ainsworth YL. B. A systematic review of psychological, physical health factors, and quality of life in adult asthma. NPJ Prim Care Respir Med. 2019;29(1):37. Oct 21
- Klepaker G, Svendsen MV, Hertel JK, Holla ØL, Henneberger PK, Kongerud J, Fell AKM. Influence of obesity on work ability, respiratory symptoms, and lung function in adults with asthma. Respiration. 2019;98(6):473–481. doi:10.1159/000502154.
- Luthe SK, Hirayama A, Goto T, Faridi MK, Camargo CA, Jr, Hasegawa K. Association between obesity and acute severity among patients hospitalized for asthma exacerbation. J Allergy Clin Immunol Pract. 2018;6(6):1936–1941.e4. Nov Decdoi:10.1016/j.jaip.2018.02.001.
- Pate CA, Zahran HS, Bailey CM. Impaired health-related quality of life and related risk factors among US adults with asthma. J Asthma. 2019;56(4):431–439. Aprdoi:10.1080/02770903.2018.1466314.
- Komakula S, Khatri S, Mermis J, Savill S, Haque S, Rojas M, Brown L, Teague GW, Holguin F. Body mass index is associated with reduced exhaled nitric oxide and higher exhaled 8-isoprostanes in asthmatics. Respir Res. 2007;8(1):32. doi:10.1186/1465-9921-8-32.
- Barros R, Moreira A, Fonseca J, Moreira P, Fernandes L, de Oliveira JF, Delgado L, Castel-Branco MG. Obesity and airway inflammation in asthma. J Allergy Clin Immunol. 2006;117(6):1501–1502. Jundoi:10.1016/j.jaci.2006.02.027.
- Winnica D, Corey C, Mullett S, Reynolds M, Hill G, Wendell S, Que L, Holguin F, Shiva S. Bioenergetic differences in the airway epithelium of Lean Versus obese asthmatics are driven by nitric oxide and reflected in circulating platelets. Antioxid Redox Signal. 2019;31(10):673–686. Oct 1doi:10.1089/ars.2018.7627.
- Lugogo N, Green CL, Agada N, Zhang S, Meghdadpour S, Zhou R, Yang S, Anstrom KJ, Israel E, Martin R, et al. Obesity’s effect on asthma extends to diagnostic criteria. J Allergy Clin Immunol. 2018;141(3):1096–1104. doi:10.1016/j.jaci.2017.04.047.
- Kharitonov SA, Yates DH, Barnes PJ. Inhaled glucocorticoids decrease nitric oxide in exhaled air of asthmatic patients. Am J Respir Crit Care Med. 1996;153(1):454–457. Jandoi:10.1164/ajrccm.153.1.8542158.
- Matsunaga K, Hirano T, Akamatsu K, Minakata Y. Predictors for identifying the efficacy of systemic steroids on sustained exhaled nitric oxide elevation in severe asthma. Allergol Int. 2013;62(3):359–365. Sepdoi:10.2332/allergolint.12-OA-0530.
- Dweik RA, Boggs PB, Erzurum SC, Irvin CG, Leigh MW, Lundberg JO, Olin AC, Plummer AL, Taylor DR. An official ATS clinical practice guideline: interpretation of exhaled nitric oxide levels (FENO) for clinical applications. Am J Respir Crit Care Med. 2011;184(5):602–615. Sep 1doi:10.1164/rccm.9120-11ST.
- Wang Y, Li L, Han R, Lei W, Li Z, Li K, Kang J, Chen H, He Y. Diagnostic value and influencing factors of fractional exhaled nitric oxide in suspected asthma patients. Int J Clin Exp Pathol. 2015;8(5):5570–5576.
- Taylor DR, Mandhane P, Greene JM, Hancox RJ, Filsell S, McLachlan CR, Williamson AJ, Cowan JO, Smith AD, Sears MR. Factors affecting exhaled nitric oxide measurements: The effect of sex. Respir Res. 2007;8(1):82. Published 2007 Nov 15 doi:10.1186/1465-9921-8-82.
- Bjermer L, Alving K, Diamant Z, Magnussen H, Pavord I, Piacentini G, Price D, Roche N, Sastre J, Thomas M, et al. Current evidence and future research needs for FeNO measurement in respiratory diseases. Respir Med. 2014;108(6):830–841. Jundoi:10.1016/j.rmed.2014.02.005.
- ClinicalTrials.gov. Bethesda (MD): National Library of Medicine (US). 2018 Aug 14. Identifier: NCT03630432, Pulmonary Rehabilitation for Uncontrolled Asthma Associated With Elevated BMI (PRODA01); cited 2021 Sep 28. Available from: https://clinicaltrials.gov/ct2/show/NCT03630432.
- ClinicalTrials.gov. Bethesda (MD): National Library of Medicine (US). 2019 Aug 13. Identifier: NCT03858608, Weight Loss for Uncontrolled Asthma Associated With Elevated BMI; cited 2021 Sep 28. Available from: https://clinicaltrials.gov/ct2/show/NCT03858608.
- Jackson DJ, Busby J, Pfeffer PE, Menzies-Gow A, Brown T, Gore R, Doherty M, Mansur AH, Message S, Niven R, et al. UK Severe Asthma Registry. Characterisation of patients with severe asthma in the UK Severe Asthma Registry in the biologic era. Thorax. 2021;76(3):220–227. Mardoi:10.1136/thoraxjnl-2020-215168.
- Cowan DC, Cowan JO, Palmay R, Williamson A, Taylor DR. Effects of steroid therapy on inflammatory cell subtypes in asthma. Thorax. 2010 May;65(5):384–390. doi:10.1136/thx.2009.126722.
- Holguin F, Comhair SA, Hazen SL, Powers RW, Khatri SS, Bleecker ER, Busse WW, Calhoun WJ, Castro M, Fitzpatrick AM, et al. An association between L-arginine/asymmetric dimethyl arginine balance, obesity, and the age of asthma onset phenotype. Am J Respir Crit Care Med. 2013;187(2):153–159. doi:10.1164/rccm.201207-1270OC.
- Farahi N, Loutsios C, Tregay N, Wright AKA, Berair R, Lok LSC, Gillett D, Cullum I, Simmonds RP, Summers C, et al. In vivo imaging reveals increased eosinophil uptake in the lungs of obese asthmatic patients. J Allergy Clin Immunol. 2018;142(5):1659–1662.e8. Novdoi:10.1016/j.jaci.2018.07.011.
- Conus S, Bruno A, Simon HU. Leptin is an eosinophil survival factor. J Allergy Clin Immunol. 2005;116(6):1228–1234. Decdoi:10.1016/j.jaci.2005.09.003.
- Kato H, Ueki S, Kamada R, Kihara J, Yamauchi Y, Suzuki T, Takeda M, Itoga M, Chihara M, Ito W, et al. Leptin has a priming effect on eotaxin-induced human eosinophil chemotaxis. Int Arch Allergy Immunol. 2011;155(4):335–344. doi:10.1159/000321195.
- Takeda M, Ueki S, Kato H, Konno Y, Chihara M, Itoga M, Kobayashi Y, Moritoki Y, Ito W, Kayaba H, et al. Obesity and eosinophilic inflammation: does leptin play a role. Int Arch Allergy Immunol. 2012;158 Suppl 1:87–91. doi:10.1159/000337799.
- Desai D, Newby C, Symon FA, Haldar P, Shah S, Gupta S, Bafadhel M, Singapuri A, Siddiqui S, Woods J, et al. Elevated sputum interleukin-5 and submucosal eosinophilia in obese individuals with severe asthma. Am J Respir Crit Care Med. 2013;188(6):657–663. Sep 15doi:10.1164/rccm.201208-1470OC.
- Calixto MC, Lintomen L, Schenka A, Saad MJ, Zanesco A, Antunes E. Obesity enhances eosinophilic inflammation in a murine model of allergic asthma. Br J Pharmacol. 2010;159(3):617–625. Feb 1doi:10.1111/j.1476-5381.2009.00560.x.