
Abstract
Objective: Some of the most common causes of chronic cough include cough variant asthma (CVA), bronchial asthma (BA), and asthma–COPD overlap (ACO). Although there is some overlap in the etiology of these diseases, it is clinically important to attempt an early differential diagnosis due to treatment strategies and prognoses.
Methods: Spirometry and impulse oscillometry (IOS) before and after bronchodilator inhalation were analyzed for clinically diagnosed CVA (cCVA, n = 203), BA (cBA, n = 222), and ACO (cACO, n = 61).
Results: A significant difference in ΔFEV1 was observed between cBA and cCVA (ΔFEV1 improvement of 122.5 mL/5.4% and 65.7 mL/2.2%, respectively), but no difference was observed in ΔPEF, ΔV50, or ΔV25. Except for R20 (resistance at 20 Hz), significant differences between the three groups were observed in IOS. In IOS, cCVA and cBA showed comparable peripheral airway response to bronchodilator which was thought to be commensurate with changes in V50 and V25. cACO improved ΔFEV1 improvement of 81.0 mL/6.2% and was distinguished by a downward respiratory system reactance (Xrs) waveform with a limited bronchodilator response. FEV1/FVC, %FEV1, and %V25 had relatively strong correlations with the three IOS parameters, X5 (reactance at 5 Hz), resonant frequency (Fres), and low-frequency reactance area (ALX), in the correlation between IOS and spirometers.
Conclusion: Changes in IOS parameters were more sensitive in this study than changes in FEV1 or the flow-volume curve. Considering the benefits and relevance of the two different tests, simultaneous IOS and spirometry testing were useful in the diagnosis of asthmatic cough.
Introduction
Persistent and chronic cough lasting over 8 weeks was reported to account for 10% of visits to respiratory medicine clinics (Citation1). A causative disease survey conducted in a multicenter study in Japan revealed that cough variant asthma (CVA) and bronchial asthma (BA) with cough accounted for ≥ 70% of patients complaining of cough (Citation2). When patients present to the hospital with a chronic cough, there may be multiple etiologies, as well as changes in etiology over time. Therefore, it is critical to be flexible and reliable in the differential diagnosis at the time of the initial visit.
CVA is an asthma phenotype distinguished by coughing without wheezing or dyspnea and bronchial hyper responsiveness (Citation3,Citation4). Because the effectiveness of inhaled beta-2 agonists for cough is specific to CVA (Citation5), cough that is relieved by bronchodilators CVA can be diagnosed (Citation6). The mild peripheral airflow limitation and airway reversibility have also been reported in CVA patients (Citation7,Citation8). Though it is speculated that CVA will be aggravated to BA due to airway inflammation, the progression from CVA to BA has not been fully understood. Therefore, early detection of CVA is important, and distinguishing CVA from BA may lead to a better understanding of the disease (Citation9). Bronchial hyper responsiveness is typically identified through bronchial provocation tests, a positive response to bronchodilators, or both (Citation10,Citation11). Bronchial provocation tests are the gold standard for diagnosing asthma, but they are expensive, time-consuming, and risky since they have the potential to cause severe bronchospasm (Citation12). The diagnostic criteria for CVA in Japanese guidelines are based on the clinical effects of bronchodilators, making it sometimes difficult to make a definitive diagnosis before treatment (Citation6). As a result, it is important to develop a new method for the early detection of CVA early and distinguishing it from BA.
Due of the disease concept, chronic obstructive pulmonary disease (COPD) with BA, also known as asthma–COPD overlap (ACO), has attracted a lot of attention in recent years. The 2020 Global Initiative for Chronic Obstructive Lung Disease (GOLD) update removed the term ACO (Citation13). This was because asthma and COPD were distinct disorders, albeit sharing common traits and clinical features. In this report, we use the term ACO because COPD components are clinically important to evaluate whether patients with asthma concurrently have COPD in primary care for the following reasons: regardless of the diagnosis criteria, ACO is a relatively common condition among asthma or COPD patients with ACO who may have a higher frequency (Fres) of exacerbation and a faster decline in lung function compared to those with asthma or COPD, and asthmatic features, such as eosinophilic airway inflammation are promising indicators for predicting inhaled corticosteroid (ICS) responsiveness in COPD (Citation14).
The forced oscillation technique is used in impulse oscillometry (IOS) to measure respiratory system resistance and reactance during tidal breathing. It is noninvasive to the subject, does not require any breathing effort, and is simple to perform. IOS is a useful clinical test that uses colored 3D images to access airflow obstruction simply by breathing, but it has the disadvantage that many factors influence the measured values (e.g. age, sex, height, weight, smoking, the elasticity of lung, and the artifacts, such as swallowing, glottis closure, poor cheek support, tongue movement, or the presence of leaks) (Citation15,Citation16), and there is no uniform reference value (Citation17–20). Basically, three measurements need to be performed in technical standards for IOS (Citation21), although in a study conducted by Watts et al. analyzing the effect of the period of data gathering during the measurements on FOT results, two technically sustainable measurements derive the same mean resistance and reactance values as three or more replicate measurements, no matter how long the measurement lasts (Citation22). Recent research has revealed that some IOS parameters correlate with spirometry-measured parameters, such as forced expiratory volume 1 min (FEV1), and serve as indices for airway reversibility (Citation20–24). Furthermore, reports were noted on the pattern classification of the characteristics of the IOS in each respiratory disease (Citation25), and predictive equations showing the reference values of IOS parameters were noted (Citation26).
In this study, the airway response to bronchodilator in IOS was measured simultaneously through spirometry, and the characteristics of spirometry and IOS in clinically diagnosed CVA (cCVA), BA, and ACO were examined using a sample size of 486 previously unreported patients. The purpose of this study was to determine the approved IOS interpretation conjunction with spirometry in the differential diagnosis of asthmatic cough in clinical practice. The relationship between parameters of spirometry and IOS in all participants was then examined, adding some insights into the complementary use of these two tests.
Methods
Subjects
From April 2019 to March 2020, medical records of cCVA, BA, or ACO patients who visited the outpatient clinic of Nippon Medical School Respiratory Care Clinic were retrospective to obtain the clinical data, such as diagnosis, gender, age, body height, body weight, BMI, smoking history, laboratory data, and therapeutic intervention. This is a cross-sectional study based on the clinical diagnoses at the time spirometry and IOS testing were performed. There were 203, 222, and 61 cases of cCVA, BA, and ACO, respectively, among the 486 eligible participants who underwent airway reversibility testing for spirometry and IOS. At the time of the survey, 219 participants had already been treated by a previous physician, and 267 were undiagnosed or untreated with long-term controlled medications.
The enrolled subjects provided informed consent using a comprehensive agreement method, and the study was approved by the ethics committees of the Nippon Medical School Hospital (B-2020-175).
Study design
Following a review of the patient’s medical and medication history, the chosen patients included those who were not taking ACE inhibitors and did not have any other cough-related complications, such as heart failure or gastroesophageal reflux disease (GERD). Those with infectious diseases, neoplastic diseases, chest deformities, and fibrosis, as well as those associated with other respiratory diseases, were excluded. The questionnaire was completed by 486 eligible participants, who were tested for respiratory impedance (IOS) and pulmonary function. To avoid the effects of forced breathing on the airway, IOS was performed before spirometry. To access airway reversibility, IOS and spirometry were performed simultaneously before and after inhalation of a short-acting beta-2 agonist (SABA). Clinical parameters, such as peripheral blood eosinophil count, serum total IgE and allergen-specific IgE, and fractional exhaled nitric oxide (FeNO) in exhaled air were also measured.
Generally, the following features are used to make a clinical diagnosis of asthma: (i) repetitive symptoms, such as paroxysmal dyspnea, wheezing, chest tightness, and cough, (ii) reversible airflow limitation, (iii) airway hyperresponsiveness, (iv) airway inflammation, (v) an atopic state, and (vi) exclusion of other cardiopulmonary diseases. The doctor, a board-certified member of the Japanese Respiratory Society (JRS), clinically diagnosed BA (cBA) based on the JRS guidelines for asthma (Citation27) and the Global Initiative for Asthma (GINA) international recommendations for asthma management (Citation28). Participants in this study were not tested for airway hyperresponsiveness with drugs, such as histamine, methacholine, and acetylcholine because a standard quantitative method for airway hyperresponsiveness involves load tests that induce severe bronchospasm. Based on the baseline %FEV1 and % peak expiratory flow (PEF) measurements, the classification of asthma severity in this study was divided into three groups, namely, intermittent to mild (both of %FEV1 and %PEF are ≥ 80% of predicted values), moderate (the lower of %FEV1 or %PEF is ≥ 60%, < 80% of predicted values), and severe (%FEV1 or %PEF is < 60% of predicted values) (Citation27).
The clinical diagnosis of CVA was made using national guideline diagnostic criteria, the JRS guidelines for cough and sputum management (Citation6). For a diagnosis of CVA, the following criteria must be met: (i) persistent cough without wheezing for more than 8 weeks, the absence of wheezing on auscultation, and (ii) response to bronchodilators (e.g. beta-2 agonists). The following three points are not required but are presented as suggestive findings in JRS guidelines: (i) peripheral blood or sputum eosinophilia or a high FeNO level may be observed, (ii) airway hyperresponsiveness, and (iii) cough symptoms are often seasonal or show day-to-day variation and are often prominent during the night to early morning.
The JRS diagnostic criteria were followed, and ACO was diagnosed as follows. In adults, over 40 years of age with a smoking history (10 pack-years or more) or career involving significant air pollution or biomass exposure, the post-bronchodilator FEV1/forced vital capacity (FVC) should be < 70%. Furthermore, COPD must be distinguished by smoking history, emphysematous changes, and decreased gas exchange. Asthma is characterized by variable or paroxysmal clinical symptoms, a documented history of asthma before the age of 40, elevated FeNO, and a history of allergic rhinitis, airway reactivity, elevated peripheral sputum eosinophils, or elevated total or allergen-specific IgE levels. An ACO diagnosis (with features of both asthma and COPD) can then be made (Citation29).
This study had a following weakness in the accuracy of the diagnoses; (i) the patients already receiving treatment were partially included, (ii) the variations in symptoms (i.e. diurnal or seasonal), airway hyperresponsiveness, and wheezing were based on medical records without objective numerical data, such as peak flow diaries, and (iii) the diagnoses were made without bronchoprovocation tests. Considering these weaknesses, the diagnosis and severity of each disease were described as cCVA, cBA, and clinically diagnosed ACO (cACO).
Impulse oscillometry (respiratory impedance)
The IOS was used to measure respiratory impedance using a commercially available oscillatory system (MostGraph-22 (Rev.1.2), Chest M.I., Co. Ltd., Tokyo, Japan), which met the standard recommendations described by Shirai et al. (Citation30,Citation31). In the sitting position, subjects supported their cheeks with their hands and wore a nose clip. They were told to breathe quietly for 30 s at a functional residual capacity level (tidal breathing). The measurements were repeated five times more until technically acceptable records were obtained. The respiratory impedance was calculated automatically using a personal computer and a fast-Fourier transformation of the airflow and pressure signals at their mouths. The respiratory system resistance values at 5 and 20 Hz (R5 and R20, respectively), the difference between R5 and R20 (R5–R20), respiratory system reactance (Xrs) at 5 Hz (X5), resonant Fres, and low-frequency reactance area (ALX) were measured. During a respiratory cycle, each oscillatory index was expressed as a mean value (whole breath).
Pulmonary function tests
Spirometry was performed on a spirometry system (CHESTAC-8900 (Rev.1.6), Chest M.I., Co. Ltd., Tokyo, Japan) following the American Thoracic Society (ATS)/European Respiratory Society (ERS) standards (Citation32) and the JRS guidelines (Citation33). The FEV1, FVC, FEV1/FVC, PEF, and forced expiratory flow at 50% and 25% of the FVC (V50 and V25) were measured. These parameters were expressed as percentages of predicted values using JRS-published predictive equations (Citation33).
Bronchodilator response
Airway reversibility is a key feature of asthma and can be measured using pulmonary function testing before and 15–20 min after SABA inhalation. In this study, salbutamol 200 mcg was used as SABA. Bronchodilator medication was withheld for the following periods before airway reversibility test: SABA ≥ 8 h, long-acting beta-2 agonist (LABA) for twice-daily inhalation ≥ 18 h, LABA for once-daily inhalation ≥ 36 h, and long-acting muscarinic antagonists (LAMA) for once-daily inhalation ≥ 36 h (Citation27). When FEV1 increased by 200 ml and 12% after SABA inhalation, the reversible airflow limitation was considered as positive. Although airway reversibility is a well-known asthma feature, it can be reduced in subjects with stable asthma or those who have airway remodeling.
Fractional exhaled nitric oxide
According to the ATS/ERS recommendations (Citation34), FeNO was measured at a flow rate of 50 ml/s using an NO analyzer (NIOX VERO, Aerocrine Co. Ltd., Stockholm, Sweden). To maintain a stable flow rate, the patients exhaled for 10 s at an exhalation pressure of 10–20 cmH2O. The FeNO value was calculated automatically by an NO analyzer.
Statistical analysis
For continuous variables, data were expressed as mean (standard deviations) or median (interquartile range) values. We checked whether continuous variables were normally distributed. For parametric comparisons between the two groups, Student’s t-test was used. In a nonparametric test, the Wilcoxon rank-sum test was used to compare the two groups. Because of the sample size variability and the inclusion of samples that did not show normality, the Kruskal–Wallis test, a nonparametric test, was used for analysis in the three-group comparison. The Steel–Dwass test was then used to determine whether there were any significant differences between the three groups. A p values < 0.05 on both sides was considered statistically significant. The correlation between the two variables was assessed using Spearman correlation analysis. All statistical analyses were conducted using the JMP software version 11 (SAS Institute Inc., Cary, NC).
Results
summarizes the clinical characteristics of each group. The cCVA, cBA, and cACO groups had mean ages of 44.9 ± 13.7, 50.9 ± 15.6, and 66.1 ± 9.3 years, respectively. A total of 64 (31.5%) cCVA patients, 89 (40.1%) cBA patients, and all cACO patients were current or former smokers. 138 of cCVA (68.0%), 104 of cBA (46.8%), and 25 of cACO (41.0%) were in the untreated state. For subjects already treated, patients with cCVA and cBA were more likely to be prescribed ICS and LABA than LAMA. Patients with cACO were prescribed ICS, LABA, and LAMA in equal proportions. Allergic predispositions (e.g. serum IgE, peripheral eosinophils, and FeNO) were greater in cBA and cACO than in cCVA.
Table 1. Characteristics of the subjects.
categorizes asthma severity into three groups based on baseline %FEV1 and %PEF. There was intermittent to mild asthma in 168 of 203 cCVA patients (82.8%) and 157 of 222 cBA patients (70.7%). Among all patients with cBA, 23.4% (52/222) were moderate, and 5.9% (13/222) were severe. 66.3% (69/104) of untreated cBA patients were intermittent to mild, 29.8% (31/104) were moderate, and 3.8% (4/104) were severe. The 61 cACO patients were classified as mild with about 30%, moderate with 30%, and severe with 40%, and 25 untreated cACO patients were mild with 20%, moderate with 28%, severe with 52%.
Table 2. Classification of asthma severity based on baseline %FEV1 and %PEF.
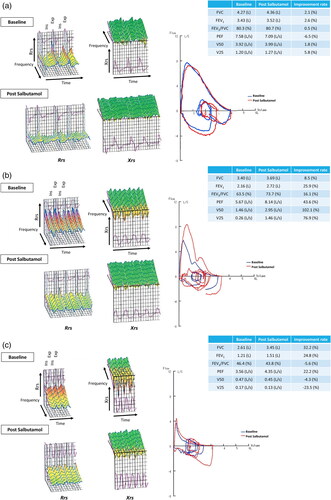
shows a typical colored three-dimensional IOS image as well as the pulmonary functions of typical cases with CVA (a), BA (b), and ACO (c) cases. The IOS waveforms are represented in 3D graphics as respiratory resistance, Rrs, which has three components (R5, R20, and R5–R20), and reactance, Xrs, with also three components (X5, Fres, and ALX). In typical CVA cases, there is an improvement in airway resistance after SABA inhalation. Spirometry of CVA shows no change before and after SABA inhalation. However, paying attention to the latter expiratory phase of the flow–volume curve, the peripheral airflow reflected in V25 improves slightly after SABA inhalation. In cases of typical BA, the IOS waveform shows greater airway resistance than with CVA, indicating improvement after SABA inhalation. The FEV1 recovery in BA patients is ≥ 200 ml and ≥ 12% and is a significant improvement in PEF, V50, and V25, as represented by flow–volume curves. When the FEV1/FVC is < ratio is 70% after SABA inhalation, ACO is diagnostically significant and is associated with airway reversibility. The IOS waveform of typical ACO is distinguished by an increase in the downward waveform of the reactance component expressed by Xrs as well as an increase in the airway resistance expressed by Rrs.
Figure 1. Colored 3D images of IOS and pulmonary functions of typical cases with CVA, BA, and ACO. A case of CVA (a), BA (b), and ACO (c). In typical cases of CVA, an improvement in airway resistance after SABA inhalation was noted, and the spirometry shows negligible change before and after SABA inhalation. In cases of typical BA, the IOS waveform shows stronger airway resistance, indicating improvement after SABA inhalation. The recovery of FEV1 in BA patients is ≥ 200 ml and ≥ 12%, and a significant improvement of flow–volume curves is also noted. ACO is diagnostically important when the FEV1/FVC is < 70% after SABA inhalation and has airway reversibility. The IOS waveform of typical ACO is characterized by an increase in the downward waveform of the reactance component expressed by Xrs in addition to an increase in the airway resistance of Rrs.
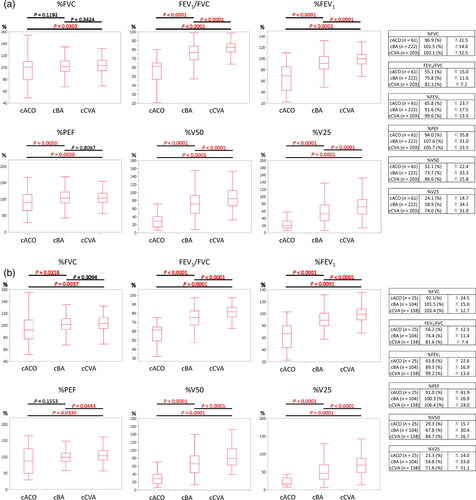
depicts a comparison of cACO, cBA, and cCVA patients’ baseline spirometric parameters. The FEV1/FVC of all subjects (n = 486) was 82.1, 75.8, and 55.1% in the cCVA, cBA, and cACO groups, respectively, and 81.6, 74.4, and 56.2% and untreated subjects (n = 267). Furthermore, the %FEV1 of cACO was 65.8% and 63.8% in all patients and untreated patients, which was lower than the other two diseases. The %FEV1 for cBA and cCVA was approximately 90 and 100%, respectively, with statistically significant differences between the two diseases. %PEF exhibited a relatively little difference among cCVA, cBA, and cACO. %V50 and %V25 were lowest in cACO, followed by cBA and cCVA, with significant differences among the groups, and were useful indices for differential diagnosis reflecting peripheral airflow limitation.
Figure 2. Comparison of baseline spirometric parameters of cACO, cBA, and cCVA patients. The results are shown separately for (a) 486 of all subjects and (b) 267 of untreated subjects”. The FEV1/FVC of all subjects (n = 486) were 82.1, 75.8, and 55.1% in the cCVA, cBA, and cACO groups, respectively, and those for each group of untreated subjects (n = 267) were 81.6, 74.4, and 56.2%, respectively. %FEV1 of cACO was 65.8% and 63.8% in all patients and untreated patients, respectively, which were lower than those of the other two diseases. The %FEV1 was approximately 90% and 100% for cBA and cCVA, respectively, with statistically significant differences among the two diseases. %PEF exhibited a relatively little difference among cCVA, cBA, and cACO. %V50 and %V25 were lowest in cACO, followed by cBA and cCVA, with significant differences among the groups.
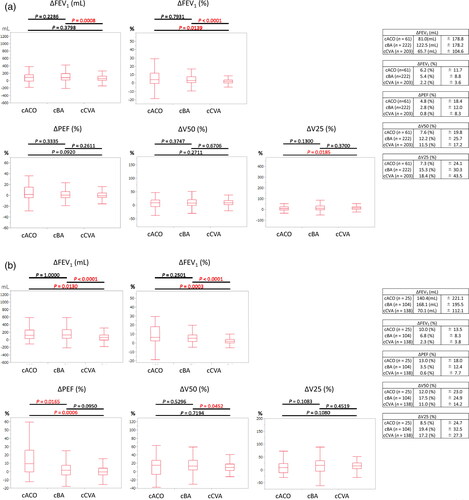
Responses to SABA in spirometry are presented for 486 and 267 of all subjects and untreated subjects, as shown in . Of the 486 total subjects, cACO, cBA, and cCVA showed ΔFEV1 improvement of 81.0 ml/6.2%, 122.5 ml/5.4%, and 65.7 ml/2.2%, respectively. In 267 untreated subjects, cACO, cBA, and cCVA showed ΔFEV1 improvement of 140.4 ml/10.0%, 168.1 ml/6.8%, and 70.1 ml/2.3%, respectively. The results of both analyses revealed significant differences between cBA and cCVA, indicating that focusing on changes in ΔFEV1 was useful in differentiating BA from CVA. The ΔPEF improvement rates following SABA inhalation were 4.8, 13.0, 2.8, and 3.5% for all cACO, untreated cACO, all cBA, and untreated cBA patients, respectively, while cCVA remained nearly unchanged for both. When diagnosing CVA, noting that FEV1 and PEF were normal but that V50 and V25 were decreased, which improves with SABA (ΔV50 improves by 11.0–11.5% and ΔV25 by 17.2–18.4%), was important. A 12.2–19.4% improvement in ΔV50 and ΔV25 in cBA was observed, which was hardly a significant difference when compared to the cCVA group. The number (percentage) of patients with positive airway reversibility tests with ΔFEV1 ≥ 200 ml and ≥ 12% was as follows: 25 out of 222 total cBA patients (11.3%), 16 out of 104 untreated cBA patients (15.4%), 9 out of 61 total cACO patients (14.8%), and 7 out of 25 untreated cACO patients (28.0%).
Figure 3. Responses to SABA in spirometry. The results are shown separately for (a) 486 of all subjects and (b) 267 of untreated subjects. Of the total subjects, cACO, cBA, and cCVA showed ΔFEV1 improvement of 81.0 ml/6.2%, 122.5 ml/5.4%, and 65.7 ml/2.2%, respectively. In untreated subjects, cACO, cBA, and cCVA showed ΔFEV1 improvement of 140.4 ml/10.0%, 168.1 ml/6.8%, and 70.1 ml/2.3%. Significant differences in ΔFEV1 were observed between cBA and cCVA for both all subjects and untreated subjects. The ΔPEF improvement rates after SABA inhalation were 4.8, 13.0, 2.8, and 3.5% for all cACO, untreated cACO, all cBA, and untreated cBA patients, respectively, and cCVA was almost unchanged for both. The degree of improvement in peripheral airflow after SABA inhalation in cCVA was 11.0%–11.5% at ΔV50 and 17.2%–18.4% at ΔV25. A 12.2%–19.4% improvement was observed in ΔV50 and ΔV25 in cBA, which was hardly a significant difference compared with the cCVA group.
presents the median of each baseline IOS parameter and response to SABA with cCVA, cBA, and cACO patients. Other than R20, significant differences were observed between groups regardless of the therapeutic condition. According to the findings, IOS is a useful test method for disease differentiation. No difference was found in the 20 Hz resistance (R20), which represents the resistance of the larger airways because these diseases primarily affect the peripheral rather than the central airways. As presented in , the changes in IOS parameters before and after SABA inhalation resulted in a significant improvement in airway resistance in cCVA and cBA (a). We can diagnose CVA by looking for abnormal airway resistance in IOS with reversibility while spirometry data appear normal. In contrast, no change was observed before and after SABA inhalation in R5–R20, X5, and ALX in 61 total cACO patients. SABA did not restore Fres dependence in ACO patients, and there was no improvement in the reactance component, indicating the presence of excessive airway secretions, airway remodeling, lung parenchyma, or thorax problems. In the 25 untreated cACO patients, changes with statistical significance in all IOS parameters were observed before and after SABA in the 25 untreated cACO patients, as presented in , indicating that the airways are supple and responsive to treatment. Both cCVA and cBA showed significant IOS improvement after SABA inhalation (), but no significant difference was found in the degree shown in all six parameters, ΔR5 to ΔALX (). In other words, in IOS, BA and CVA have the same level of airway response to SABA inhalation.
Table 3. Baseline IOS parameters and response to SABA with cACO, cBA, and cCVA.
(a) 486 of all subjects.
(b) 267 of untreated subjects.
Table 4. Changes in each IOS parameter before and after inhaling SABA..
(a) 486 of all subjects.
(b) 267 of untreated subjects.
presents the correlation between baseline IOS and spirometric parameters. In the combination of FEV1/FVC, %FEV1 and %V25, and the reactance parameters of IOS, X5, Fres, and ALX, the Spearman analysis revealed a relatively strong correlation with ρ ≥ 0.4, ρ ≤ −0.4, and p values < 0.05. The findings suggested that X5, Fres, and ALX were potential IOS indicators that could be used instead of FEV1, which were standard measures of airflow limitation in the diagnosis of asthma-related diseases. The correlation between %V25 and the three IOS reactance parameters suggests that it acutely reflects subtle changes in the peripheral airways.
Table 5. Correlation between baseline IOS and spirometric parameters (n = 486).
Discussion
Spirometry determines the volume or flow generated by the individual, whereas IOS measures resistance and reactance components of respiratory impedance. IOS measurements also include the proximal and distal airways, lung tissue, and chest wall resistance. The IOS principle is based on the placing of sound waves on normal tidal breathing, which causes disturbances in the flow and pressure across the airways, resulting in an output of respiratory resistance, reactance, and impedance using the fast-Fourier transform technique (Citation35). These IOS characteristics were considered and thoroughly evaluated in conjunction with spirometry.
CVA is diagnosed by coughing without wheezing for more than 8 weeks, the absence of wheezing on auscultation, and response to bronchodilators (Citation6). In clinical practice, bronchodilators are rarely used as single agents to diagnose CVA, and some clinicians do not consider the bronchodilator an effective part of the diagnostic criteria. Bronchodilators are also effective in COPD-derived cough and cough-dominant BA, and making a differential diagnosis using traditional domestic diagnostic criteria can be challenging. The US and European guidelines list four causes of chronic cough, namely, upper airway cough syndrome, asthma, non-asthmatic eosinophilic bronchitis, and GERD (Citation10,Citation36). These are causes for chronic cough in patients who are nonsmokers not on ACE inhibitors. However, several problems have been raised. First, it is quite difficult to assign the diagnosis of patients complaining of cough to one of these four diseases. Furthermore, the mechanisms by which these underlying diseases cause cough are not well understood. This study’s purpose and benefit of distinguishing between BA and CVA in patients with chronic cough are that they have different prognoses and treatment strategies (e.g. the risk of fatal severe attacks and the need to continue ICS prophylactic inhalation).
Asthma is not a diagnosis but a clinical syndrome characterized by a set of signs and symptoms, so definitive criteria for the diagnosing of asthma do not exist (Citation37). Asthma refers to a group of pulmonary diseases that share the feature of reversible airway obstruction and can be classified as allergic or nonallergic (Citation38). Asthma caused by an IgE-mediated immunologic mechanism is classified as allergic, whereas those not caused by IgE are classified as nonallergic and include a wide range of phenotypes (Citation39). On the other hand, the difficulty in differentiating CVA from BA stems from the inability to differentiate mild BA from CVA. In this study, patient selection bias is caused by the following: as a satellite clinic specializing in respiratory medicine directly connected to a university hospital located in the central business district of Tokyo, it attracts patients with relatively mild symptoms that do not interfere with their employment, as businessmen seeking a high-level diagnosis can visit the clinic during their work hours. Another potential weakness of this study is that it was designed by a single research center and diagnosed by a single pulmonologist, which could have affected the results. Another limitation of this study is that airway hyperresponsiveness testing was not assessed, and the inability to differentiate between severe smoking asthma and ACO.
The baseline values of FEV1/FVC, %FEV1, %V50, and %V25 found in this study exhibited significant differences in cBA and cCVA, but not %PEF. The lack of a decrease in PEF among the cBA group may be attributed to the many mild BA patients included in this study. Significant differences in ΔFEV1 (in milliliter) and ΔFEV1 (in percentage) were found between cBA and cCVA, but not in ΔPEF, ΔV50, or ΔV25. The lack of difference in ΔPEF, ΔV50, and ΔV25 in the flow–volume curves of cBA and cCVA indicates that CVA has the same degree of peripheral airway reversibility as BA. When diagnosing CVA, attention should be focused on the normal FEV1 and PEF but decreased V50 and V25 which improves with SABA. In this study, more than 80% of patients classified as cBA did not meet the criteria for positive airway reversibility of ΔFEV1 ≥ 200 ml and ≥ 12%. One reason for this was a patient selection bias, which meant that patients with minor symptoms would come to our clinic. Although meeting the GINA diagnostic criteria (FEV1/FVC ≤ 75–80%) (Citation28), the actual baseline FEV1/FVC in all cBA patients was 75.8%, and that in untreated cBA patients was 74.4%, with mild airflow limitation. In terms of diagnostic vulnerability, we have not demonstrated variability in airflow limitation as objective numerical data, such as diurnal variation in a patient’s PEF. Some patients consistent with CVA on spirometry and IOS interpretation were not auscultated wheeze, but self-reportedly complained of wheeze. These patients were assigned to cBA according to national diagnostic criteria, and belonged to mild cBA with negative airway reversibility. Long-term steroid and bronchodilator use of the treatment may have influenced results, even if stopped just before the IOS and spirometer readings. And this study had a weakness in the accuracy of the BA diagnosis because the asthma diagnosis was made without bronchoprovocation tests.
When IOS was used to distinguish between cCVA and cBA, the differences were noted in all parameters, except for R20. Only R20, which reflects the condition of the central airways, does not differ between cCVA and cBA, implying that the main differentiation lesion is in the peripheral airways. Sound waves with higher frequencies (20 Hz) travel shorter distances and generally till the large airways. Hence, resistance at 20 Hz (R20) can be thought of as reflecting the resistance of the large airways. Lower-Fres sound waves (5 Hz) travel long distances and generally reach the small airways. Hence, the resistance at 5 Hz (R5) can be thought of as reflecting the total airway resistance. Subtracting R20 from R5 (R5–R20) reflects resistance in the small airways (Citation31). All IOS parameters of cCVA and cBA showed a significant decrease in airway resistance after SABA inhalation. However, no significant difference was observed in the degree of improvement (ΔR5 to ΔALX). Thus, airway resistance decreased to the same extent in both cCVA and cBA after SABA inhalation, implying that CVA is a similar or a milder pathology to BA.
Patients with COPD with BA, also known as ACO, differ from those with CVA and BA due to the COPD elements. The difference between ACO and the other two diseases is characterized by the waveform of the reactance IOS component, which is the downward graph of Xrs, which distinguished ACO from the two diseases. The ACO diagnosis is based on the presence of obvious obstructive changes as well as airway reversibility by spirometry in the context of an allergic predisposition. ACO was well characterized in untreated cACO patients (n = 25), in terms of response to SABA, particularly in changes in respiratory reactance (ΔFres, ΔALX), which were significantly larger than those of cCVA and cBA. The degree of improvement in airway resistance after SABA inhalation was only mild in cACO patients, suggesting the presence of airway remodeling, excessive airway secretions, lung parenchyma, or thorax problems. Yamamura et al. reported the respiratory impedance in 74 and 34 patients with COPD and ACO, respectively (Citation40). They found that R5, R20, R5–R20, and ALX were significantly higher in ACO than in COPD, while X5 was significantly lower. Although both BA and COPD are obstructive pulmonary diseases characterized by chronic airway inflammation, they differ in terms of airflow limitation and structural alteration. They are considered in ACO patients who have both BA and COPD clinical features, and the degree of airflow limitation is theoretically greater than in BA and COPD patients. The report by Yamamura et al. is also consistent with this study’s findings that cACO has higher respiratory resistance than cCVA and cBA.
We investigated the clinical significance of the correlation between IOS and spirometry parameters measured at the same time. FEV1/FVC, %FEV1, and %V25 were found to have relatively strong correlations with IOS parameters, X5, Fres, and ALX. In the diagnosis and management of asthma, FEV1 is the most important index of airway narrowing. Though Xrs, respiratory reactance, is said to be an indicator of lung parenchyma or airways, it is unclear why these Xrs parameters have relationships with markers of airway obstruction (Citation20). The airway in breathing is a complex environment with both inertial and elastic properties, which are affected by the volume and velocity of the oscillating air (Citation41). In addition, the state of the lung parenchyma surrounding the airways is reflected in IOS measurements. Shirai et al. reported that in patients, three parameters of X5, Fres, and ALX were found to significantly correlate with FEV1, implying that these three parameters are other markers of airway obstruction (Citation30), which is consistent with our findings. Because the conditions are dissimilar, there is no inevitable correlation between spirometry performed under effortful breathing and IOS performed under resting ventilation. Even under such dissimilar conditions, it is clinically significant to remember the relationship between the two tests. These results may provide hints for interpreting IOS in cases where spirometry cannot be performed due to old age or poor respiratory status.
The difference between inspiratory and expiratory phases (i.e. the difference in respiratory cycle dependence) was not analyzed in this study. In the colored 3D graphics displayed by IOS, the high peaks of Rrs and the deep valleys of Xrs indicate the existence of respiratory cycle dependence, which is reported to be more pronounced in COPD than in BA (Citation25,Citation31). In this study, cACO had a different IOS waveform than the other two, particularly in Xrs, the reactance, indicating the presence of respiratory cycle dependence. Asthma and COPD with peripheral airway obstruction have more pronounced expiratory airflow restriction than normal exhalation due to airway smooth muscle constriction, airway edema, elevated airway secretion, and airway wall remodeling, among other factors (Citation42).
We attempted to construct an ROC curve to see if cCVA and cBA could be differentiated by only IOS (data not shown), but we were unable to find useful parameters or cutoff values for diagnosis. According to previous reports, the ROC curve analyses revealed that the difference in X5 (cutoff value: 0.46 cmH2O/L/s) was the best predictor for FEV1 reversibility (Citation20). In another study in children, the ROC analysis showed that R5–R20 and ALX could discriminate controlled vs. uncontrolled asthma, suggesting the usefulness of the IOC for assessing asthma control (Citation43). Changes in Xrs, particularly ALX (ΔALX), had better diagnostic performance than changes in FEV1 or FeNO, according to a report analyzing airway reversibility testing and changes in IOS in adults (Citation44). However, the interpretation and application of IOS are still in confusion today. In this study, we were unable to demonstrate a unified view on whether IOS parameters could indicate peripheral airway stenosis. On the other hand, our findings show that the rate of change of IOS parameters is greater than that of FEV1 and flow–volume curves, and the color differences are visible and easy to understand visually. The bronchodilator response in visual images can be easily determined in the diagnosis of cCVA and intermittent or mild cBA, indicating that IOS is useful as a support for the diagnosis of asthmatic cough.
Conclusion
The difference in ΔFEV1 between cBA and cCVA was significant, but there was no difference in ΔPEF, ΔV50, or ΔV25. Except for R20, significant differences were found between the three groups in IOS, suggesting that IOS is a useful test method for disease differentiation. The cCVA and cBA demonstrated similar peripheral airway responses to SABA in IOS, which were considered to be commensurate with changes in V50 and V25. The cACO was characterized by a downward waveform of Xrs in IOS that improved slightly with SABA. FEV1/FVC, %FEV1, and %V25 were found to have relatively strong correlations with IOS parameters, X5, Fres, and ALX. IOS parameter changes are more sensitive than FEV1 or flow–volume curve changes. Considering the benefits and relevance of the two different tests, simultaneous IOS and spirometry testing were useful in the diagnosis of asthmatic cough.
Acknowledgements
The authors would like to thank MARUZEN-YUSHODO Co., Ltd. (https://kw.maruzen.co.jp/kousei-honyaku/) for the English language editing.
Declaration of interest
The authors have no conflicts of interest directly relevant to the content of this article.
Funding
No specific funding was received for this article.
References
- Song WJ, Chang YS, Faruqi S, Kim JY, Kang MG, Kim S, Jo EJ, Kim MH, Plevkova J, Park HW, et al. The global epidemiology of chronic cough in adults: a systematic review and meta-analysis. Eur Respir J 2015;45(5):1479–1481. doi:10.1183/09031936.00218714. Cited in: PMID: 25657027.
- Niimi A, Ohbayashi H, Sagara H, Yamauchi K, Akiyama K, Takahashi K, Inoue H, Wakayama T, Kobayashi H, Hasegawa M, et al. Cough variant and cough-predominant asthma are major causes of persistent cough: a multicenter study in Japan. J Asthma 2013;50(9):932–937. doi:10.3109/02770903.2013.823444. Cited in: PMID: 23841529.
- Morice AH, Millqvist E, Bieksiene K, Birring SS, Dicpinigaitis P, Ribas CD, Boon MH, Kantar A, Lai K, Lorcan MG, et al. ERS guidelines on the diagnosis and treatment of chronic cough in adults and children. Eur Respir J 2020;55(1):1901136. Cited in: PMID: 31515408. doi:10.1183/13993003.01136-2019.
- Cote A, Russell RJ, Boulet LP, Gibson PG, Lai K, Irwin RS, Brightling CE, CHEST Expert Cough Panel. Managing chronic cough due to asthma and NAEB in adults and adolescents: CHEST guideline and expert panel report. Chest 2020;158(1):68–96. doi:10.1016/j.chest.2019.12.021. Cited in: PMID: 31972181.
- Irwin RS, French CT, Smyrnios NA, Curley FJ. Interpretation of positive results of a methacholine inhalation challenge and 1 week of inhaled bronchodilator use in diagnosing and treating cough-variant asthma. Arch Intern Med 1997;157(17):1981–1987. doi:10.1001/archinte.1997.00440380091009. Cited in: PMID: 9308510.
- Mukae H, Kaneko T, Obase Y, Shinkai M, Katsunuma T, Takeyama K, Terada J, Niimi A, Matsuse H, Yatera K, et al. The Japanese respiratory society guidelines for the management of cough and sputum (digest edition). Respir Investig 2021;59(3):270–290. doi:10.1016/j.resinv.2021.01.007. Cited in: PMID: 33642231.
- Niimi A, Amitani R, Suzuki K, Tanaka E, Murayama T, Kuze F. Eosinophilic inflammation in cough variant asthma. Eur Respir J 1998;11(5):1064–1069. doi:10.1183/09031936.98.11051064. Cited in: PMID: 9648956.
- Fujimura M, Sakamoto S, Matsuda T. Bronchodilator-resistive cough in atopic patients: bronchial reversibility and hyperresponsiveness. Intern Med 1992;31(4):447–452. doi:10.2169/internalmedicine.31.447. Cited in: PMID: 1352997.
- Wang Y, Zhao L, Chen F, Guo Y, Ma H, Han B, Yi J, Kong X. Diagnostic value of fractional exhaled nitric oxide and small airway function in differentiating cough-variant asthma from typical asthma. Can Respir J 2021;2021:9954411. doi:10.1155/2021/9954411. Cited in: PMID: 34457097.
- Irwin RS, Baumann MH, Bolser DC, Boulet LP, Braman SS, Brightling CE, Brown KK, Canning BJ, Chang AB, Dicpinigaitis PV, et al. Diagnosis and management of cough executive summary: ACCP evidence-based clinical practice guidelines. Chest 2006;129(1):1S–23S. doi:10.1378/chest.129.1_suppl.1S. Cited in: PMID: 16428686.
- Achilleos A. Evidence-based evaluation and management of chronic cough. Med Clin North Am 2016;100(5):1033–1045. doi:10.1016/j.mcna.2016.04.008. Cited in: PMID: 27542423.
- Coates AL, Wanger J, Cockcroft DW, Culver BH, Carlsen KH, Diamant Z, Gauvreau G, Hall GL, Hallstrand TS, Horvath I, et al. ERS technical standard on bronchial challenge testing: general considerations and performance of methacholine challenge tests. Eur Respir J 2017;49(5):1601526. Cited in: PMID: 28461290. doi:10.1183/13993003.01526-2016.
- Global Initiative for Chronic Obstructive Lung Disease (GOLD). Global strategy for the diagnosis, management, and prevention of chronic obstructive pulmonary disease. NHLBI/WHO Workshop Report [Internet]. Updated 2020. [cited 2021 August 28]. Available from: https://goldcopd.org
- Fujino N, Sugiura H. ACO (Asthma-COPD Overlap) is independent from COPD, a case in favor: A systematic review. Diagnostics (Basel) 2021;11(5):859. Cited in: PMID: 34064650. doi:10.3390/diagnostics11050859.
- Kalchiem-Dekel O, Hines SE. Forty years of reference values for respiratory system impedance in adults: 1977–2017. Respir Med 2018;136:37–47. doi:10.1016/j.rmed.2018.01.015. Cited in: PMID: 29501245.
- Porojan-Suppini N, Fira-Mladinescu O, Marc M, Tudorache E, Oancea C. Lung function assessment by impulse oscillometry in adults. Ther Clin Risk Manag 2020;16:1139–1150. Cited in: PMID: 33273817. doi:10.2147/TCRM.S275920.
- Oostveen E, MacLeod D, Lorino H, Farré R, Hantos Z, Desager K, Marchal F, ERS Task Force on Respiratory Impedance Measurements. The forced oscillation technique in clinical practice: methodology, recommendations and future developments. Eur Respir J 2003;22(6):1026–1041. doi:10.1183/09031936.03.00089403. Cited in: PMID: 14680096.
- Peslin R, Duvivier C, Gallina C, Cervantes P. Upper airway artifact in respiratory impedance measurements. Am Rev Respir Dis 1985;132(3):712–714. doi:10.1164/arrd.1985.132.3.712. Cited in: PMID: 4037543.
- Cauberghs M, Van de Woestijne KP. Effect of upper airway shunt and series properties on respiratory impedance measurements. J Appl Physiol (1985) 1989;66(5):2274–2279. doi:10.1152/jappl.1989.66.5.2274. Cited in: PMID: 2745290.
- Shirai T, Kurosawa H. Clinical application of the forced oscillation technique. Intern Med 2016;55(6):559–566. doi:10.2169/internalmedicine.55.5876. Cited in: PMID: 26984069.
- King GG, Bates J, Berger KI, Calverley P, de Melo PL, Dellacà RL, Farré R, Hall GL, Ioan I, Irvin CG, et al. Technical standards for respiratory oscillometry. Eur Respir J 2020;55(2):1900753. Cited in: PMID: 31772002. doi:10.1183/13993003.00753-2019.
- Watts JC, Farah CS, Seccombe LM, Handley BM, Schoeffel RE, Bertolin A, Dame Carroll J, King GG, Thamrin C. Measurement duration impacts variability but not impedance measured by the forced oscillation technique in healthy, asthma and COPD subjects. ERJ Open Res 2016;2(2):00094-2015–7. Cited in: PMID: 27730194. doi:10.1183/23120541.00094-2015.
- Tanaka H, Hozawa S, Kitada J, Fujii M. Impulse oscillometry; therapeutic impacts of transdermal long-acting Beta-2 agonist patch in elderly asthma with inhaled corticosteroid alone. Allergol Int 2012;61(3):385–392. doi:10.2332/allergolint.12-RAI-0465. Cited in: PMID: 22824980.
- Kitaguchi Y, Yasuo M, Hanaoka M. Comparison of pulmonary function in patients with COPD, asthma-COPD overlap syndrome, and asthma with airflow limitation. COPD 2016;11:991–997. Cited in: PMID: 27274220. doi:10.2147/COPD.S105988.
- Shirai T, Mori K, Mikamo M, Shishido Y, Akita T, Morita S, Asada K, Fujii M, Suda T, Chida K. Usefulness of colored 3D imaging of respiratory impedance in asthma. Allergy Asthma Immunol Res 2013;5(5):322–328. doi:10.4168/aair.2013.5.5.322. Cited in: PMID: 24003390.
- Shiota S, Katoh M, Fujii M, Aoki S, Matsuoka R, Fukuchi Y. Predictive equations and the reliability of the impulse oscillatory system in Japanese adult subjects. Respirology 2005;10(3):310–315. doi:10.1111/j.1440-1843.2005.00703.x. Cited in: PMID: 15955143.
- Nakamura Y, Tamaoki J, Nagase H, Yamaguchi M, Horiguchi T, Hozawa S, Ichinose M, Iwanaga T, Kondo R, Nagata M, et al. Japanese guidelines for adult asthma 2020. Allergol Int 2020;69(4):519–548. doi:10.1016/j.alit.2020.08.001. Cited in: PMID: 32893125.
- Global Strategy for Asthma Management and Prevention. Global Initiative for Asthma [Internet]. Updated 2019. [cited 2021 August 28]. Available from: http://www.ginasthma.org
- Hashimoto S, Sorimachi R, Jinnai T, Ichinose M. Asthma and chronic obstructive pulmonary disease overlap according to the Japanese respiratory society diagnostic criteria: the prospective observational ACO Japan cohort study. Adv Ther 2021;38(2):1168–1184. doi:10.1007/s12325-020-01573-x. Cited in: PMID: 33355907.
- Shirai T, Mori K, Mikamo M, Shishido Y, Akita T, Morita S, Asada K, Fujii M, Suda T, Chida K. Respiratory mechanics and peripheral airway inflammation and dysfunction in asthma. Clin Exp Allergy 2013;43(5):521–526. doi:10.1111/cea.12083. Cited in: PMID: 23600542.
- Mori K, Shirai T, Mikamo M, Shishido Y, Akita T, Morita S, Asada K, Fujii M, Suda T, Chida K. Colored 3-dimensional analyses of respiratory resistance and reactance in COPD and asthma. COPD 2011;8(6):456–463. doi:10.3109/15412555.2011.626818. Cited in: PMID: 22149407.
- Graham BL, Steenbruggen I, Miller MR, Barjaktarevic IZ, Cooper BG, Hall GL, Hallstrand TS, Kaminsky DA, McCarthy K, McCormack MC, et al. Standardization of spirometry 2019 update. An official American thoracic society and European respiratory society technical statement. Am J Respir Crit Care Med 2019;200(8):e70–e88. doi:10.1164/rccm.201908-1590ST. Cited in: PMID: 31613151.
- Japanese guidelines for pulmonary function test -Spirometry, flow-volume curve, diffusion capacity of the lung. Committee of pulmonary physiology Japanese respiratory society. Tokyo Japan: Medical Review; 2004:12–19.
- American Thoracic Society/European Respiratory Society (ATS/ERS) recommendations for standardized procedures for the online and offline measurement of exhaled lower respiratory nitric oxide and nasal nitric oxide 2005. Am J Respir Crit Care Med 2005;171(8):912–930. doi:10.1164/rccm.200406-710ST.Cited in: PMID: 15817806.
- Desai U, Joshi JM. Impulse oscillometry. Adv Respir Med 2019;87(4):235–238. doi:10.5603/ARM.a2019.0039. Cited in: PMID: 31476011.
- Morice AH, Fontana GA, Sovijarvi ARA, Pistolesi M, Chung KF, Widdicombe J, O’Connell F, Geppetti P, Gronke L, De Jongste J, et al. The diagnosis and management of chronic cough. Eur Respir J 2004;24(3):481–492. doi:10.1183/09031936.04.00027804. Cited in: PMID: 15358710.
- Li JT, Pearlman DS, Nicklas RA, Lowenthal M, Rosenthal RR, Bernstein IL, Berger WE, Dykewicz MS, Fineman S, Lee RE, et al. Algorithm for the diagnosis and management of asthma: a practice parameter update: joint task force on practice parameters. Ann Allergy Asthma Immunol 1998;81(5):415–420. doi:10.1016/s1081-1206(10)63138-9. Cited in: PMID: 9860033.
- Löwhagen O. Diagnosis of asthma–new theories. J Asthma 2015;52(6):538–544. doi:10.3109/02770903.2014.991971. Cited in: PMID: 25478896.
- Romanet-Manent S, Charpin D, Magnan A, Lanteaume A, Vervloet D, EGEA Cooperative Group. Allergic vs nonallergic asthma: what makes the differences? Allergy 2002;57(7):607–613. doi:10.1034/j.1398-9995.2002.23504.x. Cited in: PMID: 12100301.
- Yamamura K, Hara J, Kobayashi T, Ohkura N, Abo M, Akasaki K, Nomura S, Yuasa M, Saeki K, Terada N, et al. The prevalence and clinical features of asthma-COPD overlap (ACO) definitively diagnosed according to the Japanese Respiratory Society Guidelines for the Management of ACO 2018. J Med Invest 2019;66(1.2):157–164. doi:10.2152/jmi.66.157. Cited in: PMID: 31064931.
- Desiraju K, Agrawal A. Impulse oscillometry: the state-of-art for lung function testing. Lung India 2016;33(4):410–416. doi:10.4103/0970-2113.184875. Cited in: PMID: 27578934.
- Shimoda T, Obase Y, Nagasaka Y, Kishikawa R, Iwanaga T. Lung sound analysis and the respiratory cycle dependence of impulse oscillometry in asthma patients. Intern Med 2019;58(1):47–52. doi:10.2169/internalmedicine.8226-16. Cited in: PMID: 30146613.
- Shi Y, Aledia AS, Tatavoosian AV, Vijayalakshmi S, Galant SP, George SC. Relating small airways to asthma control by using impulse oscillometry in children. J Allergy Clin Immunol 2012;129(3):671–678. doi:10.1016/j.jaci.2011.11.002. Cited in: PMID: 22178635.
- Watanabe H, Shirai T, Akamatsu T, Asada K, Hirai K. Forced oscillatory parameters in reversibility testing as predictors for chronic cough responsive to inhaled corticosteroid/long-acting beta2 agonist. Ann Allergy Asthma Immunol 2019;122(3):345346.e1–346.e1. doi:10.1016/j.anai.2018.10.008. Cited in: PMID: 30342091.