
Abstract
Objectives
Patients with asthma may feel limited in physical activity (PA). Reduced PA has been demonstrated in asthmatics versus healthy controls, and increasing PA associated with improved asthma outcomes. Obesity is commonly found with difficult-to-control asthma and worsens outcomes. We compared PA levels in participants with difficult-to-control asthma and elevated body mass index (BMI) (DOW group) and two mild-moderate asthma groups: one with BMI <25 kg/m2 (MHW) and one with BMI ≥25 (MOW).
Methods
This cross-sectional study used 7-day recordings from wrist-worn accelerometers to compare PA between groups. Inactive time, light (LPA), moderate-vigorous PA (MVPA) were measured, along with two novel metrics: intensity gradient (IG) reflecting PA intensity, and average acceleration (AA) reflecting PA volume. PA parameters were compared using ANOVA or Kruskall-Wallis testing. Correlation and linear regression analyses explored associations between PA parameters and asthma outcomes. As AA was the PA parameter correlated most closely with asthma-related outcomes, an exploratory analysis compared outcomes in highest and lowest AA quartiles.
Results
75 participants were recruited; 57 accelerometer readings were valid and included in analysis. Inactive time was significantly higher (p < 0.001), and LPA (p < 0.007), MVPA (p < 0.001), IG (p < 0.001) and AA (p < 0.001) all significantly lower in DOW versus MHW and MOW groups, even after adjusting for age and BMI. Quartiles based on AA had significantly different asthma profiles.
Conclusions
Overweight/obese participants with difficult-to-control asthma performed less PA, and activity of reduced intensity and volume. Increased AA is associated with improvement in several asthma-related outcomes. Increased PA should be recommended to relevant patients.
Introduction
Asthma is a common, heterogeneous condition which varies from mild with minimal impact on quality of life to difficult-to-control asthma with persistent symptoms and/or frequent exacerbations despite significant treatment (Citation1). Physical activity (PA) is associated with positive outcomes in adults including reduced risk of early mortality (Citation2). The World Health Organisation’s PA recommendations suggest adults should achieve ≥150 min of moderate intensity PA, or ≥75 min of vigorous PA each week (Citation3). Many individuals with asthma find that symptoms limit their participation in PA, particularly exertional breathlessness (Citation4,Citation5). A 2018 systematic review of 42 articles on asthma and PA demonstrated that participants with asthma performed less PA than healthy controls, and higher levels of PA were associated with better asthma control (Citation6). This review recommended looking more closely at links between inactive time and asthma control.
A recent cluster analysis of participants with clinically stable moderate-severe asthma identified phenotypes where increased sedentary time was associated with poorly controlled asthma, and increased PA levels with improved asthma control (Citation7). Other studies have demonstrated that individuals with severe asthma have reduced moderate-vigorous PA (MVPA) compared with healthy controls (Citation8,Citation9), but to our knowledge no previous studies have compared activity levels in asthmatics grouped by asthma severity and body mass index (BMI). In some studies, when BMI was considered as a confounding variable, links between PA and asthma were less or no longer significant (Citation10–12). This may suggest that obesity plays a bigger role than PA in asthma control, and should be considered along with PA and asthma. Obesity-associated asthma is a treatable trait, but treatment options are limited and management of obesity-associated asthma presents significant challenges. Identification of reduced PA in this group would allow development of an exercise intervention to target those most at need.
Most recent studies used accelerometers to record PA, but several (Citation7–9) used cut-points created on a different accelerometer model to that studied, which may render some of this data invalid (Citation13). The majority of studies recommended wearing devices during waking hours, which may lead to loss of data. In addition, comparison of PA studies is difficult because of different accelerometer models and methods of data analysis.
In this study our objective was to compare PA levels between groups with different degrees of asthma severity and body mass index, in order to try and determine whether these differences impacted on physical activity. Building on deficiencies in previous literature, we used appropriate cut-points for the accelerometer model, and collected data for 24h per day for a week to accurately quantify all PA. We also include average acceleration (AA) which reflects volume of PA and intensity gradient (IG) which reflects PA intensity. These novel metrics enable direct comparison with other studies reporting them, as cutpoints are not involved and use of different accelerometers does not affect data analysis. A secondary aim was to explore whether PA correlated with selected markers of asthma control, and if so, which PA parameters were most closely linked. We also wondered whether any PA outcomes could be used to independently predict asthma control.
We hypothesized that PA would be reduced in individuals with difficult-to-control asthma who were overweight when compared to those with milder asthma with healthy or elevated BMI and that this might identify a treatable trait for which specific targeted interventions could be developed. We also hypothesized that PA would correlate with markers of asthma control and severity, and that they may predict asthma outcomes.
Materials and methods
Study design
This was a cross-sectional study using accelerometers to compare activity levels across three groups: participants with mild-moderate asthma with BMI <25 kg/m2 (mild-moderate, healthy weight- MHW group), participants with mild-moderate asthma with elevated BMI (≥25) (mild-moderate, overweight- MOW group), and participants with difficult-to-control asthma with BMI ≥25 (difficult-to-control, overweight- DOW group). These groups were selected as we wished to explore the impact of both obesity and difficult-to-control asthma on activity levels.
The study was a substudy in a larger project registered at ClinicalTrials.gov (ID NCT03630432) and approved by the West of Scotland Regional Ethics Committee (REC reference 16/WS/0200). It took place between May 2017 and January 2020 in Glasgow Royal Infirmary. It was funded by a Chief Scientists Office/Asthma UK Innovation Grant 2018 (AUK/CSO/18/01).
Study populations
Participants were aged 18–80 years. The MHW and MOW groups were recruited from general practice. They had an asthma diagnosis recorded in medical notes and prescription of asthma medication within 12 months. They had an asthma control questionnaire-6 (ACQ6) ≤1.5, <2 systemic corticosteroid boosts and no asthma-related hospital admissions in the previous year. Maximum permitted treatment was medium dose inhaled corticosteroids (ICS) with long acting β2-agonists (LABA). General Practitioners identified potential candidates to whom study information packs were posted. Those responding were screened to confirm eligibility before arranging a study visit.
The DOW group comprised individuals attending the baseline, pre-intervention visit for a study evaluating the impact of pulmonary rehabilitation in adults with difficult-to-control asthma associated with obesity. Inclusion criteria included BMI ≥25 kg/m2, asthma with characteristic symptoms (Citation14) and either 200 mls and 12% improvement from baseline in forced expired volume in one second (FEV1) after either bronchodilator, anti-inflammatory medication or between visits; or positive bronchial challenge (PC20 methacholine or histamine <8 mg/ml or PD15 mannitol <635mg). Individuals were on at least high dose ICS and LABA and had difficult-to-control asthma (Citation1) defined as either ≥2 courses of prednisolone, or ≥1 hospital admission in the last 12 months, or ACQ6 of >1.5. Exclusion criteria included intensive care unit admission with asthma in previous 6 months, exacerbation requiring oral steroids and/or antibiotics within four weeks, significant co-morbidity or mobility problems, pregnancy/breastfeeding, or commencement of biologic therapy within 6 months.
Study measurements
Study participants had one single visit to the Clinical Research Facility. All participants gave written informed consent prior to commencement of the study. Data on demographics, medical history, medications and exacerbations was obtained through participant interview and review of electronic records. Several questionnaires were completed including asthma quality of life questionnaire (AQLQ) (Citation15) and asthma control questionnaire-6 (ACQ6) (Citation16).
Height and weight were measured, and BMI calculated. Participants performed fraction of exhaled nitric oxide (FeNO) using a NIOX VERO machine (Circassia Pharmaceuticals Inc, Morrisville, USA) and peak expiratory flow rate (PEFR). Spirometry was performed before and 15 min after 400 mcg of inhaled salbutamol using an electronic spirometer (Vitalograph, Maids Moreton, UK). A blood sample was taken for blood eosinophil count. Two 6-minute walk tests (6MWT) were performed as per American Thoracic Society guidelines (Citation17), with the furthest distance used for analysis. Borg scale (Citation18) for breathlessness on completion of the furthest walk was recorded.
Accelerometry
Each participant was asked to wear an ActiGraph wGTX3-BT (ActiGraph, Pensacola, FL, USA) accelerometer on their non-dominant wrist continually for seven days (except when bathing or swimming). Participants verbally confirmed their non-dominant wrist and were then shown how to fit the accelerometer. Prior to distribution, the accelerometers were initialized to capture data at 30 Hz and programmed to commence data collection immediately after distribution.
Devices were returned after one week, and data downloaded using ActiLife software (v.6.14.3; ActiGraph) and saved in raw format as .gt3x files. Files were then converted to time-stamp free .csv files, which were subsequently exported into R v3.6.3 (R Foundation for Statistical Computing, Vienna, Austria) for processing using the GGIR package (v2.1.0) (Citation19). Processing the files in GGIR involves the detection of non-wear time, abnormally high values and auto-calibrates the raw triaxial accelerometer signals using local gravity as a reference (Citation20). The GGIR package then calculated Euclidean Norm Minus One (ENMO) (1 g) averaged over 5-s epochs, expressed in milli-gravitational (mg) units as described elsewhere (Citation19).
Participants were excluded from subsequent analyses if their accelerometer files demonstrated a post-calibration error was >0.01 g, there were <4 days (defined as ≥16 h per day) of valid wear (Citation25) including at least 1 weekend day, or wear data was not present for each 15-min period of the 24-h cycle. The non-wear accelerometer setting was used which meant that invalid data were imputed by the average at similar time-points on different days of the week (Citation8). This allowed for outcome variables to be calculated based on the entire 24-h cycle.
Once the included participant files were processed in GGIR, PA outcomes were provided. These included inactive time which was defined as time accumulated below an acceleration of 30 mg, with light (LPA) defined as time spent between 30–99 mg (Citation21). MVPA was defined as time accumulated above an acceleration of 99 mg (Citation22). We also expressed PA as average acceleration (AA, ENMO, mg) which provides a measure of the volume of activity undertaken throughout the day, and through the intensity gradient (IG) which describes the intensity distribution of accelerations across the monitoring period (Citation23). The IG reflects the negative curvilinear relationship between intensity and time accumulated in that intensity and is always negative. A lower IG reflects less time in increasing intensity (Citation23,Citation24). The IG was calculated and generated in GGIR (argument IG levels = TRUE) following the same procedures as described elsewhere (Citation25). To facilitate replication of our methodology, the online supplement provides the config.csv files used as input to GGIR and contains all argument files used in processing. Together, the IG and AA provide a measure of the volume and intensity of activity undertaken throughout the monitoring period and importantly use all the acceleration data collected. Including these two metrics (the IG and AA) allow for subsequent analysis to explore whether they were associated with ACQ6 and AQLQ, and whether these associations were independent of one another. In doing so, we may be able to identify which metric is more important for improving ACQ6 and AQLQ which could inform future interventions.
Statistical analysis
Results are expressed as mean ± SD, mean (95% CI), median (IQR) or numbers and proportions. D’Agostino-Pearson testing was used to determine normality. Comparisons between the three groups (MHW, MOW and DOW) were made using one-way ANOVA for normally distributed data, with Tukey’s multiple comparisons test, or Kruskal-Wallis with Dunn’s multiple comparison test for skewed data. Chi-square test was used to compare proportions, with Kruskal-Wallis used where small values invalidated Chi-square.
Analysis of covariance was performed on all activity parameters, using age and BMI as covariates. Correlation analysis assessed associations between activity metrics and selected asthma measures, to try and determine whether PA reflected asthma control. Simple and multiple linear regression were performed using ACQ6 and AQLQ as dependent variables and each PA parameter in turn as independent variables. For multiple linear regression, age, gender and BMI were added to the models as potential confounders. Regression analyses aimed to assess whether PA parameters could predict asthma outcomes.
Participants were divided into quartiles based on AA recordings, and asthma measures were compared between highest and lowest quartiles using unpaired t and Mann-Whitney U tests depending on normality. A p values of <0.05 was considered to be statistically significant. Statistical tests were performed using GraphPad Prism v9 (GraphPad Software, San Diego California, USA) and Minitab Statistical Software (Minitab LLC, Pennsylvania, USA).
Results
A total of 75 participants were recruited, 25 per group. Baseline characteristics are shown in . Median age was higher in the overweight groups- median (IQR): 38(27–62) in MHW, 62(54–67) in MOW and 57(48–63) years in DOW, p < 0.001. Median (IQR) BMI was significantly different, in part due to study design: MHW group 23.2(21.7 − 24) kg/m2, MOW 29(27 − 32) and DOW 36.2(33 − 40.3), p < 0.001.
Table 1. Baseline characteristics of groups.
Co-morbidities were more prevalent in the DOW group as seen in table one, including: GORD (16% MHW, 52% MOW, 88% DOW, p < 0.001), psychological illness (24% MHW, 24% MOW, 64% DOW, p = 0.003) and osteoporosis. As anticipated, asthma treatment burden was significantly higher in DOW group, with beclomethasone diproprionate (BDP)-equivalent inhaled steroid dose mean (95% CI) MHW 420 (280–560), MOW 536 (418–653), DOW 1904 (1729–2079), p < 0.001. In addition other asthma treatments were prescribed in the DOW group but not other groups: LAMA (92%), maintenance prednisolone (48%), omalizumab (24%), and mepolizumab (8%). Asthma exacerbations were more frequent in DOW group, whether measured by annualized prednisolone boosts (median (IQR) 0 (0–1) MHW, 0 (0–0) MOW and 3 (2–5) DOW, p < 0.001) or GP attendances (median (IQR) 0 (0–1) MHW, 0 (0–0) MOW and 1 (0–3) DOW, p = 0.005).
For MHW, MOW and DOW groups, respectively, median (IQR) for ACQ6 was 0.5 (0–0.8), 0.3 (0.2–0.7) and 2.8 (1.85–3.3), p < 0.001. Blood eosinophils and FeNO were not significantly different between groups but peak flow (p = 0.011), pre-bronchodilator FEV1% predicted (p < 0.001) and FEV1/FVC (forced vital capacity) ratio (p = 0.007) were all significantly lower in the DOW group.
Accelerometer results
The processing criteria left 57 valid recordings for analysis: 15 in MHW group, 17 in MOW and 25 in DOW. Results are displayed in and and .
Figure 1. Time spent in activity thresholds. Bar chart showing mean and 95% confidence intervals for inactive time, light and moderate-vigorous physical activity across the three groups. Annotations display p values between groups when Tukey’s multiple comparisons tests are performed.
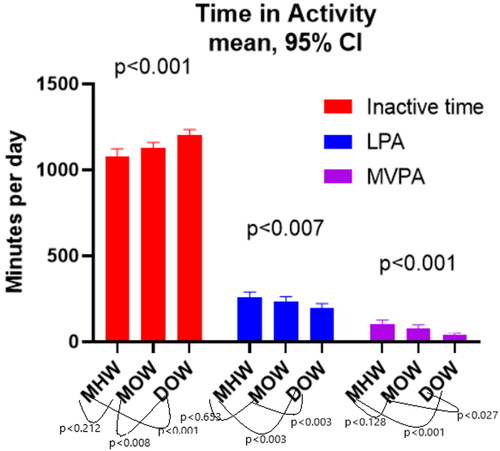
Figure 2. Average acceleration and intensity gradient results. Bar charts showing a) average acceleration and b) intensity gradient across the three groups. Annotations display p values between groups when multiple comparisons testing is performed using Dunn’s multiple comparison tests.
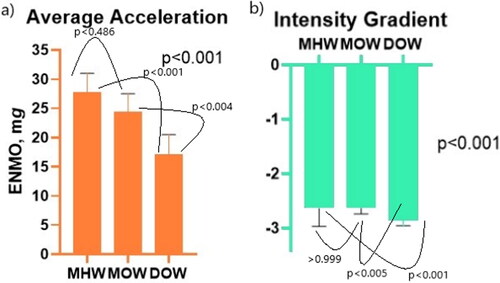
Table 2. Accelerometer results.
There were significant differences for time spent in each PA category. Inactive time was mean (95% CI) 1079 (1037–1122) minutes per day (min.d − 1) in MHW, 1128 (1094–1161) in MOW and 1202 (1170–1234) in DOW, p < 0.001. LPA in MHW was mean (95% CI) 259 (228–289) min.d − 1, in MOW 237 (212–263) and 196 (171–222) in DOW, p = 0.007. For MVPA mean (95% CI) was 103 (80–127) min.d − 1 in MHW, 79 (58–99) in MOW and 42 (33–52) in DOW, p < 0.001. When multiple comparisons testing was performed, there was no significant difference between MHW and MOW groups (inactive time p < 0.212, LPA p < 0.653 and MVPA p < 0.128) but there was between MHW and DOW (inactive time p < 0.001), LPA p < 0.003 and MVPA p < 0.001) and MOW and DOW (inactive time p < 0.008, LPA p < 0.033 and MVPA p < 0.027).
Median (IQR) for MHW, MOW and DOW, respectively were: intensity gradient −2.63 (-2.97 to −2.33), −2.62 (-2.74 to −2.55), and −2.85 (-2.96 to −2.73), p < 0.001; and average acceleration 27.8 (21.7–31.0) mg.d, 24.4 (20.4–27.5) and 17.1 (13.7–20.5), p < 0.001. Again, when multiple comparisons testing was performed, there was no significant difference between MHW and MOW groups (IG p > 0.999, AA p < 0.486), but there was between MHW and DOW (IG p < 0.001, AA p < 0.001), and MOW and DOW (IG p < 0.005, AA p < 0.004).
At baseline, there were significant differences in age and BMI between groups, but results remained significant after correcting for age and BMI in analysis of covariance.
Correlation analysis
Correlation analyses investigated possible associations between PA parameters and selected asthma measures (). The asthma outcome measures selected covered asthma control/quality of life scores, use of healthcare, biomarkers, treatment burden and asthma severity. AQLQ and ACQ6 both correlated with all activity parameters. 6MWD was most closely correlated with markers of activity: inactive time r=-0.569, p < 0.001, LPA r = 0.394, p < 0.002, MVPA r = 0.680, p < 0.001, IG r = 0.690 p < 0.001 and AA r = 0.719, p < 0.001. For the majority of the correlation analyses with significant p values, the correlation co-efficients did not suggest strong correlation.
Table 3. Correlations of PA parameters and relevant asthma measures.
Of the five activity parameters, AA was most closely correlated with asthma measures. We therefore compared the highest and lowest AA quartiles (). The highest quartile comprised nine participants from MHW group and five from MOW. The lowest quartile comprised two from MOW and twelve from DOW group. In highest and lowest AA quartiles, respectively: BMI mean (SD) was 24.3 (2.3) kg/m2 vs. 37.5 (7.3), p < 0.001; BDP dose was 479 (345) mcg vs. 1179 (569), p < 0.001; annual prednisolone boosts were 0 (0–0.3) vs. 2 (0.8–5.5), p < 0.001. ACQ6 was 0.5 (0.4) vs. 2.4 (1.3), p < 0.001 and AQLQ was 6.3 (0.6) vs. 4.2 (1.6), p = 0.001.
Table 4. Comparison of highest and lowest quartiles based on average acceleration.
Regression analysis
Regression analysis assessed whether PA parameters could be used to predict ACQ6 or AQLQ, i.e. whether PA predicted asthma control or quality of life. In univariate linear regression (), all PA parameters were significantly predictive of ACQ6 and AQLQ to a small degree.
Table 5. Simple linear regression results.
In multiple linear regression models incorporating age, gender and BMI as additional independent variables; inactive time, MVPA, IG and AA remained significantly predictive of ACQ and AQLQ to a small degree but there was no significant association with LPA (). There was no evidence of multicollinearity.
Table 6. Multiple linear regression results. ACQ and AQLQ as dependent variables with PA parameter plus BMI, age and gender as independent variables.
Discussion
This cross-sectional study was designed to compare PA levels of individuals with difficult-to-control asthma associated with elevated BMI (DOW group) to two control groups of individuals with mild-moderate asthma and either healthy (MHW) or elevated (MOW) BMI. We demonstrated the DOW group had significantly more inactive time and less time engaged in PA than the control groups, even when corrected for both age and BMI. Correspondingly, both intensity and volume of PA were lower in DOW group. To our knowledge this is the first time IG and AA have been recorded in these populations. AA correlated quite closely with asthma control and quality of life.
Other studies have measured PA in asthmatics using accelerometry, but not in phenotypes distinguished by both BMI and asthma severity. Neither have AA nor IG been measured previously. As such, previous studies are not directly comparable to ours. One cross-sectional study used hip-worn accelerometers and measured PA in participants with severe asthma along with age and gender-matched healthy controls (Citation8). After adjusting for smoking status and BMI, the severe asthma group completed almost 20 fewer minutes MVPA per day than controls (p < 0.001) but mean (95% CI) 22(2–41) minutes more LPA per day than the control group, p = 0.029. They did not find differences in sedentary time between groups, thus results are quite different from ours.
Another cross-sectional study looked at groups with mild-moderate (n = 83) and severe (n = 63) asthma and healthy controls (n = 29) and measured PA with arm-worn accelerometers (Citation26). Moderate activity was lowest in the severe asthma group with median of 125 (68–172) minutes per day, compared to 151 (99–197) in mild-moderate asthma and 163 in healthy controls, p < 0.05, all a lot higher than our MVPA results.
A third study compared activity levels of severe asthmatics (n = 48) with healthy controls (n = 48) using arm-worn accelerometers (Citation9). BMI was significantly higher in the asthma group (33 ± 6.7 kg/m2) compared to control (26.4 ± 4.4), p < 0.001. Mean FEV1 was 71.2 ± 20.1% predicted in the severe asthma group compared to median (IQR) 66.4(59–74)% in our corresponding group. Wear time was significantly lower in the severe asthma group and once this and differences in BMI between groups were accounted for, the severe asthma group did fewer steps per day (p = 0.009) but there was no significant difference in total MVPA or stationary time. Total time spent in MVPA in the asthma group was similar to time our study at 44 (±46) minutes per day, with 91 (±80) minutes in the control group, although as previously mentioned, the number of minutes are not directly comparable due to different monitors and methods of data analysis.
We found time spent in MVPA was markedly reduced in DOW group with median (IQR) of 42 (33–52) minutes compared to almost double in MOW group 79 (58–99) minutes and almost 2.5 times in MHW group 103 (80–127) minutes, p < 0.001. Differences in other parameters were less dramatic, but across all PA parameters the DOW group were significantly less active. These findings fit with previous studies, but we have extended observations by comparing groups based on BMI and asthma severity. When individual groups were compared, differences between MHW and MOW groups were not significant (inactive time p0.064, LPA p = 0.251 and MVPA p = 0.097), but differences between MHW/DOW and MOW/DOW groups were significant. This may suggest that degree of asthma severity is more important in determination of PA. We cannot infer from our data whether difficult-to-control asthma is a cause or an effect of this. However, since age and BMI corrected results were significantly different between the difficult-to-control asthma group and the two mild asthma groups, asthma severity may be more closely linked to activity.
In correlation analysis, asthma control (ACQ6) and quality of life (AQLQ) were both significantly associated with all PA parameters with both improving with increasing activity. Other markers of asthma control including number of exacerbations requiring prednisolone were similarly correlated, as was exercise tolerance (measured by 6MWT) and perception of exertional breathlessness (measured by Borg score post-6MWT). This suggest that participants with lower BMI, better asthma control, less frequent exacerbations, and less severe asthma (higher pre-BD FEV1) are more physically active. We should therefore encourage increased PA as part of routine asthma management, particularly in difficult-to-control obese asthmatics.
Group selection criteria led to many significant differences between groups at baseline, including treatments, co-morbidity and age. We corrected results using age and BMI as covariates, but differences between groups remained. A number of baseline differences are directly due to recruitment criteria (BMI) and several others are features of difficult-to-control asthma e.g. co-morbidities and increasing treatment burden. As such the differences between groups were mostly anticipated and may help explain reasons behind differing activity levels.
Once accelerometer readings were processed, a number were excluded based on pre-determined criteria to allow accurate comparison. This unfortunately meant we lost more readings from the MHW/MOW groups. It is possible that this may have led to less robust findings. However, our strict inclusion criteria mean our data is reflective of complete 24-h cycles, whereas in other studies using shorter wear times large amounts of data could be missing. Compliance in our study was good, with only 8 recordings excluded due to insufficient wear time, comparable to similar studies of healthy adults. Overall therefore, we can be confident in the robustness of our data.
Another possible limitation was wrist placement of devices, which reduced the comparability of our data with other studies. It is important that readers are aware that the values reported in this paper are wear location specific and should not be compared to values provided from different wear locations. However, inclusion of IG and AA mean our data can be compared to future studies reporting them. In addition, wrist placement meant we were unable to obtain reliable step counts or separate moderate from vigorous PA, but we felt wrist placement would improve compliance which was high.
Conclusions
This cross-sectional study demonstrated that time, intensity and volume of PA were all significantly lower in overweight participants with difficult-to-control asthma compared with healthy weight and overweight participants with mild-moderate asthma, and these differences persisted when age and BMI were considered as confounding variables. Average acceleration is a novel accelerometry-based biomarker reflecting volume of PA and correlates with asthma control and quality of life. Measurement of AA and increasing volume of PA may have a role in targeting exercise/activity programmes to individuals with obesity and difficult-to-control asthma who are most likely to benefit from this intervention.
STROBE-checklist-v4-completed.doc
Download MS Word (88.5 KB)Acknowledgements
We would like to thank the patients who consented to take part in this study.
Disclosure statement
HCR, DSB, FS, JSB and DCC have no conflicts of interest with regards to this manuscript. RC has received grants from Astra-Zeneca for being an investigator on an MRC study, payments from GSK, AstraZeneca, Teva, Chiesi for lecturing, support from Teva, Chiesi, Napp Sanofi, Boehringer for attending conferences and from GSK, AstraZeneca, Teva, Chiesi, Novartis for advisory board meetings.
Additional information
Funding
References
- British Thoracic Society and Scottish Intercollegiate Guidelines Network. Sign 158: British guideline on the management of asthma. Thorax 2019;1–214.
- Ekelund U, Tarp J, Steene-Johannessen J, Hansen BH, Jefferis B, Fagerland MW, Whincup P, Diaz KM, Hooker SP, Chernofsky A, et al. Dose-response associations between accelerometry measured physical activity and sedentary time and all cause mortality: Systematic review and harmonised meta-analysis. BMJ. 2019;366:l4570. doi:10.1136/bmj.l4570.
- Bull FC, Al-Ansari SS, Biddle S, Borodulin K, Buman MP, Cardon G, Carty C, Chaput J-P, Chastin S, Chou R, et al. World Health Organization 2020 guidelines on physical activity and sedentary behaviour. Br J Sports Med. 2020;54(24):1451–1462. doi:10.1136/bjsports-2020-102955.
- Dockrell M, Partridge MR, Valovirta E. The limitations of severe asthma: The results of a European survey. Allergy Eur J Allergy Clin Immunol. 2007;62(2):134–141. doi:10.1111/j.1398-9995.2006.01304.x.
- Shim YM, Burnette A, Lucas S, Herring RC, Weltman J, Patrie JT, Weltman AL, Platts-Mills TA. Physical deconditioning as a cause of breathlessness among obese adolescents with a diagnosis of asthma. PLoS One. 2013;8(4):e61022–e61022. doi:10.1371/journal.pone.0061022.
- Cordova-Rivera L, Gibson PG, Gardiner PA, McDonald VM. A systematic review of associations of physical activity and sedentary time with asthma outcomes. J Allergy Clin Immunol Pract. 2018;6(6):1968–1981.e2. doi:10.1016/j.jaip.2018.02.027.
- Freitas PD, Xavier RF, McDonald VM, Gibson PG, Cordova-Rivera L, Furlanetto KC, de Oliveira JM, Carvalho-Pinto RM, Cukier A, Stelmach R, et al. Identification of asthma phenotypes based on extrapulmonary treatable traits. Eur Respir J. 2020;57:2000240. doi:10.1183/13993003.00240-2020.
- Cordova-Rivera L, Gibson PG, Gardiner PA, Powell H, McDonald VM. Physical activity and exercise capacity in severe asthma: key clinical associations. J Allergy Clin Immunol Pract. 2018;6(3):814–822. doi:10.1016/j.jaip.2017.09.022.
- Neale J, Orme MW, Majd S, Chantrell S, Singh SJ, Bradding P, Green RH, Evans RA. A comparison of daily physical activity profiles between adults with severe asthma and healthy controls. Eur Respir J. 2020;56(1):1902219–1902211. doi:10.1183/13993003.02219-2019.
- Westermann H, Choi TN, Briggs WM, Charlson ME, Mancuso CA. Obesity and exercise habits of asthmatic patients. Ann Allergy. Asthma, Immunol. 2008;101(5):488–494. http://ovidsp.ovid.com/ovidweb.cgi?T=S&CSC=Y&NEWS=N&PAGE=fulltext&D=medc&AN=19055202
- Bacon SL, Lemiere C, Moullec G, et al. Association between patterns of leisure time physical activity and asthma control in adult patients. BMJ Open Respir Res. 2015;2:1–7. doi:10.1136/bmjresp-2015-000083.
- Russell MA, Janson C, Real FG, Johannessen A, Waatevik M, Benediktsdóttir B, Holm M, Lindberg E, Schlünssen V, Raza W, et al. Physical activity and asthma: a longitudinal and multi-country study. J Asthma. 2017;54(9):938–945. doi:10.1080/02770903.2017.1281293.
- Migueles JH, Cadenas-Sanchez C, Ekelund U, Delisle Nyström C, Mora-Gonzalez J, Löf M, Labayen I, Ruiz JR, Ortega FB. Accelerometer data collection and processing criteria to assess physical activity and other outcomes: a systematic review and practical considerations. Sports Med. 2017;47(9):1821–1845. doi:10.1007/s40279-017-0716-0.
- Global Initiative for Asthma. Global Strategy for Asthma Management and Prevention (2018 Update). 2018. www.ginasthma.org.
- Juniper EF, Guyatt GH, Ferrie PJ, Griffith LE. Measuring quality of life in asthma. Am Rev Respir Dis. 1993;147(4):832–838. Published Online First: doi:10.1164/ajrccm/147.4.832.
- Juniper EF, O′byrne PM, Guyatt G, Ferrie P, King D. Development and validation of a questionnaire to measure asthma control. Eur Respir J. 1999;14(4):902–907. doi:10.1034/j.1399-3003.1999.14d29.x.
- American Thoracic Society. American Thoracic Society ATS Statement: Guidelines for the Six-Minute Walk Test. 2002. 166:111–7. doi:10.1164/rccm.166/1/111.
- Mahler DA, Horowitz MB. Perception of breathlessness during exercise in patients with respiratory disease. Med Sci Sports Exerc. 1994;September:1078–1081.
- Migueles JH, Rowlands AV, Huber F, Sabia S, van Hees VT. GGIR: a research community–driven open source r package for generating physical activity and sleep outcomes from multi-day raw accelerometer data. J Meas Phys Behav. 2019;2(3):188–196. doi:10.1123/jmpb.2018-0063.
- van Hees VT, Fang Z, Langford J, Assah F, Mohammad A, da Silva ICM, Trenell MI, White T, Wareham NJ, Brage S, et al. Autocalibration of accelerometer data for free-living physical activity assessment using local gravity and temperature: an evaluation on four continents. J Appl Physiol. 2014;117(7):738–744. doi:10.1152/japplphysiol.00421.2014.
- Bakrania K, Yates T, Rowlands AV, Esliger DW, Bunnewell S, Sanders J, Davies M, Khunti K, Edwardson CL. Intensity thresholds on raw acceleration data: euclidean norm minus One (ENMO) and mean amplitude deviation (MAD) approaches. PLoS One. 2016;11(10):e0164045. doi:10.1371/journal.pone.0164045.
- Hildebrand M, Van Hees VT, Hansen BH, Ekelund ULF. Age group comparability of raw accelerometer output from wrist- and hip-worn monitors. Med Sci Sports Exerc. 2014;46(9):1816–1824. doi:10.1249/MSS.0000000000000289.
- Rowlands AV. Moving forward with accelerometer-assessed physical activity: Two strategies to ensure meaningful, interpretable, and comparable measures. Pediatr Exerc Sci. 2018;30(4):450–456. doi:10.1123/pes.2018-0201.
- Buchan DS, McLellan G, Donnelly S, Arthur R. The use of the intensity gradient and average acceleration metrics to explore associations with BMI z-score in children. J Sports Sci. 2019;37(23):2751–2758. doi:10.1080/02640414.2019.1664536.
- Rowlands AV, Edwardson CL, Davies MJ, Khunti K, Harrington DM, Yates TOM. Beyond cut points: accelerometer metrics that capture the physical activity profile. Med Sci Sports Exerc. 2018;50(6):1323–1332. doi:10.1249/MSS.0000000000001561.
- Bahmer T, Waschki B, Schatz F. Physical activity, airway resistance and small airway dysfunction in severe astha. Eur. Respir. J. 2017; 49. doi:10.1183/13993003.01827-2016.