
Abstract
Objective
At present, targeting molecular-pharmacological therapy is still difficult in neutrophilic asthma. The investigation aims to identify and validate mitochondrion-related gene signatures for diagnosis and specific targeting therapeutics in neutrophilic asthma.
Methods
Bronchial biopsy samples of neutrophilic asthma and healthy people were identified from the GSE143303 dataset and then matched with human mitochondrial gene data to obtain mitochondria-related differential genes (MitoDEGs). Signature mitochondria-related diagnostic markers were jointly screened by support vector machine (SVM) analysis, least absolute shrinkage, and selection operator (LASSO) regression. The expression of marker MitoDEGs was evaluated by validation datasets GSE147878 and GSE43696. The diagnostic value was evaluated by receiver operating characteristic (ROC) curve analysis. Meanwhile, the infiltrating immune cells were analyzed by the CIBERSORT. Finally, oxidative stress level and mitochondrial functional morphology for asthmatic mice and BEAS-2B cells were evaluated. The expression of signature MitoDEGs was verified by qPCR.
Results
67 MitoDEGs were identified. Five signature MitoDEGs (SOD2, MTHFD2, PPTC7, NME6, and SLC25A18) were further screened out. The area under the curve (AUC) of signature MitoDEGs presented a good diagnostic performance (more than 0.9). There were significant differences in the expression of signature MitoDEGs between neutrophilic asthma and non-neutrophilic asthma. In addition, the basic features of mitochondrial dysfunction were demonstrated by in vitro and in vivo experiments. The expression of signature MitoDEGs in the neutrophilic asthma mice presented a significant difference from the control group.
Conclusions
These MitoDEGs signatures in neutrophilic asthma may hold potential as anchor diagnostic and therapeutic targets in neutrophilic asthma.
Introduction
Asthma is a chronic and complicated inflammatory disease that affects more than 300 million people globally (Citation1). Over the years, suppressing airway inflammation with inhaled corticosteroids is still considered to be a key therapeutic approach for asthma (Citation2,Citation3). Type 2-high and type 2-low airway inflammation endotypes are the two subtypes of asthma. Compared to type 2-high asthma, type 2-low asthma exhibited a poorly anti-inflammatory feature of corticosteroids, which can be further divided into neutrophilic asthma and paucigranulocytic asthma (Citation4–6). As a result, there is still a lack of biomarkers and potential targeted drugs that can help diagnose and classify type 2-low asthma, especially neutrophilic asthma, due to the complexity of the pathogenesis (Citation7–9).
Mitochondria, as one of the cell-specific structures wrapped in a double membrane, are not only responsible for producing the energy needed for cellular processes but also have numerous quality-control mechanisms by which they protect their molecular machinery from stress and maintain cellular homeostasis (Citation10,Citation11). In recent years, mitochondria have attracted great attention in respiratory diseases such as asthma, chronic obstructive pulmonary disease, and lung cancer. This is attributed to their crucial biological function in cellular energy metabolism, cellular processes, and the inflammatory response process (Citation12–15). The inflammatory mediator such as tumor necrosis factor (TNF) is correlated to mitochondrial damage by modifying mitochondrial ultrastructure, blocking the electron transport chain, and presumably by mediating mitochondrial production of oxygen radicals (Citation16). Mitochondria undergo morphological changes and produce proteins in response to environmental stimuli. These changes are crucial indicators that can lead to the damage or dysfunction of mitochondria (Citation14,Citation17). Recent studies reveal that mitochondrial dysfunction not only promotes oxidative stress and impacts the development of steroid insensitivity and asthma (Citation18–21), but also aggravates asthma symptoms by causing wheezing-like symptoms (Citation22,Citation23). The abnormalities of mitochondrial metabolism contribute to the pathogenesis of asthma. At the same time, an essential function of mitochondrial metabolism is to regulate the destiny of immune cells. Mitochondria, as the primary organelles involved in signal transduction, play a crucial role in controlling various cellular processes such as immune homeostasis and metabolic reprogramming. Research has shown that bacterial pathogens can alter the structure and function of mitochondria, which alters the metabolic state of immune cells and disrupts the immune microenvironment (Citation24). However, airway inflammation and immune microenvironment disorder are important mechanisms of asthma (Citation25). To the best of our knowledge, Huang et al. (Citation22) reported that mitochondrial-targeted antioxidant mitoquinone (MitoQ) could alleviate airway inflammation in TDI-induced steroid-insensitive asthmatic mice. Liu et al. (Citation23) suggested that Apelin-13 could regulate mitochondrial homeostasis by driving mitophagy and protecting the airway from oxidative damage induced by HDM allergen. Wang et al. (Citation26) also indicated that improving mitochondrial dysfunction can reduce airway inflammation. Unexpectedly, targeting mitochondria treatment is still a challenge due to the undefined mechanisms of mitochondria dysfunction in the pathogenesis of asthma.
Bioinformatics has provided us with valuable information about genes that are differentially expressed at multiple levels between patients with neutrophilic asthma and healthy individuals (Citation27). Han et al. (Citation28) have reported that disorders in mitochondrial metabolism are closely related to the disease state of neutrophilic asthma. Zhao et al. (Citation9) also suggested that mitochondrial dysfunction in airway epithelial cells contributed to the development of T2-low asthma. As a consequence, the identification and validation of mitochondrion-related gene signatures not only can provide an in-depth insight into underlying pathogenesis during the development of neutrophilic asthma, but also contribute a new direction for the treatment of asthma by targeting mitochondria.
Inspired by the above features, the present study aimed to screen signature mitochondrial genes associated with neutrophilic asthma by machine learning methods (Citation29), the potential biological functions of these genes were also analyzed to elucidate the potential pathogenic mechanism of mitochondria-related genes in neutrophilic asthma. The diagnostic value of these signature genes was evaluated by the ROC curve diagnostic model. Meanwhile, the confirmation of mitochondrial dysfunction in neutrophilic asthma was performed by a joint strategy of multiple experimental analyses (TEM analysis, mitochondrial membrane potential, and ROS production analyses) and in vivo experiments in mice was used to verify the expression of the signature genes. Combined with bioinformatics analysis and experimental validation, the present investigation may provide a potential target for the diagnosis and treatment in neutrophilic asthma.
Materials and methods
Data acquisition and preprocessing
Microarray datasets (GSE143303, GSE147878, and GSE43696) were retrieved from the NCBI GEO database (https://www.ncbi.nlm.nih.gov/geo/). Among them, GSE143303 was used as a test set, which included 60 bronchial biopsy samples from 13 healthy controls, 9 patients with neutrophilic asthma, and 38 non-neutrophilic asthma (22 eosinophilic asthma, 16 paucigranulocytic asthma). The GSE147878 and GSE43696 datasets were used as the validation set. 73 bronchial biopsy samples in the dataset GSE147878 include 13 healthy controls, 18 patients with mild/moderate asthma, and 42 patients with severe asthma. The GSE43696 dataset included 108 bronchial epithelial cell samples including 20 healthy controls, 50 patients with mild/moderate asthma, and 38 patients with severe asthma. 1136 human mitochondrial genetic data were downloaded from the MitoCarta3.0 database (https://www.broadinstitute.org/) for subsequent analysis.
Screening and biological enrichment analysis of DEGs
The differentially expressed genes (DEGs) in the airway epithelium of neutrophilic asthma patients (Neu) and healthy people (Con) in GSE143303 were identified by R-packet limma (Citation30). |log fold change(logFC)| >0 and corrected Pvalue < 0.05 was selected as the threshold. The heatmap and volcano maps were used for the presentation.
To clarify the biological functions of these DEGs, Gene Ontology (GO) and Kyoto Encyclopedia of Genes and Genomes (KEGG) pathway enrichment analyses were carried out using the clusterProfiler package in R. Based on all gene expression profile datasets, standardized gene sets ("c5.go.v7.4.entrez.gmt" and "c2.cp.kegg.v7.4.entrez.gmt") were retrieved from MSigDB database to investigate differences in biological processes between normal samples and neutrophilic asthma. The GSEA method contained clusterProfiler was used to determine biological pathways with statistically significant and visualization (p < 0.05).
Identification and biological function analysis of mitochondria-related DEGs
The R package "venn" was used to perform the intersection of mitochondria-related genes and DEGs, and the mitochondria-related DEGs (MitoDEGs) were screened and visualized. To further explore the biological functions involved in MitoDEGs, an enrichment analysis was carried out. The GO enrichment analysis was determined by the R-package cluster profiler and then displayed in the form of bar graphs and circle graphs. Pathway enrichment analysis was performed by the online website KOBAS (http://kobas.cbi.pku.edu.cn/). p-value < 0.05 was considered a significant enrichment result.
Machine learning screen signature MitoDEGs
Two machine learning methods (SVM-RFE and LASSO) were applied to screen signature mitochondrial diagnostic genes. As a common supervised machine learning strategy, SVM can be applied to classification and regression (Citation31). SVM module with R package “e1071” was established to further determine the diagnostic efficacy of signature mitochondria-related biomarkers in neutrophilic asthma. While LASSO was based on the R package "glmnet" for regression analysis (Citation32). Subsequently, the signature MitoDEGs were screened by the intersection of genes obtained from the two methods by the R package "Venn". The expression of the signature MitoDEGs was presented in the violin diagram.
Verification of signature MitoDEGs in external datasets
Datasets GSE147878 and GSE43696 were used to validate the expression of signature MitoDEGs in bronchial biopsies and bronchial epithelial cells of patients with mild to severe asthma. Additionally, the diagnostic efficacy of these genes was assessed using the ROC curve base on these two validate sets.
Analysis of microenvironment for neutrophilic asthma and its correlation with MitoDEGs
The infiltration and proportion of 22 immune cell subsets in neutrophilic asthma were analyzed by the CIBERSORT method. PCA analysis was conducted to compare the bronchial immune cell infiltration between individuals with neutrophilic asthma and healthy individuals and to understand the pattern of immune cell infiltration in neutrophilic asthma. Additionally, the study explored the correlation between signature MitoDEGs and the immune microenvironment using Pearson correlation analysis.
Prediction of signature MitoDEGs upstream regulators
The miRNA and transcription factors (TFs) of these genes can be predicted to illustrate the possible regulatory mechanism of signature MitoDEG. Firstly, the corresponding miRNA of the obtained signature MitoDEGs were predicated based on the Targetscan, miRDB, and miRWalk databases. Subsequently, the results were intersected to obtain the miRNA of signature MitoDEGs, and then the MitoDEGs-miRNAs network was constructed and visualized by Cytoscape. The plug-in iRegulon of Cytoscape 3.8.2 was applied to predict TFs of signature MitoDEGs. Master regulatory TFs were identified at the overlapped gene features. The predicting TFs process keeps the default parameters unchanged. Finally, the signature MitoDEGs-TFs network was constructed and visualized by Cytoscape 3.8.2.
Construction and validation of neutrophilic asthma mouse model
Balb/c mice (female, 4–6 weeks) were acquired from Tianqin Biotechnology Co., Ltd. (Changsha, China). These mice were fed in a specific approved pathogen-free SPF-grade laboratory. This research protocol has been approved by the Ethics Committee of Guangxi Medical University (approval No. 202210101). In the experiment, twelve mice were randomly assigned into the control group (Con) and the neutrophilic asthma group (Neu) with six mice in each group. Neu group was sensitized with subcutaneous injection of 20 μg ovalbumin (OVA) + 75 μL complete Freund’s adjuvant (CFA) + 25 μL PBS on the first day of modeling according to previous literature (Citation33,Citation34). OVA was diluted with sterile PBS to create a 1% OVA atomizing solution. On days 22–24, the mice were put into a sealed room that measured roughly 20 cm × 30 cm × 20 cm. For three days in a row, 1% OVA was atomized for thirty minutes each day using an ultrasonic atomizer inside a closed chamber (Citation35). The same dose of PBS was substituted for the sensitized sample mixture as the Con group. The airway response of mice was detected within 12 h after the last nebulization, and mice were sacrificed after isoflurane anesthesia within 24 h for specimen collection.
Within 12 h after the last nebulization, the airway response of the mice was detected by the noninvasive lung function instrument (Fine-Pointe NAM system TBL4500, Buxco, Wilmington, NC). The method was performed according to our previous research (Citation36). Typically, mice were placed in airtight containers for 5 min and then inhaled methylcholine aerosols (MCh, Sigma Aldrich) with different concentrations (0, 6.25, 12.5, and 25 mg/mL) at periodic intervals (5 min). Subsequently, mice were anesthetized by isoflurane and sacrificed. The alveolar lavage fluid in the mice was collected from the lavage fluid for Enzyme-linked immunosorbent assay (ELISA) and cell counting and determining the infiltration ratio of airway immune cells. The levels of sIgE, IL-4, IL-5, IL-17 and IFN-γ secretion in BALF were measured by ELISA kits (Cloud-Clone Crop, Wuhan, China), respectively. Lung tissue was simultaneously collected. The left lung lobe was embedded in paraffin after the treatment by fixed with 4% paraformaldehyde. The samples were cut into 3 μm thick slices and then stained with hematoxylin-eosin (HE) to detect the inflammatory cell infiltration of lung tissue. Subsequently, the degree of inflammatory cell infiltration peribronchial was evaluated by the semi-quantitative score described by Li et al. (Citation37). The scoring method is shown in . Immunochemical staining of the slides was performed with neutrophilic-specific antibodies, LY6G and MPO antibodies (1:100, servicebio, China) to measure neutrophilic infiltration in the lung tissue of mice (Citation38). While the remaining lung tissue was used for subsequent experiments.
Table 1. Scoring criteria for lung histopathology.
Construction of BEAS-2B cell line model
Since the sample for the training set we screened was human bronchial biopsy tissue, bronchial epithelial cells (BEAS-2B cell line) were chosen to mimic an in vitro asthma model to better fit the bioinformatics section. The human bronchial epithelial cell BEAS-2B was obtained from EK-Bioscience (Shanghai, China). Cells were divided into the control group (Control group) and IL-13/LPS stimulation group (IL-13/LPS group). Firstly, BEAS-2B cells in culture flasks were digested with trypsin to form cell suspensions to facilitate subsequent processing of experimental groups and then seeded into different cell culture dishes. Cells in the IL-13/LPS group were stimulated by added LPS (10 μg/μL; Cat#: L2880, Sigma-Aldrich, USA) and IL-13 (10 ng/μL; Cat#:200-13, Peprotech, USA), and then incubated for 48 h (Citation39). Cells were collected for the following research.
Determination of oxidative stress markers in lung tissue and intracellular ROS activity
The preparation of lung homogenate derived from lung tissue was performed by tissue homogenizer according to reagent instructions. The total protein concentration was determined by the BCA method. To evaluate the oxidative stress status of lung tissue, the content of malondialdehyde (MDA) and glutathione (GSH) in lung homogenates of mice were determined by the MDA kit (Nanjing Jiancheng, China) and GSH and GSSG Assay Kit (Beyotime, China), respectively. Cells were planted in 6-well cell culture plates contained with DCFH-DA (Solarbio, China) and then incubated for 30 min. A fluorescence microscope with Image-Pro Plus software was used to record the image.
Transmission electron microscopy
Fixed mouse lung tissues were first preserved with 3% glutaraldehyde at 4 °C. This was followed by refixation with 1% osmium tetroxide for 2 h. Subsequently, the sample was dehydrated by gradient ethanol and then embedded into epoxy resin. Finally, the prepared ultrathin sections (about 60–80 nm) of the samples were stained with uranyl acetate and lead citrate. The microstructure of mouse lung tissue was observed by transmission electron microscopy (JEM-1400 Flash).
Mitochondrial membrane potential detection
The mitochondrial membrane potential was analyzed by the JC-1 Mitochondrial Membrane Potential Assay Kit (Med Chem Express, China). Cells were planted in 6-well cell culture plates with JC-1 staining solution and then incubated for 15–20 min. The microstructure of the cells can be analyzed and recorded by fluorescence microscope with Image-Pro Plus software.
qPCR verified the expression of signature genes
The lung tissue RNA of twelve mouse lung tissue was extracted by Trizol. First, Trizol (Takara) was used to sufficiently lyse the samples. Chloroform was then added to the above solution. The resulting solution was divided into three layers after centrifugation. Among them, the RNA was distributed in the supernatant layer. The RNA concentration was then determined using ultrafine nanodrop spectrophotometry. The OD260/OD280 ratio of RNA samples in the range of 1.8-2.1 is considered qualified and available for subsequent operations. The extracted RNA was reversed-transcribed and amplified cDNA by TAKARA reverse transcription kit. The relative mRNA expression levels were analyzed by the 2−ΔΔCT method. The primers in were designed and synthesized by China Janis Biologics Co., Ltd.
Table 2. Primer sequences.
Statistical analysis
Statistical analyses for all data were performed by Graph Pad Prism 9.0.0 software. The normality test of measurement data was analyzed by the Shapiro-Wilk test. An independent sample t-test was used to compare the groups with normal distribution. Non-normally distributed measurement data were analyzed by the Mann-Whitney U test (Wilcoxon rank sum test). The results with statistically significant (p < .05) were presented in the form of mean value ± standard deviation. The semi-quantitative data of histopathological parameters were analyzed by the Kruskal–Wallis non-parametric test.
Results
Screening and enrichment analysis of DEGs in neutrophilic asthma
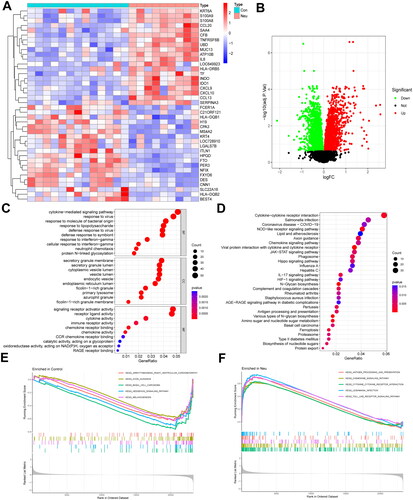
The schematic diagram for this study is shown in . Results indicated that 1626 differentially expressed genes were screened in the GSE143303 dataset. DEGs list was show in Table S1. The DEGs were depicted in heatmap () and volcano map (). GO enrichment analysis in suggested that DEGs were mainly involved in biological functions (including response to interferon-gamma, cytokine-mediated signaling pathway, secretory granule membrane, cytoplasmic vesicle lumen, signaling receptor activator activity, receptor-ligand activity, etc.). KEGG enrichment analysis in indicated that the DEGs were mainly enriched in enriched in Cytokine-cytokine receptor interaction, NOD − like receptor signaling pathway, JAK-STAT signaling pathway, and other signaling pathways. GSEA analysis () showed that neutrophilic asthma was mainly enriched in the signaling pathway of ANTIGEN_PROCESSING_AND_PRESENTATION, CYTOKINE_CYTOKINE_RECEPTOR_INTERACTION, TOLL_LIKE_RECEPTOR_SIGNALING_PATHWAY and RIG_I_LIKE_RECEPTOR_SIGNALING_PATHWA. These data suggested that the pathogenesis of neutrophilic asthma was closely linked to the regulation of cytokines and inflammatory factors, as well as the regulation of the inflammatory signaling pathway.
Figure 1. Schematic diagram to illustrate the analysis process in this work. MitoCarta genes: Mitochondrial-related genes; GSEA: Gene set enrichment analysis, MitoDEGs: Mitochondrial related differentially expressed genes; GO: Gene Ontology; KEGG: Kyoto Encyclopedia of Genes and Genomes; LASSO: Least Absolute Shrinkage and Selection Operator; SVM-REF: Support Vector Machine Recursive Feature Elimination; ROC: Receiver Operating Characteristic Curve.
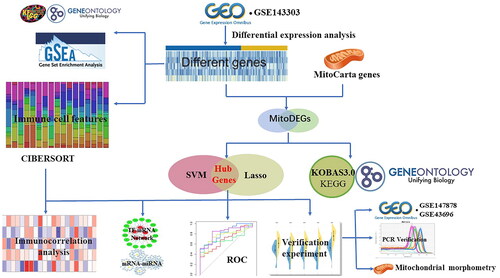
Figure 2. Screening of DEGs and enrichment analysis of biological pathways in neutrophilic asthma. Heatmap (A) and volcano map (B) of DEGs (red refers to up-regulated genes, blue represents down-regulated genes); (C) GO enrichment analysis bubble plot; (D) Bubble plot of KEGG enrichment analysis; (E,F) GSEA analysis.
Identification and functional enrichment analysis of MitoDEGs
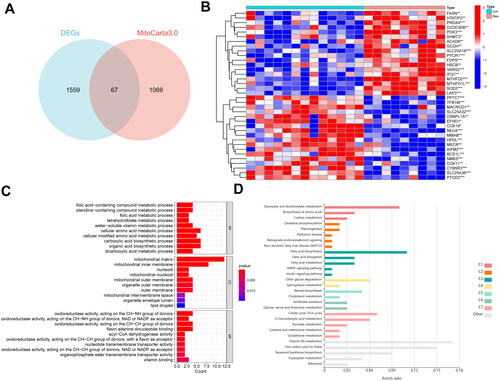
A total of 67 mitochondria-related differential genes were identified by the intersection between DEGs and human mitochondrial genes (). GO analysis in showed that MitoDEGs are mainly associated with the cellular amino acid metabolic process, carboxylic acid biosynthetic process, mitochondrial matrix, mitochondrial inner membrane, mitochondrial nucleus, mitochondrial outer membrane, and other biological functions. KEGG pathway enrichment analysis in demonstrated that MitoDEGs are mainly enriched in glyoxylate and dicarboxylate metabolism, biosynthesis of amino acids, fatty acid biosynthesis, steroid biosynthesis, 2-oxocarboxylic acid metabolism, and other signaling pathways. The results of the enrichment analysis indicated a close relationship between these MitoDEGs and the biological metabolic processes as well as the synthesis of cell mitochondria.
Figure 3. Screening of MitoDEGs and enrichment analysis of biological pathways in neutrophilic asthma. (A) Venn diagram of DEGs with mitochondria-related genes; (B) Heatmap of MitoDEGs (red represents up-regulated genes and blue represents down-regulated genes); (C) GO enrichment analysis of MitoDEGs, and (D) KEGG enrichment analysis of MitoDEGs.
Construction and identification of neutrophilic asthma diagnostic model
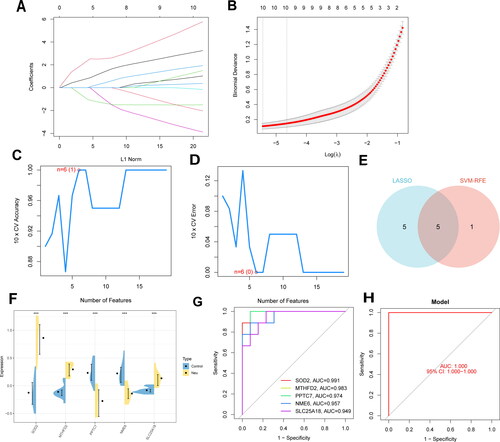
LASSO regression analysis and SVM-RFE algorithm were applied to further screen mitochondria-related biomarkers with diagnostic value for neutrophilic asthma. Ten diagnostic mitochondria-related biomarkers for neutrophilic asthma were screened out by the LASSO algorithm (). The features of MitoDEGs narrowed into a subset of six variables were performed by the SVM-RFE algorithm (). Five feature genes (SOD2, MTHFD2, PPTC7, NME6 and SLC25A18) shared by the two algorithms were selected as the final selection (). The violin diagram in presented the expression of these five marker genes in the test set GSE143303. The ROC curves of these 5 marker genes were constructed by R package pROC. Results in showed that the AUC of each gene was greater than 0.9, indicating that these five genes could well distinguish neutrophilic asthma in normal samples. Based on these five genes, a logistic regression model was simultaneously established by the R package “glm”. It can be found that the AUC value was 1.000 (), which suggested that the diagnostic model exhibited higher accuracy and specificity than a single marker gene in the diagnosis of neutrophilic asthma.
Figure 4. Machine learning for screening of signature MitoDEGs and construction of diagnostic models. (A,B) LASSO algorithm; (C,D) SVM-RFE algorithm; (E) The obtained signature genes by intersection between LASSO and SVM-RFE methods; (F) expression of signature genes in dataset GSE143303; (G) ROC analysis of five signature genes; (H) diagnostic model based on five signature genes.
External datasets validate the expression and diagnostic efficacy of MitoDEGs
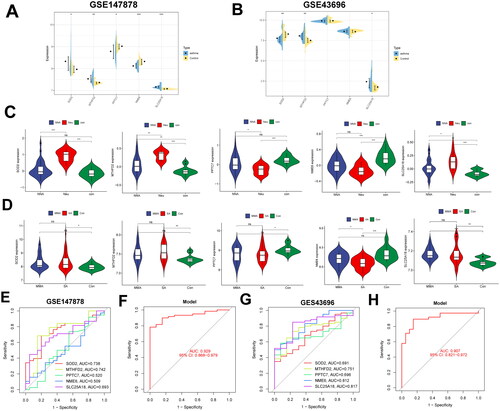
The five signature MitoDEGs were verified in external datasets GSE147878 and GSE43696. Simultaneously, the differences in expression among different types of asthma were analyzed (). For the external dataset GSE147878, the expressions of MTHFD2, SLC25A18, and SOD2 in asthma samples were significantly higher than that of normal control samples. NME6 gene differential expression was only observed in mild to moderate and severe asthma from the validation set GSE147878. Although the expression of the other mitochondria-related genes (MTHFD2, SLC25A18, PPTC7 and SOD2) varied between the asthmatic and normal groups, there was no discernible relationship between the other mitochondria-related genes and the severity of asthma. It also aligned with our expectations that these marker genes would express differently in the validation set GSE147879 (). In addition, a remarkably decreased change of NME6 in severe asthma can be seen compared with that of mild and moderate asthma. In the bronchial epithelial cell samples of dataset GSE43696, the expression of MTHFD2 and SLC25A18 in the neutrophilic asthma exhibited significantly higher than that of the control group. The expression of SOD2 in the neutrophilic asthma group was decreased compared with the control group (). We speculate that the source differences in the expression of datasets were mainly attributed to differences in experimental samples. For the test set GSE143303, there were significant differences between the expressions of MTFHD2, PPTC7, SLC25A18, and SOD2 and that of healthy people and non-neutrophilic asthma (NNA) patients (). In addition, a diagnostic model was constructed based on these five genes in the GSE147878 and GSE43696 datasets. The AUC values of the GSE147878 dataset () and the GSE43696 dataset () were 0.929 and 0.907, respectively. The results showed that these MitoDEGs have good diagnostic value and great application potential as novel biomarkers in the three validated databases.
Figure 5. Validation of signature MitoDEGs expression in the external dataset. Expression of signature MitoDEGs in validation dataset GSE147878 (A) and GSE43696 (B); Differences in the expression of signature MitoDEGs in neutrophilic asthma and non-neutrophilic asthma from dataset GSE143303 (C); Expression difference of signature MitoDEGs between mild to moderate asthma and severe asthma from dataset GSE147878 (D); Diagnostic value of signature MitoDEGs in dataset GSE147878 (E,F); Diagnostic value of signature MitoDEGs in dataset GSE43696 (G,H).
Construction of mRNA-miRNA and mRNA-TFs network
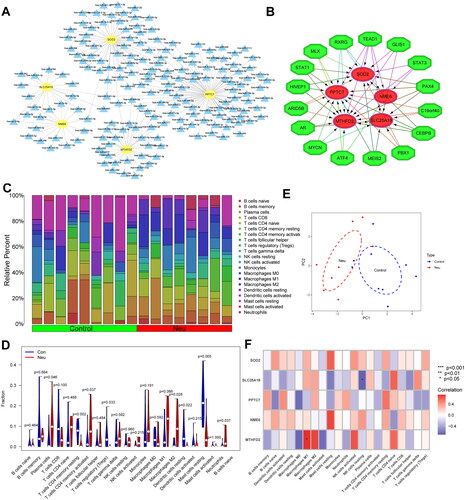
The miRNA with regulatory relationships between these genes was predicted from StarBase, miRDB, and miRanda databases to investigate the possible mechanisms of dysregulated expression of these signatures MitoDEGs. 180 miRNAs were identified. Among them, 31 miRNAs can simultaneously regulate more than two diagnostic genes. Moreover, hsa-miR-3121-3p could simultaneously regulate three signature MitoDEGs (SLC25A18, PPTC7, and SOD2 (). Subsequently, a total of 77 transcription factors were identified by the iRegulon plug-in in Cytoscape software. The major regulatory factors with simultaneously regulated more than 3 signature MitoDEGs are shown in . Among them, the transcription factor TEAD1 could simultaneously regulate five signature MitoDEGs, which suggests that the transcription factor TEAD1 may play a potential regulatory role in the regulation of mitochondrial function.
Figure 6. Regulatory network of signature MitoDEGs and the immune microenvironment in neutrophilic asthma. (A) Regulatory network of signature MitoDEGs and miRNAs (yellow refers to key MitoDEGs, blue stands for predicted miRNAs); (B) Regulatory network between signature MitoDEGs and TFs (red refers to signature MitoDEGs and green represents TFs); (C) Histogram of immune cell correlation; (D) Violin plot of immune cell infiltration; (E) PCA diagram of immune cells; (F) Heatmap of correlation between key MitoDEGs and immune cells.
Research on the immune microenvironment and the relationship with signature MitoDEGs
The proportion of infiltrating immune subpopulation was assessed by the CIBERSORT to investigate the bronchial immune microenvironment in patients with neutrophilic asthma. shows the proportion of infiltration of different immune cells. illustrates the relationship between immune cells in bronchial samples of neutrophilic asthma. It is worth noting that the proportions of neutrophils, M2 macrophages and T cells CD4 memory activated in the Neu group were significantly higher than that of the Con group. While the proportions of static mast cells resting, T cells CD4 memory resting, and dendritic cells resting were significantly lower than that of the Con group. The PCA analysis of immune cells in showed a remarkable difference in immune cell infiltration between neutrophilic asthma samples and normal samples. indicated that signature MitoDEGs MTFHD2 exhibited a positive correlation with M1 macrophages. While SLC25A18 was negatively linked with NK cells resting.
Construction and identification of asthma mouse model dominated by neutrophilic airway inflammation
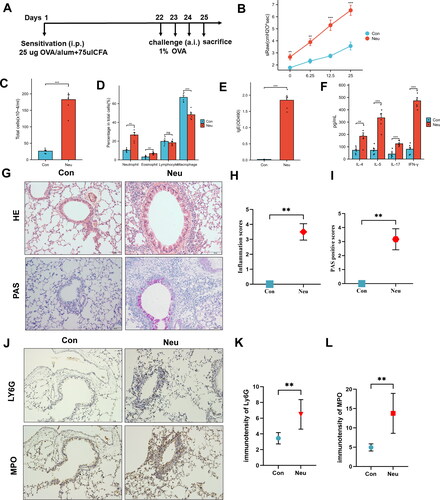
The schematic diagram () illustrates the construction process of the asthma mouse model. Pulmonary function test suggested that the specific airway resistance (sRaw) of asthmatic mice was significantly higher than that of the Con group after inhalation of methacholine doses (), suggesting the increased airway responsiveness in asthmatic mice. Simultaneously, a change with the increased infiltration of eosinophils, lymphocytes, neutrophils, and macrophages in the bronchoalveolar lavage fluid (BALF) of the Neu group under the microscope (). The ELISA results of BALF exhibited significant secretion levels of sIgE, Th2 cytokines (IL-4, IL-5) and IL-17, IFN-γ in the Neu group (). HE staining of lung tissue also indicated large numbers of neutrophil infiltration in the lung tissue of the Neu group mice (). PAS staining showed a remarkably increase change of the goblet cell hyperplasia and mucus hyperplasia in the tracheal lumen of the Neu group (). As shown in , the expressions of Ly6G and MPO in the lung tissue of neutrophilic asthma mice were significantly increased compared with those in the Con group. As a consequence, the asthma mouse model dominated by neutrophilic inflammation has been successfully constructed.
Figure 7. Construction and identification of mouse model with neutrophilic airway inflammation. (A) Modeling process; (B) Airway Responsiveness testing; (C) cell count in BALF; (D) Cell differential count in BALF; ELISA show the secretion level of sIgE (E) and IL-4, IL-5, IL-17, IFN-γ (F) in BALF; (G,H) HE-stained and inflammation score of lung tissue (Bar = 50um); (G,I) PAS staining and positive fraction in lung tissue (Bar = 50um); (J-L) Expression of LY6G and MPO in lung tissue; (*p <0 .05, **p < 0.01 and ***p <0 .001, ****p < 0.0001).
Mitochondrial dysfunction in airway epithelial cells of neutrophilic asthmatic mice and BEAS-2B cells induced by LPS/IL-13
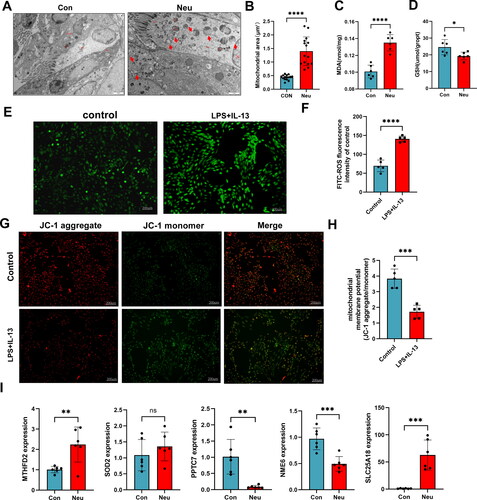
The mitochondrial morphology and structure of ciliated epithelial cells were investigated by TEM. The TEM image proved that the mitochondrial morphology and structure of ciliated epithelial cells were abnormal in the asthma group. The observed alterations in the mitochondrial microstructures include the enlargement and swelling of certain mitochondria, the partial dissolution of the matrix, which resulted in it becoming vacuolated (). Subsequently, the area of 15 mitochondrial membranes was randomly measured to calculate the cross-sectional area (namely mitochondrial area). The results found that the airway epithelial cells in the neutrophilic asthma mice exhibited a notable rise in both mitochondrial volume and swelling in contrast to the control group (). The fluorescence microscopy results showed that the mitochondrial membrane potential of BEAS-2B cells was significantly reduced after LPS/IL-13 stimulation (p < 0.05), suggesting that mitochondrial damage occurred in BEAS-2B cells stimulated with LPS/IL-13 ().
Figure 8. Mitochondrial function was detected in airway epithelial cells of mice with neutrophilic asthma and BEAS-2B cells induced by LPS/IL-13. (A) Transmission electron microscopy of mouse bronchial epithelial cells (Mi refers to Mitochondria, Red arrows represent swollen mitochondria (Bar = 2um)); (B) Mitochondrial area detection; (C)MDA content in lung tissue of mice; (D) GSH content in lung tissue of mice; (E,F) ROS expression in cells stimulated with LPS + IL-13, green fluorescence represents the ROS content (Bar = 200um); (G–H) Representative fluorescent images of mitochondrial membrane potential in BEAS-2B cells (red fluorescence representing JC-1 aggregates and green fluorescence representing JC-1 monomers (bar = 200 um)); (I) qPCR results of SOD2, MTFHD2, PPTC7, NME6 and SLC25A18 expression in lung tissue of asthmatic mice (**p < 0.01 and ***p < 0.001).
Evaluation of oxidative stress biomarkers in mouse lung tissue and intracellular ROS
Undoubtedly, oxidative stress was strongly associated with mitochondrial metabolic abnormalities and dysfunction (Citation18,Citation19). The expression level of MDA and GSH was used to evaluate the oxidative stress state of lung tissue in mice to investigate the mitochondrial metabolism in the lung tissue of asthma mice. The MDA in the lung tissue of the Neu group was significantly higher than that of the Con group (). The GSH in the lung tissue of the Neu group was significantly lower than that of the Con group (). These above changes indicated that oxidative stress occurred in the lung tissue of mice with neutrophilic asthma. At the same time, the intracellular ROS detection demonstrates that the fluorescence intensity of the control group was significantly improved in the BEAS-2B cell model of the LPS/IL-13 group ().
qPCR validation of signature mitochondrial diagnostic genes
qPCR was used to further manifest the gene expression of the signature MitoDEGs in the lung tissues of mice. Compared to the Con group, the gene expression levels of MTFHD2, SLC25A18 exhibited a significant increase in the Neu group, while the PPTC7 and NME6 were reversed, which is consistent with the bioinformatics analysis (). However, the expression of SOD2 in the Neu mice was not significantly different from that of the Con group. Consistent with the results of the bioinformatics analysis, our results suggested that the four signature MitoDEGs MTFHD2, SLC25A18, PPTC7 and NME6 revealed potential diagnostic value in neutrophilic asthma.
Discussion
Neutrophilic asthma, as a subtype of allergic asthma, exhibited features of minority and corticosteroid resistance, resulting in inefficient pharmacological interventions (Citation5). There are still huge challenges for early and timely diagnosis and intervention due to the lack of suitable biomarkers to identify this phenotype and predict the severity of the disease. In recent years, the role of mitochondria in inflammatory diseases attracted more and more attention, unfortunately, investigations about mitochondrial-related genes were still limited in neutrophilic asthma. The potential value of mitochondrial-related genes in the early diagnosis of neutrophilic asthma has not been studied. Therefore, the identification and validation of specific and sensitive biomarkers related to mitochondria in early, timely diagnosis was of great significance for the early and timely diagnosis of neutrophilic asthma.
Hence, bioinformatics methods combined with experimental analysis were used to explore the signature mitochondria-related genes in neutrophilic asthma. Totals of 69 mitochondrial-related differential genes were screened out. It can be found from the biological enrichment analysis that these genes were mainly involved in the regulation of mitochondria and various biological metabolism processes. This suggested that mitochondrial metabolism was closely related to the pathogenesis of neutrophilic asthma. Subsequently, five signature MitoDEGs (SOD2, MTHFD2, PPTC7, NME6, and SLC25A18) were screened out based on the machine learning methods.
Mitochondrial dysfunction can induce inflammatory response by participating in the regulation of various cell death types such as apoptosis, autophagy, and ferroptosis (Citation40). As a result, the relationship between mitochondrial function and chronic airway inflammatory diseases has received great attention. In this study, through the characterization and analysis of mitochondrial morphology, mitochondrial membrane potential, and oxidative stress response, it can be confirmed that mitochondrial dysfunction occurred in airway epithelial cells of neutrophilic asthma. qPCR results proved that the expression of signature MitoDEGs MTHFD2, PPTC7, NME6, and SLC25A18 were dysregulated in neutrophilic asthma, which suggests that these genes may be involved in the regulation of mitochondrial dysfunction in neutrophilic asthma. ROC analysis showed that these five genes exhibited good diagnostic value with an AUC greater than 0.9 in three different datasets. The expression of MTFHD2, PPTC7, SLC25A18, and SOD2 in neutrophilic asthma was significantly different from those sourced from healthy people and non-neutrophilic asthma patients, which suggested that the identification of neutrophilic asthma from non-neutrophilic asthma can be also distinguished by differential expression of these genes. Finally, in vitro and in vivo experiments were further performed to examine the mitochondrial dysfunction in neutrophilic asthma and reveal these mitochondrial-related signature genes as possible novel diagnostic factors for neutrophilic asthma.
However, to the best of our knowledge, the role of these four signature MitoDEGs in the pathophysiology of neutrophilic asthma has not yet been reported in the literature. Methylenetetrahydrofolate dehydrogenase 2 (MTHFD2), as a nuclear-encoded mitochondrial bifunctional enzyme, plays a role in maintaining intracellular redox balance. Sugiura et al. (Citation41) indicated that MTHFD2 can regulate the de novo purine synthesis and signal transduction of activated T cells, and simultaneously promote the proliferation of T cells and the production of inflammatory cytokines. MTHFD2 is also critical for regulating DNA and histone methylation in Th17 cells. Deficiency of MTHFD2 contributed to reduced disease severity in a variety of inflammatory disease models. SLC25A18, as a member of the human solute carrier family (SLCs) in the mitochondrial transporter system, mainly mediated the transport of solutes from the cytoplasm to the mitochondria and participated in key transport steps in a variety of metabolic pathways and the important biological processes (such as ion homeostasis, mitochondrial dynamics, cell differentiation and death) (Citation42–44). Liang et al. (Citation45) have pointed out that SLC25A18 with the ability to transport glutamate through the mitochondrial inner membrane takes part in the pathogenesis of diseases. Unfortunately, the role of SLC25A18 in diseases was insufficient, further research is needed. PPTC7, as a protein phosphatase, can target coenzyme q7 and promote cellular adaptation to respiratory conditions. González-Mariscal et al. (Citation46) reported that mitochondrial metabolism and ROS overproduction are strongly associated with PPTC7 during cellular adaptation to starvation or pro-oxidation. Grimsrud et al. (Citation47) indicated that the reduced expression of PPTC7 in liver tissue of obese (ob/ob) C57BL/6 mice is closely associated with mitochondrial phosphorylation profiles and metabolic dysfunction, which proved that PPTC7 also plays a key role in mammalian mitochondrial metabolism. The mitochondrial nucleoside diphosphate kinase NME6 provides pyrimidine ribonucleotides to mitochondria and is essential for mitochondrial gene transcription. Grotehans et al. (Citation48) reported that disfunction of NME6 leads to depletion of mitochondrial transcripts, causing instability of the electron transport chain and impaired oxidative phosphorylation. Moreover, as a member of the nucleoside diphosphate kinase (NDPK/NME/Nm23) family, NME6 can regulate nucleotide homeostasis, signal transduction, and metastasis inhibition in biological processes (Citation49). Haglund et al. (Citation50) found that the expression of NME6 was also significantly correlated with the clinical activity of Crohn’s disease. In the present study, a significant reduction in the expression of both PPTC7 and NME6 can be detected, this indicated that the abnormal expression of these two signature marker genes may be involved in the pathogenesis of mitochondrial dysfunction in neutrophilic asthma. However, its specific role and potential mechanism still need to be further explored.
In this study, the infiltration of 22 kinds of immune cells was analyzed and evaluated by the CIBERSORT method in the airway of neutrophilic asthma. A remarkable difference in the infiltration of airway immune cells between patients with neutrophilic asthma and healthy individuals. Among them, the differences in the infiltration of neutrophils, M2 macrophages and CD4+ T memory cells were the most outstanding. Ray and colleagues (Citation7) have demonstrated that airway neutrophils were closely related to the severity of asthma and corticosteroid resistance. M2 macrophages, one of the major cell types in the airway of allergic asthma patients, are closely related to type 2 inflammation. Our analyzed results also suggested that these immune cells play an important role in the immune regulation of neutrophilic asthma and are consistent with previous studies (Citation51,Citation52). In addition, the correlation analysis between five mitochondrial-related signature genes and immune cells showed that only MTHFD2 and SLC25A18 were significantly correlated with immune cells.
The identification and verification of mitochondrial-related gene signatures combined with bioinformatics methods and experimental analysis enrich the practical information of diagnostic markers and drug mitochondrial targeted therapy for neutrophilic asthma. Nevertheless, there were certain restrictions in this study. The sample size of neutrophilic asthma in the GEO dataset was relatively small. Although the samples of mice and cell lines have been applied to experimental validation, more clinical data are still needed to further verify our hypothesis. Furthermore, the research on mitochondrial damage in neutrophilic asthma is insufficiently comprehensive, resulting in requirement of the in-depth studies for confirmation and disclosure mechanism in the future. Meanwhile, further studies containing a correlation analysis and design gene knockdown or knockout experiments are necessary to elucidate the role of mitochondria-related genes in neutrophilic asthma, and then reveal the specific mechanisms of mitochondria dysfunction in the pathogenesis of neutrophilic asthma.
Conclusion
In summary, the role of the screened five mitoDEGs (SOD2, MTHFD2, PPTC7, NME6, and SLC25A18) was explored by the machine learning-based diagnostic models and the experimental validation in the pathogenesis of neutrophilic asthma. This investigation provides a potential target for the diagnosis and treatment of neutrophilic asthma targeting mitochondrial function and a guideline of potential mitochondria-related targets for clinical demand in patients who are resistant to steroids.
Authors contributions
Lu Lin: Writing - review & editing, Conceptualization, Investigation, Methodology, Data curation, Formal analysis, Validation; Zeng-hua Liao: Validation, Conception and design of research, Data curation, Formal analysis; Chao-qian Li: Resources, Investigation, Formal analysis, Supervision, Project administration.
Ethics statement
Animal experiment in this study was approved by Ethics Committee of Guangxi Medical University (ethics number: 202210101).
Supplemental Material
Download Text (541.9 KB)Acknowledgements
This research has been financially supported under the Guangxi Natural Science Foundation (2020GXNSFDA238003). And we also thank the hard work of Gene Expression Omnibus (GEO) dataset, GSEA, Lasso, SVM-RFE team members.
Declaration of interest
The authors report no conflicts of interest. The authors alone are responsible for the content and writing of this article.
Data availability statement
All datasets presented in this study are available in Gene Expression Omnibus (GEO) database (https://www.ncbi.nlm.nih.gov/geo/).
Additional information
Funding
References
- Halayko AJ, Pascoe CD, Gereige JD, Peters MC, Cohen RT, Woodruff PG. Update in Adult Asthma 2020. Am J Respir Crit Care Med. 2021;204(4):395–402. doi:10.1164/rccm.202103-0552UP.
- De Volder J, Vereecke L, Joos G, Maes T. Targeting neutrophils in asthma: a therapeutic opportunity? Biochem Pharmacol. 2020;182:114292. doi:10.1016/j.bcp.2020.114292.
- Tessier L, Côté O, Clark ME, Viel L, Diaz-Méndez A, Anders S, Bienzle D. Impaired response of the bronchial epithelium to inflammation characterizes severe equine asthma. BMC Genomics. 2017;18(1):708. doi:10.1186/s12864-017-4107-6.
- Xie Y, Abel PW, Casale TB, Tu YP. TH17 cells and corticosteroid insensitivity in severe asthma. J Allergy Clin Immunol. 2022;149(2):467–479. doi:10.1016/j.jaci.2021.12.769.
- Esteban-Gorgojo I, Antolín-Amérigo D, Domínguez-Ortega J, Quirce S. Non-eosinophilic asthma: current perspectives. J Asthma Allergy. 2018;11:267–281. doi:10.2147/JAA.S153097.
- Guida G, Bertolini F, Carriero V, Levra S, Sprio AE, Sciolla M, Orpheu G, Arrigo E, Pizzimenti S, Ciprandi G, et al. Reliability of total serum IgE levels to define type 2 high and low asthma phenotypes. J Clin Med. 2023;12(17):5447. doi:10.3390/jcm12175447.
- Ray A, Kolls JK. Neutrophilic inflammation in asthma and association with disease severity. Trends Immunol. 2017;38(12):942–954. doi:10.1016/j.it.2017.07.003.
- Nair P, Surette MG, Virchow JC. Neutrophilic asthma: misconception or misnomer? Lancet Respir Med. 2021;9(5):441–443. doi:10.1016/S2213-2600(21)00023-0.
- Zhao L, Gao J, Chen G, Huang C, Kong W, Feng Y, Zhen G. Mitochondria dysfunction in airway epithelial cells is associated with type 2-low asthma. Front Genet. 2023;14:1186317. doi:10.3389/fgene.2023.1186317.
- Cheng Z, Ristow M. Mitochondria and metabolic homeostasis. Antioxid Redox Signal. 2013;19(3):240–242. doi:10.1089/ars.2013.5255.
- Javadov S, Kozlov AV, Camara AKS. Mitochondria in health and diseases. Cells. 2020;9(5):1177. doi:10.3390/cells9051177.
- Spinelli JB, Haigis MC. The multifaceted contributions of mitochondria to cellular metabolism. Nat Cell Biol. 2018;20(7):745–754. doi:10.1038/s41556-018-0124-1.
- Caldeira DDF, Weiss DJ, Rocco PRM, Silva PL, Cruz FF. Mitochondria in focus: from function to therapeutic strategies in chronic lung diseases. Front Immunol. 2021;12:782074.
- Zhang J, Xie SJ, Xiao R, Yang DR, Zhan Z, Li Y. Identification of mitophagy-related biomarkers and immune infiltration in major depressive disorder. BMC Genomics. 2023;24(1):216. doi:10.1186/s12864-023-09304-6.
- Dunn JD, Alvarez LAJ, Zhang XZ, Soldati T. Reactive oxygen species and mitochondria: a nexus of cellular homeostasis. Redox Biol. 2015;6:472–485. doi:10.1016/j.redox.2015.09.005.
- Jin HS, Suh H-W, Kim S-J, Jo E-K. Mitochondrial control of innate immunity and inflammation. Immune Netw. 2017;17(2):77–88. doi:10.4110/in.2017.17.2.77.
- Shadel GS, Horvath TL. Mitochondrial ROS signaling in organismal homeostasis. Cell. 2015;163(3):560–569. doi:10.1016/j.cell.2015.10.001.
- Lewis BW, Ford ML, Rogers LK, Britt RD. Oxidative stress promotes corticosteroid insensitivity in asthma and COPD. Antioxidants. 2021;10(9):1335. doi:10.3390/antiox10091335.
- Aghapour M, Remels AHV, Pouwels SD, Bruder D, Hiemstra PS, Cloonan SM, Heijink IH. Mitochondria: at the crossroads of regulating lung epithelial cell function in chronic obstructive pulmonary disease. Am J Physiol Lung Cell Mol Physiol. 2020;318(1):L149–L164. doi:10.1152/ajplung.00329.2019.
- Riedl MA, Nel AE. Importance of oxidative stress in the pathogenesis and treatment of asthma. Curr Opin Allergy Clin Immunol. 2008;8(1):49–56. doi:10.1097/ACI.0b013e3282f3d913.
- Qian L, Nasab EM, Athari SM, Athari SS. Mitochondria signaling pathways in allergic asthma. J Investig Med. 2022;70(4):863–882. doi:10.1136/jim-2021-002098.
- Huang JW, Chen Y, Peng XR, Gong ZQ, Wang YH, Li YM, Xu MS, Ma YY, Yu CH, Cai SX, et al. Mitoquinone ameliorated airway inflammation by stabilizing 8-catenin destruction complex in a steroid-insensitive asthma model. Biomed Pharmacother. 2023;162:114680. doi:10.1016/j.biopha.2023.114680.
- Liu MX, Zhang YX, Dong L, Guo ZL. Apelin-13 facilitates mitochondria homeostasis via mitophagy to prevent against airway oxidative injury in asthma. Mol Immunol. 2023;153:1–9. doi:10.1016/j.molimm.2022.11.012.
- Marchi S, Guilbaud E, Tait SWG, Yamazaki T, Galluzzi L. Mitochondrial control of inflammation. Nat Rev Immunol. 2023;23(3):159–173. doi:10.1038/s41577-022-00760-x.
- Hammad H, Lambrecht BN. The basic immunology of asthm. Cell. 2021;184(9):2521–2522. doi:10.1016/j.cell.2021.04.019.
- Wang H, Cheng YL, Liu Y, Shi J, Cheng Z. Montelukast promotes mitochondrial biogenesis via CREB/PGC-1α in human bronchial epithelial cells. Artif Cells Nanomed Biotechnol. 2019;47(1):4234–4239. doi:10.1080/21691401.2019.1687502.
- Lin Q, Ni H, Zhong J, Zheng Z, Nie H. Identification of hub genes and potential biomarkers of neutrophilic asthma: evidence from a bioinformatics analysis. J Asthma. 2023;60(2):348–359. doi:10.1080/02770903.2022.2051544.
- Han Y, Chen L, Liu H, Jin Z, Wu Y, Wu Y, Li W, Ying S, Chen Z, Shen H, et al. Airway epithelial cGAS is critical for induction of experimental allergic airway inflammation. J Immunol. 2020;204(6):1437–1447. doi:10.4049/jimmunol.1900869.
- Greener JG, Kandathil SM, Moffat L, Jones DT. A guide to machine learning for biologists. Nat Rev Mol Cell Biol. 2022;23(1):40–55. doi:10.1038/s41580-021-00407-0.
- Ritchie ME, Phipson B, Wu D, Hu Y, Law CW, Shi W, Smyth GK. Limma powers differential expression analyses for RNA-sequencing and microarray studies. Nucleic Acids Res. 2015;43(7):e47-e47–e47. doi:10.1093/nar/gkv007.
- Zhou S. Sparse SVM for sufficient data reduction. IEEE T Pattern Anal. 2022;4(9):5560–5571.
- Cheung-Lee WL, Link AJ. Genome mining for lasso peptides: past, present, and future. J Ind Microbiol Biotechnol. 2019;46(9-10):1371–1379. doi:10.1007/s10295-019-02197-z.
- Pan HH, Ko JL, Wu CT, Sun HL, Quek YW, Ku MS, Lue KH. Effect of the fungal immunomodulatory protein FIP-five in the neutrophilic asthma animal model. Int Arch Allergy Immunol. 2021;182(12):1143–1154. doi:10.1159/000517184.
- Chen L, Hou WW, Liu F, Zhu RC, Lv AP, Quan WQ, Mao S. Blockade of NLRP3/Caspase-1/IL-1-β Regulated Th17/Treg immune imbalance and attenuated the neutrophilic airway inflammation in an ovalbumin-induced murine model of asthma. J Immunol Res. 2022;2022:9444227–9444211. doi:10.1155/2022/9444227.
- Sun QX, Xu SY, Li LD, Xiao H, Zhang QN, Li CQ. Nebulized Mycobacterium vacca protects against asthma by attenuating the imbalance of IRF4/IRF8 expression in dendritic cells. Asian Pac J Trop Biomed. 2022;12(12):520–529. doi:10.4103/2221-1691.363878.
- Xiao H, Zhang QN, Sun QX, Li LD, Xu SY, Li CQ. Transcriptomic analysis reveals a link between hippo signaling pathway and macrophages in lungs of mice with OVA-induced allergic asthma. J Inflamm Res. 2022;15:423–437. doi:10.2147/JIR.S346505.
- Li LD, Sun QX, Xiao H, Zhang QN, Xu SY, Lai LJ, Li ZN, Li CQ. Aerosol inhalation of heat-killed Clostridium butyricum CGMCC0313-1 alleviates allergic airway inflammation in mice. J Immunol Res. 2022;2022:8447603–8447611. doi:10.1155/2022/8447603.
- Jia M, Fu H, Jiang X, Wang L, Xu J, Barnes PJ, Adcock IM, Liu Y, He S, Zhang F, et al. DEL-1, as an anti-neutrophil transepithelial migration molecule, inhibits airway neutrophilic inflammation in asthma. Allergy. 2023;00:1–14. doi:10.1111/all.15882.
- Yang N, Shang YX. Ferrostatin-1 and 3-methyladenine ameliorate ferroptosis in OVA-induced asthma model and in IL-13-challenged BEAS-2B cells. Oxid Med Cell Longev. 2022;2022:9657933. doi:10.1155/2022/9657933.
- Bock FJ, Tait SWG. Mitochondria as multifaceted regulators of cell death. Nat Rev Mol Cell Biol. 2020;21(2):85–100. doi:10.1038/s41580-019-0173-8.
- Sugiura A, Andrejeva G, Voss K, Heintzman DR, Xu XC, Madden MZ, Ye X, Beier KL, Chowdhury NU, Wolf MM, et al. MTHFD2 is a metabolic checkpoint controlling effector and T cell fate and function. Immun. 2022;55(1):65.e9–81.e9. doi:10.1016/j.immuni.2021.10.011.
- Kunji ERS, King MS, Ruprecht JJ, Thangaratnarajah C. The SLC25 carrier family: important transport proteins in mitochondrial physiology and pathology. Physiology. 2020;35(5):302–327. doi:10.1152/physiol.00009.2020.
- Wohlrab H. The human mitochondrial transport protein family: identification and protein regions significant for transport function and substrate specificity. Biochim Biophys Acta. 2005;1709(2):157–168. doi:10.1016/j.bbabio.2005.07.003.
- Palmieri F, Monné M. Discoveries, metabolic roles and diseases of mitochondrial carriers: a review. Biochim Biophys Acta. 2016;1863(10):2362–2378. doi:10.1016/j.bbamcr.2016.03.007.
- Liang L, Chen YJ, Yu YY, Pan WY, Cui YH, Xu XJ, Peng K, Liu ML, Rashid K, Hou YY, et al. SLC25A18 has prognostic value in colorectal cancer and represses Warburg effect and cell proliferation via Wnt signaling. Am J Cancer Res. 2020;10(5):1548–1567.
- González-Mariscal I, Martin-Montalvo A, Vazquez-Fonseca L, Pomares-Viciana T, Sánchez-Cuesta A, Fernández-Ayala DJ, Navas P, Santos-Ocana C. The mitochondrial phosphatase PPTC7 orchestrates mitochondrial metabolism regulating coenzyme Q10 biosynthesis. Biochim Biophys Acta Bioenerg. 2018;1859(11):1235–1248. doi:10.1016/j.bbabio.2018.09.369.
- Grimsrud PA, Carson JJ, Hebert AS, Hubler SL, Niemi NM, Bailey DJ, Jochem A, Stapleton DS, Keller MP, Westphall MS, et al. A quantitative map of the liver mitochondrial phosphoproteome reveals posttranslational control of ketogenesis. Cell Metab. 2012;16(5):672–683. doi:10.1016/j.cmet.2012.10.004.
- Grotehans N, McGarry L, Nolte H, Xavier V, Kroker M, Narbona-Pérez AJ, Deshwal S, Giavalisco P, Langer T, MacVicar T. Ribonucleotide synthesis by NME6 fuels mitochondrial gene expression. EMBO J. 2023;42(18):e113256. doi:10.15252/embj.2022113256.
- Proust B, Radić M, Vidaček NŠ, Cottet C, Attia S, Lamarche F, Ačkar L, Mikulčić VG, Tokarska-Schlattner M, Ćetković H, et al. NME6 is a phosphotransfer-inactive, monomeric NME/NDPK family member and functions in complexes at the interface of mitochondrial inner membrane and matrix. Cell Biosci. 2021;11(1):195. doi:10.1186/s13578-021-00707-0.
- Haglund S, Almer S, Peterson C, Söderman J. Gene expression and thiopurine metabolite profiling in inflammatory bowel disease - novel clues to drug targets and disease mechanisms? PLOS One. 2013;8(2):e56989. doi:10.1371/journal.pone.0056989.
- Wang Y, Zhu JH, Zhang L, Zhang ZJ, He L, Mou Y, Deng YH, Cao Y, Yang P, Su YC, et al. Role of C/EBP homologous protein and endoplasmic reticulum stress in asthma exacerbation by regulating the IL-4/signal transducer and activator of transcription 6/transcription factor EC/IL-4 receptor α positive feedback loop in M2 macrophages. J Allergy Clin Immunol. 2017;140(6):1550.e8–1561.e8. doi:10.1016/j.jaci.2017.01.024.
- Byers DE, Holtzman MJ. Alternatively activated macrophages and airway disease. Chest. 2011;140(3):768–774. doi:10.1378/chest.10-2132.