
 ?Mathematical formulae have been encoded as MathML and are displayed in this HTML version using MathJax in order to improve their display. Uncheck the box to turn MathJax off. This feature requires Javascript. Click on a formula to zoom.
Abstract
While bonding for structural applications in Europe was limited to only a few softwood species in the past, forest alterations toward more climate stability will increase the diversity of tree species. This requires an understanding of typal wood-adhesive interactions. To help facilitate birch wood bonding, its cold-water soluble extractives and their effects on mechanical performance and bond line morphology were studied using water-borne melamine-urea-formaldehyde (MUF) and hydrophobic solvent-free polyurethane (PUR) adhesives. Extractives classes were identified via mass spectrometry and their concentration and extraction kinetics were evaluated. The analysis revealed that the mechanical properties of the bond line were essentially unaffected by extraction when using the hydrophobic PUR adhesive. Increased degrees of extraction resulted in reduced MUF penetration, and slightly thicker bond lines, however, the mechanical results indicate improved performance, indicating fewer defects in the cured adhesive network.
Introduction
The production of engineered wood products (EWPs) predominantly requires adhesive bonding. Different chemical and physical processes are involved in forming an adhesive bond. Fundamental adhesion theories were fiercely discussed in their importance to the overall bond performance for decades.[Citation1–7]
Compared to solid bulk materials, i.e., metals or plastics, the adhesion of wood is even more complex due to its anisotropic, porous, as well as its structurally and chemically heterogeneous nature. It has been shown that the presence of wood extractives can affect the properties of a wood-adhesive bond.[Citation8–11] In the past years, an ongoing change in silviculture to more diverse structured forests could be observed, from predominantly monoculture coniferous species to an increased amount of deciduous species. This is driven by the increasing risks and damages of monospecific softwood stands under climate change impacts such as droughts, heat, storms and insect attacks.[Citation12–14] Consequently, the availability of wood from coniferous species will reduce in the future, while it will increase for deciduous species, such as beech, oak, ash and birch.[Citation15] While initial findings on the effects of extractives on the structural bonding of beech,[Citation16] oak[Citation17] and ash[Citation18] and other hardwoods[Citation19] are available, silver birch has hardly been studied in this regard. Because birch wood will gain in importance especially as a pioneer wood species for the reforestation of damaged forest areas, even under changing climatic conditions, and also has very positive physical-mechanical wood properties,[Citation20,Citation21] birch wood will become increasingly interesting for load-bearing timber products. The attainable bond strength[Citation20,Citation22,Citation23] of birches indicates good potential for use in glulam or CLT. To exploit the potential a fundamental understanding of the basic mechanisms in the bonding of birch wood, in particular on interactions between wood extractives and adhesives is essential.
The extent and depth of the adhesive flow into the wood were studied using X-ray computed tomography[Citation24–26] and microscopic methods[Citation27,Citation28] when bonding different wood species with various adhesives. In addition to the penetration into the wood’s pore structure, diffusion into the cell walls was observed with in situ polymerizing resins, which results in a strong improvement of dimensional stability.[Citation29,Citation30] Konnerth et al.[Citation31] demonstrated with scanning thermal microscopy (SThM) that polyurethane (PUR) adhesive is not diffusing into cell walls. This observation was confirmed by Casdorff et al.[Citation32] using atomic force microscopy (AFM) and Raman spectroscopy imaging. In the case of water-borne phenol-resorcinol-formaldehyde (PRF) adhesive, with its lower molar mass and ability of hydrogen bonding, Konnerth et al.[Citation31] observed gradients of adhesive into the cell walls by SThM experiments. By the use of X-ray fluorescence microscopy and nanoindentation, Jakes et al.[Citation33] observed the penetration of PF adhesive into wood cells.
The resulting interphase with filled lumina or modified cell walls can exhibit altered mechanical properties, e.g., higher stiffness or increased brittleness. In Gindl[Citation34] and Konnerth and Gindl,[Citation35] nanoindentation of interphase cell walls and reference cell walls of spruce bonded with MUF, PUR and other adhesives demonstrated a decrease of the modulus of elasticity (MOE) of cell walls near PUR bond lines due to the damaging of the cell wall’s structure during surfacing. However, an increase in MOE and hardness was observed in the case of cell walls near MUF bond lines, where damaged cell walls are stiffened by adhesive diffusion. These findings have been verified in nanoindentation studies multiple times since.[Citation36–39] Equal importance in mechanical behavior for load-bearing timber with bond lines can be attributed to the adhesive’s mechanical properties. In Müller et al.,[Citation40] tensile shear and fracture tests with dual cantilever beam geometry were performed using digital image correlation (DIC) techniques and compared to finite-element-method (FEM) simulations with PUR, PRF and MUF adhesives. Increased stress concentrations for stiffer adhesives and higher fracture energy for softer PUR adhesives were demonstrated. Similar results were obtained before by Serrano and Enquist[Citation41] using DIC analysis on tensile shear and block shear tests.
Adhesive curing kinetics govern the evolution of viscosity during the bonding process. This determines the adhesive’s mobility during the formation of the bond line interphase by penetrating into the adherends porous structure. The effects of extractives from several softwoods but also larch, beech, oak and chestnut wood on adhesive curing were studied by Özparpuzu et al.[Citation42–44] via rheometry and parallel FTIR spectrometry for common adhesive systems. There, the observed effects on curing kinetics were highly dependent on the respective wood species.
In an initial study on interactions of birch wood extractives with MUF adhesive and one-component PUR adhesive, it was found that the kinetics of adhesive curing can be affected by the presence of birch wood extractives.[Citation45] In this prior study, also the tensile shear strength (TSS) was found to be affected after performing a partial cold-water extraction of the boards.
To better understand the relationship between extractives concentration and effects on the bond line properties, this study shall investigate them as a function of extraction duration and respective extraction degree (ED). Thereby, specific correlations between extraction and bond line properties can be quantified. The effects of extractives on adhesive penetration and interphase formation were not quantified before. So, in summary, while adhesive penetration and its influence on mechanical bond line properties have been studied for wood in general, the factor of extractives on the bond quality was unclear for silver birch wood.
Therefore, the objective of this study is to first identify and quantify the water-soluble extractives of birch wood using liquid chromatography coupled with high-resolution mass spectrometry. Secondly, the extracted wood was subsequently bonded with MUF and PUR adhesives, followed by investigations into the changes in adhesive penetration behavior and mechanical bond line properties as a reaction to extraction treatments. For this purpose, the standard tensile shear setup is extended using digital image correlation (DIC), and an image-based microstructural characterization tool has been developed using UV microscopy to assess the bond line morphology. Finally, the previous findings on the extractives and bond line quality were linked to the results of mechanical behavior for both MUF and PUR adhesives.
Experimental section
Materials and pretreatment
The wood used in this study was silver birch (Betula pendula Roth) from the region of Lieska in Finland, conditioned at 20 ± 1 °C and 65 ± 3% relative humidity (RH). The logs were cut flatsawn resulting in a mixed radial/tangential cut of the processed boards. From these boards, batches of similar growth ring orientations were selected for both adhesives to eliminate orientation differences between extraction groups. Boards from straight-grained, defect-free sapwood with a density of 600 ± 30 kg/m³ and dimensions of 350 mm (L) × 150 mm (W) × 5.5 mm (T) were prepared. Within the study, two different types of adhesive were used – an in situ polymerizable adhesive and a pre-polymerized adhesive. For a typical in situ polymerizing adhesive, the water-borne melamine-urea-formaldehyde (MUF) resin Kauramin® 683 with 20% (W/W) hardener component Kauramin® 688[Citation46] was used. To improve the adhesive’s contrast to the wood, the xanthene-type UV dye Rhodamine B (CAS No 64381-99-3) was added in a concentration of 0.02% (W/W). As a typical pre-polymerized adhesive, the water-free one-component polyurethane (PUR) adhesive Loctite® HB S309 Purbond[Citation47] was used. Here, a UV-fluorescent dye was already included in the manufacturers’ formulation. As extraction solvent, partially deionized water (treated by reverse osmosis) of controlled ion concentration (determined via total dry solid content mass per solvent volume was used.
Three extraction processes of 4, 8 and 16 days were performed with 8 boards each. The boards were placed in closed glass containers, fixed and separated by glass-made rack constructions. They were then submerged in 20 °C water with a volume ratio of 10:1 (water/wood) under constant stirring using a magnetic stirring bar. To minimize saturation effects, the solvent water was exchanged every 24 h. Before reconditioning, the soaked extracted boards were kept in the emptied containers at saturated RH while stacked and weighted (20 kg) for 72 h to (i) equilibrate the gradients of extractives developed during the diffusion process, and (ii) reverse possible warping of the boards. The reference boards, with no extraction, were also prepared to minimize possible bias due to any secondary effects of the water imbibition. Therefore, they were soaked without excess water by repeatedly wetting the surfaces. All boards were reconditioned at 20 ± 1 °C and 65 ± 3% RH for bonding.
Extraction analysis
Within each of the three extraction periods, a set of four solvent water samples was taken over the course of extraction (the sampling procedure is detailed in Appendix A). The dry sample solid masses were obtained after filtration by lyophilization and used to calculate the extractives content as the ratio of dry extractives (t) removed after each sampling period
to the dry wood mass
. The cumulative extractives content
was calculated from the extractives content results of the three sample sets.
Hydrophilic interaction liquid chromatography (HILIC) and reverse phase liquid chromatography (Shimadzu Nexera UHPLC) were performed and coupled with mass spectrometry (TOF-MS, Sciex TripleTOF6000) both in positive and negative modes. The UHPLC-ESI-TOF-MS technique allows high-resolution (1·10−4 Da) ion mass determination without requiring sample derivatization. Following the post-processing of the data, a detailed plausibility check was conducted. All compounds passing this review were assigned to a chemical class for further evaluation since identifying and verifying exact molecular structures was neither necessary nor feasible, given the applied untargeted analysis method. For a detailed specification of the extractives analysis procedure, see Appendix A.
The cumulative abundance of the compounds was obtained for the three sample sets by peak area integration
and subsequent adjustment by multiplication with the respective sample mass
.
Both the progression of and
were analyzed by fitting the data to a stretched exponential function (EquationEquation (1)
(1)
(1) ), suitable for Fickian and non-Fickian diffusion processes[Citation48]
(1)
(1)
whereby estimates for the equilibrium values after infinite time (complete extraction)
, the kinetic parameters, i.e., lifetime
and stretch exponent
, and the equivalent lifetime
(EquationEquation (2)
(2)
(2) ) were obtained, with
being the gamma function.
(2)
(2)
This way, kinetic parameters for the individual compounds were obtained. Additionally, the cumulative, -weighted abundances of individual compound classes were evaluated in the same way.
Mechanical bond line analysis
The tensile shear experiments were based on the standard EN 302–1[Citation49] for tensile shear strength (TSS) testing, but uses silver birch as a wood species with the above-described pretreatments of the boards. The specimen preparation and measurement were conducted at 20 ± 1 °C and 65 ± 3% RH. All boards were sanded on a wide belt grinding machine with 220-grit sandpaper to 5 mm thickness (surface preparation). From each group (0, 4, 8 and 16 days of extraction), four boards were bonded with MUF and PUR adhesive, respectively. The bond procedures followed the manufacturers’ recommendations in the technical data sheets (listed in Appendix B). From each bonded pair, 18 shear specimens were obtained. The growth ring angles of the MUF and PUR bonded TSS specimen from the flat-sawn boards were in the range of 26°±13° and 39°±19°, respectively, following the results and suggestions to improving tensile shear testing in adhesion studies with diffuse-porous hardwoods of Hass et al.[Citation50]
The TSS experiments were conducted at a constant displacement rate of 1 mm/min on a universal testing machine with wedge screw specimen holders (ZwickRoell GmbH & Co.KG, Ulm, Germany). Additional aluminum guides were mounted to the specimen holders to minimize bending and subsequent peeling in the bond line. Parallel to the measurement of shear stress, the local deformation in the specimen’s overlapping region was detected with digital image correlation (DIC), observing the bond line and wood in the 10 × 10 mm2 side face. During the shear experiment, this region was tracked with the DIC System (Aramis 12MP, GOM GmbH, Braunschweig, Germany) with a field of view of 20 × 15 mm2, allowing a spatial resolution of the surface strain of 70–80 µm. A description of the DIC measurement technique is presented in Appendix B.
With the acquired deformation data, the apparent shear modulus of the bond line was calculated from the specimen’s global shear stress
and the arithmetic mean of the engineering shear strain along the bond line
.
was determined by the slope
of a linear regression in the linear viscoelastic (LVE) regime, whereby a variable interval yielding the maximum R2 was used. The yield strength (elastic shear stress limit)
was determined by the offset method[Citation51] based on the regression result of
, allowing a plastic shear deformation threshold of
= 2 × 10⁻³.
The shear deformation profiles along the bond line and perpendicular to the bond line were constructed by subsetting the shear deformation at y = 0 mm and averaging the deformation data of the entire overlap area in 0.1 mm steps in the y-position, respectively. The profiles were generated for reference conditions of constant average bond line shear deformation and, subsequently, average profile curves were generated per specimen group. This allowed a qualitative comparison of the stress distribution along the bond line and the deformation concentration toward the bond line or into the interphase region. A quantitative comparison of the strain distribution perpendicular to the bond line was conducted by fitting the time-dependent profile data in the LVE regime to a single, centered pseudo-Voigt function with a variable height of by optimizing the full width at half maximum W and shape parameter
(EquationEquation (3)
(3)
(3) ).
(3)
(3)
The fractured surfaces of the tensile shear specimen were captured in a dark room with UV illumination (365 nm) using a 5 MP camera with a 20 µm resolution. The fluorescent adhesive was detected by color thresholding in ImageJ version 1.53q to generate binary masks of both surfaces. Applying Boolean operations to the masks of both surfaces, fracture areas with no adhesive, adhesive on one surface, and adhesive on both surfaces were determined to calculate the area percentages of cohesive wood failure (), adhesion failure between wood and adhesive (
) and cohesive failure in the adhesive layer (
), respectively. The developed script was made available online (https://doi.org/10.5281/zenodo.7661117).
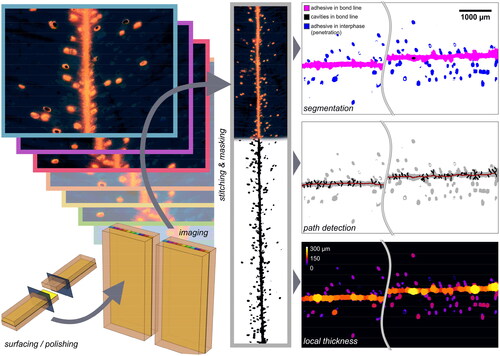
Morphological bond line analysis
The tensile shear strength (TSS) specimens were used for microscopic analysis after being tested. Therefore, the fractured overlap area was sawn off at the notch positions of the specimen. The two resulting transversal surfaces were sanded and polished. Using a UV light source, the fluorescent bond lines were captured with a digital reflective microscope (Carl Zeiss Microscopy Deutschland GmbH, Germany). Images of 3.1 mm × 2.3 mm were captured continuously along the bond line at a resolution of 0.8 µm2/px. The image overlap was approximately 15%, resulting in 20 images per specimen.
All image processing was conducted in the software ImageJ version 1.53q (public domain). First, the images of each bond line were combined, and the areas of fluorescent adhesive were segregated from the wood. The local bond line thickness and the size and location of cavities in the bond line were determined. Further, for penetrated adhesive in the interphase, the area and the shortest distance to the bond line (the penetration depth) were evaluated.
With this data, the mean bond line thickness and the adhesive penetration factor
were calculated for each specimen. The
is the sum of all
adhesive-filled areas
in the interphase of each specimen multiplied by their penetration depths
per total observed bond length
(∼2 × 20 mm) of the specimen (EquationEquation (4)
(4)
(4) ).
(4)
(4)
Since especially one-component PUR adhesive can form cavities in the bond line due to trapped CO2-gas, the areal fraction of cavities to the total bond line area, ergo the bond line porosity , was additionally calculated. A more detailed description of imaging and image processing can be found in Appendix C, while the processing script itself was made available online (https://doi.org/10.5281/zenodo.7657395).
Results and discussion
Extraction analysis
The extraction analysis was performed to identify the types of extractives and their kinetics of extraction. Therefore, repeated sampling, gravimetric quantification, and mass spectrometry (MS) of the extractives via UHPLC-ESI-TOF-MS were performed and analyzed based on generalized diffusion laws.
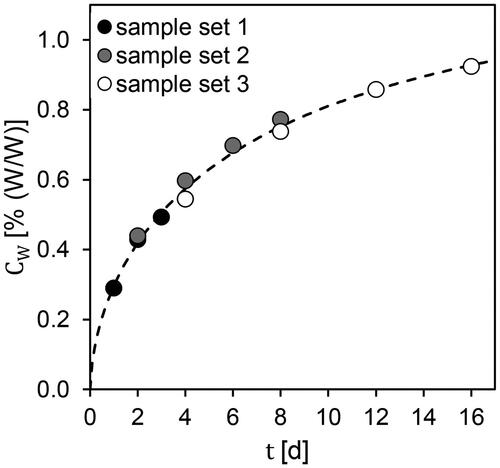
The progression of the cumulated extractives content per dry mass of treated wood removed from the boards is presented in . The extraction progress can be explained in good agreement (RMSE < 0.02%) by a stretched exponential function (EquationEquation (1)
(1)
(1) ). From the function, an estimated extractives amount at an infinite time
of 1.18% (W/W) is estimated, which is in good accordance with expectations from the literature[Citation52] Moreover, an equivalent lifetime
of 11.6 d and the kinetic parameters
,
can be derived. Based on the equilibrium extraction amount, the extraction degree
attained are 49%, 64%, and 79%, for the extraction durations
of 4 d, 8 d and 16 d, respectively. The cumulative extraction curves by weight and MS evaluation show a high correlation (
> 0.98) for all UHPLC/MS measurement modes (Figure SI–1). Detailed results for all modes are found in the supplementary information.
Figure 1. The cumulative sum of extractives content (per dry weight wood) in the water samples; dashed line indicates the stretched exponential fit (EquationEquation (1)(1)
(1) ).
For further evaluation, analysis results from the UHPLC/MS mode yielding the highest detection rate are selected for each compound class. Compound classes, which are small in the number of compounds or low in relative abundance =
are neglected in the results and discussions below.
Utilizing the TOF-MS sensor’s good linearity for individual ions, the kinetic parameters of individual compounds could be quantified. The evaluation of diffusion kinetics indicates a high variance in , within as well as between compound class groups (Figure SI–5). Cumulatively (abundance-weighted averages), fatty acids, phenolic glycosides and saccharides show the fastest diffusion behavior with
of 2.1, 3.0, and 3.8 d, respectively. Slower diffusion behavior is exhibited by compound classes, especially phospho- and glycerolipids, with
values of 6 and 8 d, respectively. Other detected classes are phenols and polyphenols with
values of 4.6 d and 5.7 d, respectively.
The abundance-weighted average for the different compounds’ classes ranges from 200 Da for carboxylic fatty acids to 759 Da for saccharides.
The compound classes of the highest detected MS abundance are phenolic glycosides (38%), phospholipids, (
= 19%), saccharides (
= 11%), glycerolipids (mono- or disubstituted glycerols,
= 10%) and fatty acids (
= 10%). It has to be noted that the presented
values are considered only a semi-quantitative approach for estimating the composition of the extractives via MS abundances. Thereby, differences in ionization probability within and between UHPLC/MS modes and response factors are neglected. Moreover, only organic compounds in the detectors
range can be considered.
The curve-fitting parameters and relative standard error () for the combined adjusted abundances of all compound classes are shown in . In general, the non-linear regressions of combined abundances showed good accordance with the MS data with
values of 2% or below for the respective compound classes.
Table 1. Compound classes of birch extractives: Average results of abundance-weighted , and equivalent lifetime
.
Comparison of the total MS abundance data to the gravimetric results of the relative extractives concentration per weight, i.e., extraction degree , reveals some deviations in the release pattern compared to MS data (see Figure SI–6 and discussion there).
Considering the similarity in the kinetic release pattern of the compound classes and, thus, the high similarity of extract compositions (Figure SI–6C) for the varying extraction durations, the results below are discussed in correlation to the aggregated extraction degree .
Mechanical properties
Previous investigations indicated both reduced stiffness and strength due to extractives in the bond line when using birch wood, especially when using MUF adhesive.[Citation45] The mechanical analysis intends to provide additional means to verify the relationships between extractives in birch wood during adhesive curing and the mechanical bond line properties in a more detailed way. Therefore, an adapted tensile shear setup combined with a digital image correlation (DIC) device for detecting local shear deformations of the lap joint, in addition to strength properties, successfully allowed in situ analysis of apparent bond line stiffness, determination of the bond line’s yield point, and analysis of strain distributions.
The tensile shear strength (TSS) results, defined as the maximum shear stress of the specimens indicated a moderate but significant (p > 0.0001) increase in MUF bond strength with higher extraction degree
. While the reference specimen without extraction showed an average TSS of
= 11.1 ± 1.9 MPa (average ± standard deviation), higher results of 12.1 ± 1.1, 11.8 ± 0.8 and 12.8 ± 1.2 MPa were obtained after 4, 8 and 16 d of extraction, respectively (, in black). Linear extrapolation estimates a strength increase
of 1.8 MPa (+17%) for complete extraction (
= 100%). Similarly, the yield strength increased (p > 0.0001) with values of
= 10.5 ± 1.4, 10.4 ± 1.4 and 10.7 ± 1.6 MPa after 4, 8 and 16 d of extraction, respectively, compared to 8.6 ± 1.9 MPa for specimens without extraction and bonded with MUF (, in blue). Linear extrapolation estimates a yield strength increase
of 2.6 MPa (+30%) for complete extraction.
Figure 2. Mechanical properties as a function of extraction degree ED. Ultimate strength τm (maximum shear stress; in black) and yield strength τe (elastic shear stress; in blue) for specimens bonded with MUF (A) and PUR (B). Small dots indicate individual results; large dots indicate the average result per specimen group. The dashed lines indicate the linear regression of the individual results and the confidence band (α = 0.05).
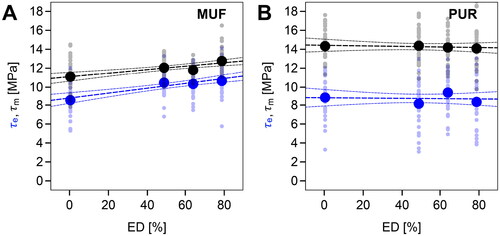
In the case of PUR bonded specimens, no effect due to was observed on ultimate strength with
= 14.4 ± 1.8 MPa for the specimens without extraction and 14.4 ± 1.8, 14.2 ± 1.6 and 14.1 ± 2.2 MPa after 4, 8 and 16 d of extraction, respectively (, in black). Also, no trend between the PUR bond line’s yield strength and
was observed with
= 8.9 ± 2.1, 9.3 ± 2.3, 9.4 ± 2.4, and 8.4 ± 3.2 MPa, for the specimen groups of 0–16 d, respectively (, in blue). Because of the hydrophobic nature of the PUR adhesive, water-soluble extractives will have an incompatibility with the adhesive media due to their hydrophilic character. Nevertheless, those extractives that are amphoteric and partially compatible with the adhesive will be hindered from diffusing due to the high viscosity of the PUR adhesive (24 Pa·s)[Citation47] compared to water-borne MUF adhesive (2 − 3.5 Pa·s).[Citation46] Moreover, mostly only extractives deposited on the cell surfaces will interact with the prepolymerized PUR, which is unable to diffuse into the cell walls.[Citation31,Citation32]
While comparisons for bonds on extracted wood were not available for birch, the TSS results of untreated wood specimens are generally in line with expectations from the literature: In Konnerth et al.,[Citation19] tensile shear tests based on EN 302–1 were conducted on untreated birch wood using PUR and MUF type adhesives. The average reported, was 12.1 MPa (vs. lower TSS of 11.1 MPa in this study) for MUF-bonded specimens and 11.3 MPa (vs. higher TSS of 14.4 MPa in this study) for PUR-bonded specimens. In contrast to this work, however, a higher average wood density of 682 kg/m³ was reported, the surfacing was performed by planing, and the MUF adhesive used was a different product. Finally, in this work, the selected displacement rate was 20% lower and the TSS setup was nonstandard due to the mounted metal guides to minimize peeling forces, especially occurring at high deformations as in the case of PUR.
The ultimate strength and the yield strength of the water-borne MUF bond lines improve with increasing and this is a strong indication of modified mechanical properties of the adhesive layer due to extractives migrating into the adhesive during curing to achieve a new equilibrium for the extractives between the adhesive and wood polymers domains. If only strength values were to be affected, the results could be attributed to interfacial effects such as lowered adhesion forces due to changes in surface energy (poor wetting) or a weak boundary layer of extractives on the wood surface.
The average apparent bond line shear moduli of specimens bonded with MUF () are 0.80 ± 0.19, 0.89 ± 0.22, 0.85 ± 0.22, and 1.0 ± 0.27 GPa for the specimen groups with 0, 4, 8 and 16 d extraction duration, respectively, with regression analysis indicating a slight increase (p ≈ 0.003) with
. In the case of specimens bonded with PUR adhesive (), the results for these groups are 0.54 ± 0.12, 0.48 ± 0.18, 0.49 ± 0.11, and 0.51 ± 0.19 GPa, respectively, with statistical analysis suggesting no change by
.
Figure 3. Bond line stiffness/apparent shear modulus Ga as a function of the extraction degree ED for the tensile shear specimens bonded with MUF (A) and PUR (B). Gray dots indicate individual results; the black dots indicate the average result per specimen group. The black dashed lines indicate the linear regression estimate and the confidence band (α = 0.05). The red dotted line indicates the average shear modulus of pure adhesive specimens (equivalent to ED = 100%) derived from tensile test data in Winkler et al.[Citation53]
![Figure 3. Bond line stiffness/apparent shear modulus Ga as a function of the extraction degree ED for the tensile shear specimens bonded with MUF (A) and PUR (B). Gray dots indicate individual results; the black dots indicate the average result per specimen group. The black dashed lines indicate the linear regression estimate and the confidence band (α = 0.05). The red dotted line indicates the average shear modulus of pure adhesive specimens (equivalent to ED = 100%) derived from tensile test data in Winkler et al.[Citation53]](/cms/asset/07e2b727-df27-4a55-ab58-8a42458dc10b/lwct_a_2314453_f0003_c.jpg)
The results were qualitatively compared to prior studies on the same adhesives.[Citation45] There, isolated birch extractives were added to the adhesives before curing the adhesive film specimens for tensile stress-strain measurements. Similarly, a softening effect – plasticization – of MUF was observed upon increasing the extractives concentration. While the tensile measurement in PUR films also indicated a softening due to birch wood extractives, here softening did not occur in situ in PUR bond lines. This demonstrates the low mobility and solubility of hydrophilic extractives from wood into the PUR adhesive during curing.
The results of are also in good agreement with derived
values from the modulus of elasticity and Poisson ratio measured on additive-free (similar to
= 100%) adhesive specimens in tension using DIC,[Citation53] with values of 0.93 and 0.35 GPa for MUF and PUR, respectively (red dashed lines in ).
Saccharides or other compounds with hydroxyl groups are able to partake in condensation reactions when curing formaldehyde-based resins such as MUF[Citation54–56] or PF.[Citation57,Citation58] End-linking molecules or higher-molecular weight compounds, thereby, decrease the final cross-linking density of the network, which would explain the observed effect on the apparent shear modulus . However, non-reacting molecules diffusing into the water-adhesive mixture during MUF curing would affect the network in a similar way by introducing defects or disturbing the network formation, and acting as plasticizers.[Citation59]
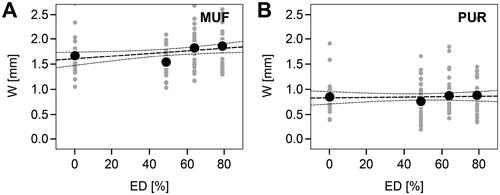
The strain distribution perpendicular to the bond line (profiles averaged along the complete overlap length 0 mm < x < 10 mm) was analyzed to detect any change in the strain distribution as a function of the extraction degree. These distribution characteristics were quantified by fitting all shear data in each specimen’s linear viscoelastic (LVE) regime: The shape parameter of the pseudo-Voigt fittings was ≈ 1 for nearly all specimens, indicating a predominantly Lorentzian peak shape. The corresponding parameter
– the full width at half maximum – of the strain distribution is 1.6 − 1.8 mm on average for MUF bonded specimens (), with a slight positive correlation (estimated coefficient
= 2 µm/%, p ≈ 0.02) to
. In the case of PUR-bonded specimens, the average
value was lower with only 0.8 − 0.9 mm () and no correlation to
was detected. These results indicate that MUF increasingly distributes the deformation to the wood regions because of a stiffness closer to that of wood.[Citation60] The high
of the MUF adhesive results in a broader deformation of the wood interphase, while with the softer PUR adhesive, the deformation is concentrated closer to the bond line. Note that the shear stress to reach
= 0.01 is accordingly lower for PUR.
Figure 4. Average shear strain distribution perpendicular to the bond line (y-axis; 0 mm < x < 10 mm). The full width at half maximum from pseudo-Voigt fitting (EquationEquation (3)
(3)
(3) ) to strain distributions in the LVE regime of the individual specimens (
) for specimens bonded with MUF (A) and PUR (B). Gray dots indicate individual results, the black dots indicate the average result. The black dashed lines indicate the linear regression estimate and the confidence band (α = 0.05).
Explanations of the slightly broader distribution of shear strain (increased ) in the case of MUF upon longer extraction treatments are given by the stiffer adhesive bond line, as seen in the higher
, and the reduced penetration of MUF adhesive during curing (see the following chapter), thus less stiffening/bulking effect on the adjacent wood interphase.
Comparing the shear strain along the bond lines (y = 0 mm) at a constant average shear strain in the bond line ( = 0.01) reveals a more pronounced stress concentration with increased shear strain peaks at both ends of the lap joints for MUF () compared to the more evenly distributed strain in PUR bond lines (). This is due to the lower stiffness of PUR – higher mechanical contrast with wood – and is in line with expectations from common lap shear models.[Citation61] However, no differentiation based on extraction duration was observed, indicating an insignificant effect of the extractives on the strain distribution for PUR.
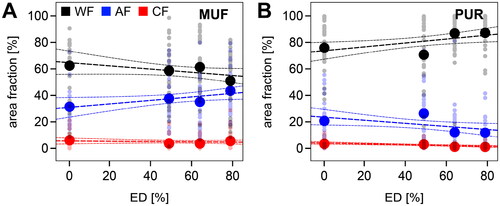
The TSS specimen’s failure mode had to be recorded for a complete interpretation of the effects of the extractive on bond line properties. Therefore, a UV imaging and processing method was successfully applied, determining the area percentages of cohesive failure in the wooden substrate , adhesion failure between wood and adhesive
, and cohesive failure in the adhesive layer
.
In , the results of the fracture analysis are presented for MUF and PUR. In the case of MUF adhesive, the average wood failure fraction was = 62, 59, 61, and 51%, the average adhesion failure
= 31, 38, 35, and 44%, and the average cohesive failure
= 6, 4, 4, and 5%, for the specimen groups with no extraction, 4 d, 8 d, and 16 d extraction duration, respectively. For PUR-bonded specimens, the average wood failure fraction was
= 76, 71, 87, and 87%, the average adhesion failure
= 21, 26, 12, and 11%, and the average cohesive failure
= 3, 3, 1, and 1%, for the specimen groups with no extraction, 4 d, 8 d, and 16 d extraction duration, respectively.
Figure 5. Failure modes as a function of extraction degree ED. Area fractions of wood failure (WF, black), adhesive failure (AF, blue), and cohesive failure in the adhesive (CF, red) for specimens bonded with MUF (A) and PUR (B). Small dots indicate individual results and large dots indicate the average result per specimen group. The black dashed lines indicate the linear regression of the individual results and the confidence band (α = 0.05).
When comparing the aforementioned TSS measurements in Konnerth et al.,[Citation19] where average WF was reported to be >90% for both PUR and MUF, the in this work was lower, especially for MUF-bonded specimens.
Given the mixed mode failure with a generally high percentage, the observed trends for
as a function of
could be related to a simple geometrical effect due to changes in the adhesive penetration behavior (see results of bond line morphology in next chapter): As MUF penetration is lower upon increasing
, the resulting thicker bond line covers a broader plane around the peak stress and the interfaces to the adherend are located at lower stress regions. Thus the adhesive can be more likely to fracture. The opposite can be concluded for PUR-bonded specimens, where an increased penetration depth was assumed upon increasing
resulting in thinner bond lines and, as a consequence, in lower probabilities to fracture in the adhesive layer.
A general negative correlation between the wood failure percentage and shear strength was observed () for the results of all specimens, with a higher correlation in the case of MUF. This shows that a high percentage is not necessarily an indication of a strong adhesive bond but rather a lower strength in the wood or the wood-adhesive interphase. Moreover, in the case of mixed failure modes, the area percentages do not indicate the origin of the failure, which further complicates interpretations regarding bond line quality.
Bond line morphology
The effects of extractives on the curing reactivity shown in a previous study[Citation45] for MUF and PUR adhesives led to the question of whether they affect the process of bond line interphase formation. This can be characterized by comparing the extent of adhesive penetration and the bond line thickness. Therefore, a processing methodology using UV fluorescence microscopy imaging was developed, which successfully allowed quantifying the bond line and adhesive penetration.
In the case of MUF, the average bond line thickness () was slightly increasing at higher with
of 180 µm both without extraction and specimens bonded after 4 d extraction, 201 µm after 8 d extraction, and 211 µm after 16 d extraction. Accordingly, the average adhesive penetration factor
lowered with
on average (), from 32 × 10−³ mm³/mm for specimens with untreated wood to 21 × 10−³ mm³/mm for specimens bonded after 4 d extraction and 10–11 × 10−³ mm³/mm in the cases of 8 d and 16 d extraction, suggesting a reduction of MUF adhesive flow from the bond line to the interphase upon increased
. This can be caused by a faster setting of MUF due to the absence of molecules that interfere with the crosslinking process or introduce defects to the network.[Citation45]
Figure 6. Mean bond line thickness ((A) MUF bond lines; (B) PUR bond lines) and Adhesive Penetration Factor
((C) MUF bond lines; (D) PUR bond lines), shown as a function of the extraction degree
. Gray dots indicate individual results, and the black dots indicate the average result per specimen group. The black dashed lines indicate the linear regression estimate and the confidence band (α = 0.05).
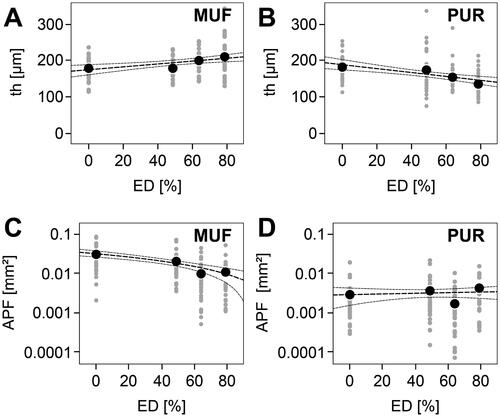
The average bond line thickness of PUR bonded specimens was slightly decreasing () with
with 183, 175, 155, and 137 µm for extraction durations of 0, 4, 8, and 16 d, respectively. However, the adhesive penetration of PUR-bonded specimens was unaffected by
(), with
of 2–4 × 10−³ mm³/mm, no significant correlation and high variance of individual results. Hypothetically, hydrophilic extractives, e.g., polyols, such as lignans,[Citation62] or carboxylic acids, in the wood can react with isocyanate groups of PUR,[Citation63] thereby reducing the mobility and flow of the penetrating adhesive, which would lead to increased bond line thickness. The higher bond line thickness at lower
could not be explained by changes in the observed CO2 cavity formation: The average bond line porosity
actually increased slightly with
(see there).
The observed effects on adhesive penetration are in line with previous results of the mechanical experiments and can be explained by the effects seen in rheological curing:[Citation45] There, it was shown that hydrophilic birch extractives had an inhibiting or minor catalyzing effect on the curing rates of MUF or PUR adhesives, respectively. Accordingly, a low (i.e., higher extractives concentration in wood) results in an increased adhesive flow of MUF adhesive and, thus, higher adhesive penetration. Also, a slight increase in PUR reactivity was indicated by shorter durations to reach the gel point in the presence of extractives, which could be attributed to the increased bond line thickness seen at lower
.
Conclusions
The effects of water-soluble birch extractives on the mechanical and bond line properties when gluing with a water-borne hydrophilic (MUF) and a water-free hydrophobic (PUR) adhesive were studied. The classes and extraction kinetics of these low-molar mass molecules were evaluated and identified. The study showed how they affect the bond line stiffness and yielding of glued birch wood as a function of the extraction degree. Moreover, morphological bond line parameters (thickness and penetration depth) were obtained using an automated image processing analysis.
The extraction treatment of birch wood resulted in the case of the PUR adhesive in a slight increase in percentage. Also, a thinner PUR bond line indicated an increased adhesive flow. However, the PUR bulk adhesive properties and the mechanical bond line performance were not affected, as no significant changes in
or
were observed for PUR. The extraction treatment resulted in stronger MUF bond lines with similar increases in
and
. Extrapolation to a full extraction degree (
= 100%) estimated increases in
of 17% and
of 29%, while the extrapolated increase was 28% for bond line stiffness
.
The of MUF bond lines slightly but significantly increased with
. This indicates, removing extractives from the adherend resulted in a polymer network of lesser defects, which is not happening to PUR bond lines. In the case of MUF bond lines, the results of bond line thickness and adhesive penetration provide an in situ confirmation of the observed reduction in curing reactivity due to the presence of birch extractives in Engelhardt et al.[Citation45] The removal of extractives also coincided with a slightly lower
percentage. As these effects are assumed to originate from the diffusion of extractives during bonding, the most affected areas are in the interphase, which might shift the failure location away from the clear bond line, leading to an increased wood failure with lower
.
In summary, while hydrophilic extractives content in birch wood was not significantly affecting PUR bond properties, some improvement could be gained from extraction for MUF bond line strength. However, the reduction of bond strength due to extractives is small enough to consider MUF bond lines on pristine birch wood a viable option for EWPs, which might be further optimized by formulation adaptions, e.g., using faster-curing mixtures to alleviate extractives diffusion with higher acidic catalyst concentration or increased pH buffer capacity.
Remarks
The data used in this publication are available upon reasonable request.
Authors contributions
M.E. designed the study, performed and supervised experimental work, analyzed the data and wrote the manuscript. T.B. participated in experimental method design, results discussions and contributed to the manuscript. M.G. supervised the untargeted metabolomics UHPLC measurements. C.M. processed untargeted metabolomics data. K.R. supervised the study and contributed to discussing the results and manuscript polishing. A.S.F. designed the study, supervised the experimental work, analyzed data and revised the manuscript.
Supplemental Material
Download MS Word (4.7 MB)Acknowledgements
We thank Dr. Elisabeth Windeisen-Holzhauser and her laboratory staff Andreas Tenz, Claudia Strobel and Snežana Šajkaš Sajdl for their exceptional support in the chemistry laboratory of Holzforschung München and Frank Moosmann and Roland Braun for their continuous and unconditional support of our research activities.
Disclosure statement
No potential conflict of interest was reported by the author(s).
Submission Disclosure statement
This article has not been published previously and is not under consideration for publication elsewhere. Its publication is approved by all authors and the responsible authorities where the work was carried out. If accepted, this work will not be published elsewhere, including electronically in the same form, in English or any other language, without the copyright-holder’s written consent.
References
- McBain, J. W.; Hopkins, D. G. On Adhesives and Adhesive Action. J. Phys. Chem. 1925, 29, 188–204. DOI: 10.1021/j150248a008.
- Browne, F. L.; Brouse, D. Nature of Adhesion between Glue and Wood: A Criticism of the Hypothesis That the Strength of Glued Wood Joints is Due Chiefly to Mechanical Adhesion. Ind. Eng. Chem. 1929, 21, 80–84. DOI: 10.1021/ie50229a023.
- Marian, J. E.; Stumbo, D. A. Adhesion in Wood Part. II. Physico-Chemical Surface Phenomena and the Thermodynamic Approach to Adhesion. Holzforschung 1962, 16, 168–180. DOI: 10.1515/hfsg.1962.16.6.168.
- Bikerman, J. J. The Science of Adhesive Joints; Elsevier, London, 1968. DOI: 10.1016/C2013-0-12556-1.
- Collett, B. M. A Review of Surface and Interfacial Adhesion in Wood Science and Related Fields. Wood Sci. Technol. 1972, 6, 1–42. DOI: 10.1007/BF00351806.
- Packham, D. E. The Mechanical Theory of Adhesion—Changing Perceptions 1925-1991. J Adhesion 1992, 39, 137–144. DOI: 10.1080/00218469208026545.
- Packham, D. E.; Johnston, C. Mechanical Adhesion: Were McBain and Hopkins Right? An Empirical Study. Int. J. Adhes. Adhes. 1994, 14, 131–135. DOI: 10.1016/0143-7496(94)90008-6.
- Chen, C. M. Effect of Extractive Removal on Adhesion and Wettability of Some Tropical Woods. For. Prod. J. 1970, 20, 36–41.
- Hse, C.; Kuo, M. Influence of Extractives on Wood Gluing and Finishing: A Review. For. Prod. J. 1988, 38, 52–56.
- Künninger, T.; Fischer, A.; Bordeanu, N. C.; Richter, K. Water Soluble Larch Extractive: Impact on 1P-PUR Wood Bonds. In Wood Structure and Properties ‘06: Proceedings of Abstracts of the 5th International Symposium; Kurjatko, S., Kúdela, J., & Lagaňa, R., Eds.; Arbora Publishers: Zvolen, Slovakia, 2006, pp 71–76.
- Bockel, S.; Mayer, I.; Konnerth, J.; Harling, S.; Niemz, P.; Swaboda, C.; Beyer, M.; Bieri, N.; Weiland, G.; Pichelin, F. The Role of Wood Extractives in Structural Hardwood Bonding and Their Influence on Different Adhesive Systems. Int. J. Adhes. Adhes. 2019, 91, 43–53. DOI: 10.1016/j.ijadhadh.2019.03.001.
- Brockerhoff, E. G.; Liebhold, A. M. Ecology of Forest Insect Invasions. Biol. Invasions 2017, 19, 3141–3159. DOI: 10.1007/s10530-017-1514-1.
- Seidl, R.; Thom, D.; Kautz, M.; Martin-Benito, D.; Peltoniemi, M.; Vacchiano, G.; Wild, J.; Ascoli, D.; Petr, M.; Honkaniemi, J.; et al. Forest Disturbances under Climate Change. Nat. Clim. Chang. 2017, 7, 395–402. DOI: 10.1038/nclimate3303.
- Lindner, M.; Fitzgerald, J. B.; Zimmermann, N. E.; Reyer, C.; Delzon, S.; Van Der Maaten, E.; Schelhaas, M.-J.; Lasch, P.; Eggers, J.; Van Der Maaten-Theunissen, M.; et al. Climate Change and European Forests: What Do We Know, What Are the Uncertainties, and What Are the Implications for Forest Management? J. Environ. Manage. 2014, 146, 69–83. DOI: 10.1016/j.jenvman.2014.07.030.
- Oehmichen, K.; Klatt, S.; Gerber, K. The Alternative WEHAM Scenarios: Wood Preference, Conservation Preference, and Trend Update - Scenario Development, Results, and Analysis (Die Alternativen WEHAM-Szenarien: Holzpräferenz, Naturschutzpräferenz Und Trendfortschreibung - Szenarienentwicklung, Ergebnisse Und Analyse); Johann Heinrich von Thünen-Institut: Germany, 2018.
- Bockel, S. Structural Bonding of European Beech Wood (Fagus Sylvatica L.) with Polyurethane Adhesives – A Study Investigating Various Aspects of Wood-Adhesive Interactions with a Focus on Wood E., xtractives. Dissertation, Universität für Bodenkultur Wien, Vienna, Austria, 2020.
- Wang, Y.-S. Influence of Extractives on Bonding Properties of White Oak. Dissertation, Iowa State University, Ames, 1992. p 6385210. DOI: 10.31274/rtd-180813-9568.
- Knorz, M. Investigation of Structurally Bonded Ash (Fraxinus Excelsior L.) as Influenced by Adhesive Type and Moisture. Dissertation, Technische Universität München, München, 2015.
- Konnerth, J.; Kluge, M.; Schweizer, G.; Miljković, M.; Gindl-Altmutter, W. Survey of Selected Adhesive Bonding Properties of Nine European Softwood and Hardwood Species. Eur. J. Wood Prod 2016, 74, 809–819. DOI: 10.1007/s00107-016-1087-1.
- Jeitler, G.; Augustin, M. Is Birch the better Beech? Grading, processing and mechanical properties of birch Glulam and birch CLT (Ist Birke die bessere Buche? Mechanische Eigenschaften und Referenzprojekte aus BIRKE|BSH&BSP). In Tagungsband Internationales Holzbau-Forum (IHF 2016); Garmisch, 2016.
- Schlotzhauer, P.; Nelis, P. A.; Bollmus, S.; Gellerich, A.; Militz, H.; Seim, W. Effect of Size and Geometry on Strength Values and MOE of Selected Hardwood Species. Wood Mater. Sci. Eng. 2017, 12, 149–157. DOI: 10.1080/17480272.2015.1073175.
- Boruszewski, P. J.; Borysiuk, P.; Mamiński, M. Ł.; Grześkiewicz, M. Gluability of Thermally Modified Beech (Fagus Silvatica L.) and Birch (Betula Pubescens Ehrh.) Wood. Wood Mater. Sci. Eng. 2011, 6, 185–189. DOI: 10.1080/17480272.2011.598239.
- Morin-Bernard, A.; Blanchet, P.; Dagenais, C.; Achim, A. Use of Northern Hardwoods in Glued-Laminated Timber: A Study of Bondline Shear Strength and Resistance to Moisture. Eur. J. Wood Prod. 2020, 78, 891–903. DOI: 10.1007/s00107-020-01572-3.
- Hass, P.; Wittel, F. K.; Mendoza, M.; Herrmann, H. J.; Niemz, P. Adhesive Penetration in Beech Wood: Experiments. Wood Sci. Technol. 2012, 46, 243–256. DOI: 10.1007/s00226-011-0410-6.
- Ching, D. J.; Kamke, F. A.; Bay, B. K. Methodology for Comparing Wood Adhesive Bond Load Transfer Using Digital Volume Correlation. Wood Sci. Technol. 2018, 52, 1569–1587. DOI: 10.1007/s00226-018-1048-4.
- Jakes, J. E.; Frihart, C. R.; Hunt, C. G.; Yelle, D. J.; Plaza, N. Z.; Lorenz, L.; Grigsby, W.; Ching, D. J.; Kamke, F.; Gleber, S.-C.; et al. X-Ray Methods to Observe and Quantify Adhesive Penetration into Wood. J. Mater. Sci. 2019, 54, 705–718. DOI: 10.1007/s10853-018-2783-5.
- Sernek, M.; Resnik, J.; Kamke, F. A. Penetration of Liquid Urea-Formaldehyde Adhesive into Beech Wood. Wood Fiber Sci. 1999, 31, 41–48.
- Bastani, A.; Adamopoulos, S.; Koddenberg, T.; Militz, H. Study of Adhesive Bondlines in Modified Wood with Fluorescence Microscopy and X-Ray Micro-Computed Tomography. Int. J. Adhes. Adhes. 2016, 68, 351–358. DOI: 10.1016/j.ijadhadh.2016.04.006.
- Pittman, C. U.; Kim, M. G.; Nicholas, D. D.; Wang, L.; Kabir, F. R. A.; Schultz, T. P.; INGram, L. L. Wood Enhancement Treatments I. Impregnation of Southern Yellow Pine with Melamine-Formaldehyde and Melamine-Ammeline-Formaldehyde Resins. J. Wood Chem. Technol. 1994, 14, 577–603. DOI: 10.1080/02773819408003114.
- Qin, Y.; Dong, Y.; Li, J. Effect of Modification with Melamine–Urea–Formaldehyde Resin on the Properties of Eucalyptus and Poplar. J. Wood Chem. Technol. 2019, 39, 360–371. DOI: 10.1080/02773813.2019.1636821.
- Konnerth, J.; Harper, D.; Lee, S.-H.; Rials, T. G.; Gindl, W. Adhesive Penetration of Wood Cell Walls Investigated by Scanning Thermal Microscopy (SThM). Holzforschung 2008, 62, 91–98. DOI: 10.1515/HF.2008.014.
- Casdorff, K.; Kläusler, O.; Gabriel, J.; Amen, C.; Lehringer, C.; Burgert, I.; Keplinger, T. About the Influence of a Water-Based Priming System on the Interactions between Wood and One-Component Polyurethane Adhesive Studied by Atomic Force Microscopy and Confocal Raman Spectroscopy Imaging. Int. J. Adhes. Adhes. 2018, 80, 52–59. DOI: 10.1016/j.ijadhadh.2017.10.001.
- Jakes, J. E.; Hunt, C. G.; Yelle, D. J.; Lorenz, L.; Hirth, K.; Gleber, S.-C.; Vogt, S.; Grigsby, W.; Frihart, C. R. Synchrotron-Based X-Ray Fluorescence Microscopy in Conjunction with Nanoindentation to Study Molecular-Scale Interactions of Phenol–Formaldehyde in Wood Cell Walls. ACS Appl. Mater. Interfaces 2015, 7, 6584–6589. DOI: 10.1021/am5087598.
- Gindl, W.; Schöberl, T.; Jeronimidis, G. The Interphase in Phenol–Formaldehyde and Polymeric Methylene Di-Phenyl-Di-Isocyanate Glue Lines in Wood. Int. J. Adhes. Adhes. 2004, 24, 279–286. DOI: 10.1016/j.ijadhadh.2003.10.002.
- Konnerth, J.; Gindl, W. Mechanical Characterisation of Wood-Adhesive Interphase Cell Walls by Nanoindentation. Holzforschung 2006, 60, 429–433. DOI: 10.1515/HF.2006.067.
- Konnerth, J.; Valla, A.; Gindl, W. Nanoindentation Mapping of a Wood-Adhesive Bond. Appl. Phys. A 2007, 88, 371–375. DOI: 10.1007/s00339-007-3976-y.
- Stöckel, F.; Konnerth, J.; Moser, J.; Kantner, W.; Gindl-Altmutter, W. Micromechanical Properties of the Interphase in pMDI and UF Bond Lines. Wood Sci. Technol. 2012, 46, 611–620. DOI: 10.1007/s00226-011-0432-0.
- Yan, Y.; Ze-Hui, J.; Frihart, C.; Jakes, J. Mechanical Characterization of Wood- Adhesive Interphase with an Improved Nanoindentation Technique. In Proceedings of the 55th International Convention of Society of Wood Science and Technology August 27-31; Beijing, China, 2012.
- Rindler, A.; Hansmann, C.; Konnerth, J. The Effect of Moisture on the mechanical response of Wood, Adhesive and Their Interphase by Means of Nanoindentation. Wood Sci. Technol. 2019, 53, 729–746. DOI: 10.1007/s00226-019-01100-4.
- Müller, U.; Veigel, S.; Follrich, J.; Gabriel, J.; Gindl, W. Performance of One Component Polyurethane in Comparison to Other Wood Adhesives. In Forest Products Society 2010. Conference Proceedings of the International Conference on Wood Adhesives 2009; Frihart, C. R., Hunt, C. G., & Moon, R. J., Eds. Forest Products Society: Lake Tahoe, Nevada, USA, 2009; pp 196–202
- Serrano, E.; Enquist, B. Contact-Free Measurement and Non-Linear Finite Element Analyses of Strain Distribution along Wood Adhesive Bonds. Holzforschung 2005, 59, 641–646. DOI: 10.1515/HF.2005.103.
- Özparpucu, M.; Wolfrum, T.; Windeisen-Holzhauser, E.; Knorz, M.; Richter, K. Combined FTIR Spectroscopy and Rheology for Measuring Melamine Urea Formaldehyde (MUF) Adhesive Curing as Influenced by Different Wood Extracts. Eur. J. Wood Prod. 2020, 78, 85–91. DOI: 10.1007/s00107-019-01481-0.
- Özparpucu, M.; Sánchez-Ferrer, A.; Schuh, M.; Wilhelm, B.; Sarkar, R.; Reif, B.; Windeisen-Holzhauser, E.; Richter, K. Acidic Wood Extractives Accelerate the Curing Process of Emulsion Polymer Isocyanate Adhesives. J. Appl. Polym. Sci. 2022, 139, 52189. DOI: 10.1002/app.52189.
- Özparpucu, M.; Windeisen-Holzhauser, E.; Wegener, G.; Richter, K. A New Analytical Approach to Investigate the Influence of Wood Extracts on the Curing Properties of Phenol-Resorcinol–Formaldehyde (PRF) Adhesives. Wood Sci. Technol. 2022, 56, 349–365. DOI: 10.1007/s00226-022-01364-3.
- Engelhardt, M.; Böger, T.; Gigl, M.; Meng, C.; Soprunyuk, V.; Schranz, W.; Richter, K.; Sánchez-Ferrer, A. Interactions of Hydrophilic Birch Wood (Betula Pendula Roth) Extractives with Adhesives for Load-Bearing Timber Structures. Int. J. Adhes. Adhes. 2023, 125, 103447. DOI: 10.1016/j.ijadhadh.2023.103447.
- Türmerleim GmbH. Kauramin® Resin 683 Liquid with Kauramin® Hardener 688 Liquid in Wood Construction, Technical Data Sheet (German); Türmerleim GmbH: Ludwigshafen, 2008.
- Henkel & Cie.AG. LOCTITE® HB S309 PURBOND, Technical Data Sheet (German); Henkel & Cie. AG Sempach Station: Switzerland, 2015.
- Sánchez-Ferrer, A.; Engelhardt, M.; Richter, K. Anisotropic Wood–Water Interactions Determined by Gravimetric Vapor Sorption Experiments. Cellulose 2023, 30, 3869–3885. DOI: 10.1007/s10570-023-05093-z.
- EN 302-1. 2013 Adhesives for Load-Bearing Timber Structures - Test Methods - Part 1: Determination of Longitudinal Tensile Shear Strength; European Committee for Standardization (CEN), Series Ed.; CEN, 2019.
- Hass, P.; Müller, C.; Clauss, S.; Niemz, P. Influence of Growth Ring Angle, Adhesive System and Viscosity on the Shear Strength of Adhesive Bonds. Wood Material Science & Engineering 2009, 4, 140–146. DOI: 10.1080/17480270903421529.
- Ross, C. T. F.; Bird, J.; Little, A. Mechanics of Solids, 3rd ed.; Routledge, Taylor & Francis Group: London , New York, 2022.
- Lachowicz, H.; Wróblewska, H.; Sajdak, M.; Komorowicz, M.; Wojtan, R. The Chemical Composition of Silver Birch (Betula Pendula Roth.) Wood in Poland Depending on Forest Stand Location and Forest Habitat Type. Cellulose 2019, 26, 3047–3067. DOI: 10.1007/s10570-019-02306-2.
- Winkler, C.; Raskop, S.; Sydow, S.; Engelhardt, M. Wood Adhesives: Factors Influencing the Determination of Mechanical Properties (Holzklebstoffe: Einflussfaktoren Auf Die Ermittlung Mechanischer Kennwerte). In Tagungsband Des 20; André Wagenführ, Ed.; Holztechnologischen Kolloquiums Dresden: Dresden, 2022.
- Sridach, W.; Jonjankiat, S.; Wittaya, T. Effect of Citric Acid, PVOH, and Starch Ratio on the Properties of Cross-Linked Poly(Vinyl Alcohol)/Starch Adhesives. J. Adhes. Sci. Technol. 2013, 27, 1727–1738. DOI: 10.1080/01694243.2012.753394.
- Wang, X.; Deng, Y.; Li, Y.; Kjoller, K.; Roy, A.; Wang, S. In Situ Identification of the Molecular-Scale Interactions of Phenol-Formaldehyde Resin and Wood Cell Walls Using Infrared Nanospectroscopy. RSC Adv. 2016, 6, 76318–76324. DOI: 10.1039/C6RA13159J.
- Emmerich, L.; Bollmus, S.; Militz, H. Wood Modification with DMDHEU (1.3-Dimethylol-4.5-Dihydroxyethyleneurea) – State of the Art, Recent Research Activities and Future Perspectives. Wood Mater. Sci. Eng. 2019, 14, 3–18. DOI: 10.1080/17480272.2017.1417907.
- Vázquez, G.; Freire, S.; Rodríguez-Bona, C.; González, J.; Antorrena, G. Structures, and Reactivities with Formaldehyde, of Some Acetosolv Pine Lignins. J. Wood Chem. Technol. 1999, 19, 357–378. DOI: 10.1080/02773819909349617.
- Conner, A. H.; River, B. H.; Lorenz, L. F. Carbohydrate Modfied Phenol-Formaldehyde Resins. J. Wood Chem. Technol. 1986, 6, 591–613. DOI: 10.1080/02773818608085246.
- Immergut, E. H.; Mark, H. F. Plasticization and Plasticizer Processes. In Advances in Chemistry; Platzer, N. A. J., Ed. American Chemical Society: Washington, D.C., 1965; Vol. 48. DOI: 10.1021/ba-1965-0048.
- Konnerth, J.; Gindl, W.; Müller, U. Elastic Properties of Adhesive polymers. I. Polymer Films by Means of Electronic Speckle Pattern Interferometry. J Appl. Polym. Sci. 2007, 103, 3936–3939. DOI: 10.1002/app.24434.
- Quispe Rodríguez, R.; de Paiva, W. P.; Sollero, P.; Bertoni Rodrigues, M. R.; de AlbuqueRQue, É. L. Failure Criteria for Adhesively Bonded Joints. International Journal of Adhesion and Adhesives 2012, 37, 26–36. DOI: 10.1016/j.ijadhadh.2012.01.009.
- West, H.; Banks, W. B. Topochemistry of the Wood-Isccyanate Reaction an Analysis of Reaction Profiles. J. Wood Chem. Technol. 1986, 6, 411–425. DOI: 10.1080/02773818608085235.
- Ionescu, M. Chemistry and Technology of Polyols for Polyurethanes, 2nd ed.; Smithers Rapra: Shawbury, 2016.
- Kessner, D.; Chambers, M.; Burke, R.; Agus, D.; Mallick, P. ProteoWizard: Open Source Software for Rapid Proteomics Tools Development. Bioinformatics 2008, 24, 2534–2536. DOI: 10.1093/bioinformatics/btn323.
- Tautenhahn, R.; Böttcher, C.; Neumann, S. Highly Sensitive Feature Detection for High Resolution LC/MS. BMC Bioinf. 2008, 9, 504. DOI: 10.1186/1471-2105-9-504.
- Benton, H. P.; Want, E. J.; Ebbels, T. M. D. Correction of Mass Calibration Gaps in Liquid Chromatography–Mass Spectrometry Metabolomics Data. Bioinformatics 2010, 26, 2488–2489. DOI: 10.1093/bioinformatics/btq441.
- Smith, C. A.; Want, E. J.; O'Maille, G.; Abagyan, R.; Siuzdak, G. XCMS: Processing Mass Spectrometry Data for Metabolite Profiling Using Nonlinear Peak Alignment, Matching, and Identification. Anal. Chem. 2006, 78, 779–787. DOI: 10.1021/ac051437y.
- Tsugawa, H.; Cajka, T.; Kind, T.; Ma, Y.; Higgins, B.; Ikeda, K.; Kanazawa, M.; VanderGhEynst, J.; Fiehn, O.; Arita, M. MS-DIAL: Data-Independent MS/MS Deconvolution for Comprehensive Metabolome Analysis. Nat. Methods 2015, 12, 523–526. DOI: 10.1038/nmeth.3393.
- Dührkop, K.; Nothias, L.-F.; Fleischauer, M.; Reher, R.; Ludwig, M.; Hoffmann, M. A.; Petras, D.; Gerwick, W. H.; Rousu, J.; Dorrestein, P. C.; BöcKEr, S. Systematic Classification of Unknown Metabolites Using High-Resolution Fragmentation Mass Spectra. Nat. Biotechnol. 2021, 39, 462–471. DOI: 10.1038/s41587-020-0740-8.
- Keller, B. O.; Sui, J.; Young, A. B.; Whittal, R. M. Interferences and Contaminants Encountered in Modern Mass Spectrometry. Anal. Chim. Acta. 2008, 627, 71–81. DOI: 10.1016/j.aca.2008.04.043.
- Djoumbou Feunang, Y.; Eisner, R.; Knox, C.; Chepelev, L.; Hastings, J.; Owen, G.; Fahy, E.; Steinbeck, C.; Subramanian, S.; Bolton, E.; et al. ClassyFire: Automated Chemical Classification with a Comprehensive, Computable Taxonomy. J. Cheminform 2016, 8, 61. DOI: 10.1186/s13321-016-0174-y.
- VDI. VDI 2626 Part 1:2019 Optical Measuring Procedures - Digital Image Correlation; Basics, Acceptance Test, and Iterim Check; Verein Deutscher Ingenieure e.V. Series Ed.; VDI/VDE, 2019; p 51.
- Preibisch, S.; Saalfeld, S.; Tomancak, P. Globally Optimal Stitching of Tiled 3D Microscopic Image Acquisitions. Bioinformatics 2009, 25, 1463–1465. DOI: 10.1093/bioinformatics/btp184.
- Floyd, R. W. Algorithm 97: Shortest Path. Commun. ACM 1962, 5, 345–345. DOI: 10.1145/367766.368168.
- Lee, T. C.; Kashyap, R. L.; Chu, C. N. Building Skeleton Models via 3-D Medial Surface Axis Thinning Algorithms. CVGIP 1994, 56, 462–478. DOI: 10.1006/cgip.1994.1042.
- Polder, G.; Hovens, H. L. E.; Zweers, A. J. Measuring Shoot Length of Submerged Aquatic Plants Using Graph Analysis. In Proceedings of the ImageJ User and Developer Conference 2010; Centre de Recherche Public Henri Tudor: Luxembourg, 2010; pp 172–177.
- Arganda-Carreras, I.; Fernández-González, R.; Muñoz-Barrutia, A.; Ortiz-De-Solorzano, C. 3D Reconstruction of Histological Sections: Application to Mammary Gland Tissue. Microsc Res Tech 2010, 73, 1019–1029. DOI: 10.1002/jemt.20829.
- Dougherty, R.; Kunzelmann, K.-H. Computing Local Thickness of 3D Structures with ImageJ. MAM 2007, 13, 1678–1679. DOI: 10.1017/S1431927607074430.
Appendix A
– Analysis of extractives
Within the extraction periods, three sets of samples, with four samples each, were taken. Samplings were done every 24 h, immediately before solvent exchange. Single 300 mL samplings (number of samplings ) made the first set of samples after days 1–4. The samples in the second set for the 8 days extraction procedure were obtained by sampling 150 mL each on two consecutive days (
) after days 1–8. Lastly, samples in the third set (16 days extraction procedure) were obtained by sampling 75 mL over four consecutive days (
) until day 16. In this way, all water sample sets with 4 × 300 mL represent the cumulative extraction behavior, and deviations in subsequent handling and analysis processes can be detected by comparing sample sets. Moreover, the sampling frequency is thereby adjusted to the exponential nature of the extraction diffusion process, yielding more data points in earlier extraction stages. To minimize possible bias due to any secondary effects of the water imbibition, the reference boards with no extraction were soaked without excess water by repeated wetting of the surfaces and reconditioned in the same manner as the extracted board.
The water fraction of the extract solutions was removed after filtration (P4: 10–16 µm glass filter) using a rotary evaporator (35 °C/50 mbar) and a lyophilizer, retrieving a dry powder. Additional samples of the solvent water before the extraction were taken and processed in the same way to determine . The extractives content as the ratio of dry extractives
(t) removed after each 24 h sampling period
to the dry wood mass
was calculated based on the sample solid mass
, the total extraction water volume
, the sampled water volume
, as well as the wood’s mass
and moisture content
before extraction.
(A1)
(A1)
The extractive samples were then dissolved with a concentration of 1 mg/mL in methanol/water (10:90, V/V) and analyzed in randomized order by ultra-high pressure liquid chromatography (Shimadzu Nexera UHPLC) coupled with a time-of-flight mass spectrometer (Sciex TripleTOF6000). All extractive samples were analyzed by separation with a HILIC column and in reverse phase with a C18 column, both in positive and negative mode. The parameters for measurement are detailed in .
Table A1. UHPLC-ESI-TOF-MS setup and measurement parameters.
De-noised centroid peaks in open mzXML format were obtained using the ProteoWizard[Citation64] ms-convert tool. The bioconductor/R package xcms was used for data processing and feature identification: The matched Filter algorithm in xcms[Citation65,Citation66] was used for peak identification. Applying the peak density method,[Citation67] the peaks were grouped into a global compound list. Due to the sample-wise peak finding, missing peaks of compounds were imputed according to their range and retention time.
All compounds detected underwent a review process at which database annotation results via MSDIAL [Citation68] using the xmcs pipeline, and molecular structure estimation via Sirius & FingerID software.[Citation69] Additionally, cross-references to contaminant lists,[Citation70] the release pattern (diffusion kinetics, described below), and neural-net-based class estimations by CANOPUS [Citation71] were considered in the review. Further, a manual grouping of compounds with identical and release patterns was necessary to merge the abundances of identical substances recognized at multiple retention times because of clustering effects in the columns.
Appendix B
– Bonding and mechanical analysis
Both untreated and water-extracted boards were sanded with 220-grit sandpaper to 5 mm thickness (surface preparation) before bonding. Before and during the bonding of the pairs of boards with MUF or PUR adhesive, boards were kept in equilibrium conditions at 20 ± 1 °C, 65 ± 3%RH. The realized processing parameters for bonding are listed in .
Table B1. Bonding parameters for the applied adhesive systems: average ± standard deviation of all boards.
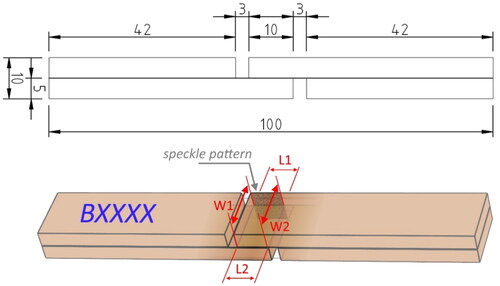
Groups with wood after 0, 4, 8 and 16 days of extraction with both MUF and PUR adhesive were bonded directly after surface preparation, yielding 36 shear specimens (dimension in , top) per specimen group.
The specimens’ overlap area of 10 × 10 mm side-face was coated with a thin white layer and a fine black speckle pattern using an airbrush (0.1 mm nozzle, 3 bar air pressure at 15 cm distance) and acrylic paint. This area’s shear deformation was monitored full-field throughout the tensile shear measurement.
Figure B1. Top: Side view of the tensile shear specimen, dimensions in mm. Bottom: Tensile shear specimen with an indication of overlap area measurements (red) and positioning of the speckle pattern for DIC shear deformation analysis. Top and bottom indications refer to the orientation of specimen ends during mechanical testing.
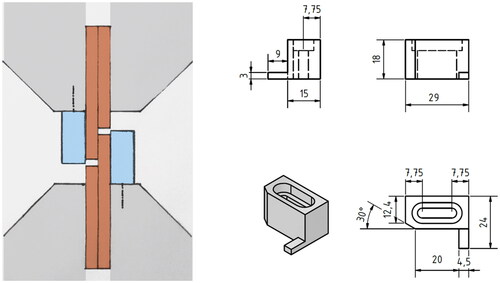
A material testing machine 1455 equipped with a 20 kN Xforce K load cell (ISO 7500-1 accuracy class: 1 from 40 N; 0.5 from 200 N) and wedge screw grips, type 8406, (ZwickRoell GmbH & Co.KG, Ulm, Germany) for parallel clamping was used for tensile shear testing. Metal guides were mounted to the grips () to minimize bending and peeling forces in the specimen’s overlap area. The tensile shear measurements were conducted with a constant 1 mm/min displacement rate.
Figure B2. Left: tensile shear setup schematic in the universal test machine: specimen in brown, parallel clamping system in gray, metal guides in blue. Right: Drawing of the metal guides.
To measure the deformation behavior of the side face of the tensile shear specimen’s overlap region and bond line, an Aramis 12 MP 3D digital image correlation (DIC) system (GOM GmbH, Braunschweig, Germany), equipped with 2 Baumer VCXU-123M.K06 monochrome cameras with Titanar B 75 lenses oriented at a 25° incident angle in vertical alignment to the specimen, was installed with a working distance of 30 cm. This setup resulted in a field of view of ∼20 by 15 mm spatial resolution of the surface strain of 70–80 µm with a local strain reference length of ∼0.1 mm. The accuracy of the digital image correlation system’s shear strain data was evaluated based on VDI/VDE 2626 Part 1,[Citation72] resulting in a zero deformation deviation = 6 × 10⁻⁴ (mean-squared error of
for specimens in undeformed state). The measurement frequency was set to 1 Hz and increased to 10 Hz in the final second prior to shear failure via a ring buffer. During measurement, the material testing machine’s stress and displacement data was synchronized to the deformation data via analog voltage signals (16-bit DAC/ADC). All deformation data is mapped to the initial coordinates of the overlap area, with the x-axis oriented along the bond line and the y-axis perpendicular to the bond line (y = 0 at the bond line center).
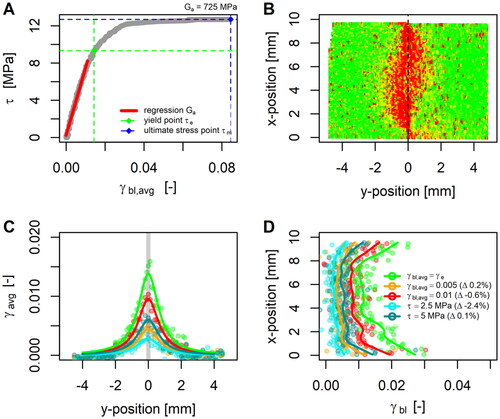
A graphical representation of the calculation of ,
and
described in the experimental section is shown in . The shear deformation profiles along the bond line and perpendicular to the bond line are constructed by subsetting the shear deformation data () at y = 0 mm and averaging the deformation data of the entire overlap area in 0.1 mm steps in the y-position, respectively. The profiles generated for reference conditions (at constant stress or average bond line shear deformation or profile at yield point) are shown in . Δ specifies the relative deviation to the given criteria due to the limited frame rate, which, however, is distributed around
≈ 0% and, therefore, considered negligible for group-wise comparisons and LVE analysis.
Figure B3. Tensile shear stress-strain measurement evaluation with DIC deformation data. (A) applied shear stress τ in the bond line as a function of average shear deformation in the bond line (grey curve), linear regression for calculation of Ga, elastic limit (yield strength)
e and point of maximum shear strength
m (blue). (B) distribution of shear deformation of the overlap surface area (green = 0, red = high strain) at the yield point, the black dashed line at y = 0 indicates bond line position. (C) average shear strain profile as a function of perpendicular distance to the bond line (y-coordinate) at selected states of measurement (cf. color legend in (D). Lines are pseudo-Voigt fits (EquationEquation 3
(3)
(3) ) (D) shear strain profile along the bond line, used for averaging to calculate
, at the selected times during the measurement (lines shown are local smoothing fits (LOWESS), as a guide to the eyes).
Appendix C
– Morphological bond line analysis
The tensile shear specimen were used for microscopic analysis after TSS measurement. Therefore, the fractured overlap area was sawn off at the notch positions of the specimen. The two resulting transversal surfaces were sanded and polished (with up to 800-grit).
A modified Stemi II microscope (Carl Zeiss Microscopy Deutschland GmbH, Germany), equipped with a specimen holder fixed on a cross table, a 400 nm short pass incident filter (G38026203) to eliminate ultraviolet reflections of the specimens’ surface, and a 12 MP color CCD sensor (Sony IMX477R), achieving an imaging resolution of 0.6 µm2/pixel, was used. The setup was operated in a dark enclosure. For UV excitation of the adhesives, 365 nm diodes (Type NCSU 276AT, Nichia Corporation in Anan, Japan) were used. Images along the bond lines with a field of view of 3.1 mm × 2.3 mm were captured continuously with an overlap of approximately 15%, resulting in 10 images per surface, i.e., 20 images per TSS specimen and 11,520 images in total.
All image processing was conducted in ImageJ version 1.53q (public domain). By matching the image overlaps, the 10 images of each surface were fused into large images of the complete cross-section of the bond line using the stitching algorithm by Preibisch et al.[Citation73] By setting color thresholding values for pixel hue, saturation and brightness, fluorescent areas indicating adhesive in the fused images were detected and converted to binary images (masks; wood areas in white, adhesive areas in black).
For further processing of the masks (processing pipeline schematic see ), separate layers were derived containing the continuous bond line, cavities in a bond line, and the penetrated adhesive in filled lumina, using a sequence of binary inversions and void-filling.
Figure C1. Workflow schematic of imaging and processing of UV bond line microscopy.
The separation quality of the bond line and adjacent filled lumina was further refined using the adjustable watershed algorithm (0.25 tolerance). The path (medial axis) of the bond line was determined via a Floyd–Warshall thinning algorithm [Citation74–76] and identifying the “longest shortest path” of the resulting skeleton using the AnalyzeSkeleton algorithm.[Citation77] Along this path, a profile of bond line thickness was generated pixel-wise after applying a local thickness algorithm to the mask.[Citation78] To evaluate the adhesive penetration behavior, the areas and their shortest distances to the bond line are determined for all isolated domains of penetrated adhesive in the interphase. The image processing script was made available online (https://doi.org/10.5281/zenodo.7657395).