The current work examines the filtration of both charged and uncharged NaCl nanoparticles in the size range of 2.5–20 nm on grounded metal filters and meshes, and on plastic mesh. The methodology thus allows electrostatic and other effects to be differentiated from true thermal rebound effects (CitationWang and Kasper 1991). The work also compares measurements under identical conditions made with a number of different condensation particle counters, and a number of different experimental methodologies, in order to allow exclusion of certain measurement errors from the results. It was found that even for particle sizes as small as 2.5 nm there was no measurable deviation from the classical single-fiber-efficiency theory. This conflicts with recently published work (CitationBalazy et al. 2004) which claimed that the thermal bounce of nanometer sized aerosol particles begins to occur at a much larger particle size than previously thought. However, peculiarities or artifacts in CPC counting efficiency at small particle sizes were found during experiments which could account for such observations reported in previous work.
1. INTRODUCTION
It is generally accepted that as particles decrease in size they will—at some point—begin to behave more like molecules and less like particles, with the resulting effect of a decrease in adhesion probability when coming into contact with surfaces such as a filter fiber. However, there exists considerable conjecture over the point at which such rebound effects begin to occur, because it is closely associated with the adhesion energy and other material properties. Studying the onset and magnitude of this diffusional or thermal bounce effect is very important when attempting to design a highly efficient filter for nano-sized particles.
Previously published theory for thermal rebound effects during filtration processes (CitationWang and Kasper 1991), has predicted that the onset of such bounce effects would occur in the region of 10 nm and below. However later experimental work using wire screens (CitationIchitsubo et al. 1996) did not detect a measurable onset of thermal bounce until approximately 3 nm and lower. In this work, however all particles were charged—since all measurements were performed using a Faraday cup electrometer—and electrostatic effects therefore cannot be discounted from the results. In addition, it is unclear if the custom built Differential Mobility Analyzer (DMA) used by CitationIchitsubo et al. (1996) was operating under optimal conditions, since the design was reported to be based on the work of CitationWinklmayer et al. (1991). However the original paper of CitationWinklmayer et al. (1991) showed an incorrect design schematic for their DMA, with a diverging inlet trumpet instead of a converging one. Such a design error may result in turbulent flow conditions within some regions of the DMA when operated at high flow rates, which will lead to a broadening of the DMA transfer function. High flow rates are necessary to classify very small particles such as ion clusters, as used by CitationIchitsubo et al. (1996).
CitationMäkelä et al. (1996) shows that the size distribution of positively charged acetone ions is extremely narrow (or even monodisperse), when measured using a time-of-flight mobility spectrometer. However, when the same ions are classified using a DMA, the distribution appears to be much broader, due to the poorer classification performance of the DMA in this size range. This broad distribution, between approximately 0.5 and 3 nm, shown by CitationMäkelä et al. (1996) could account for the seemingly constant penetration found by CitationIchitsubo et al. (1996) below 2.5 nm. Since by measuring the same monodisperse ion distribution at different DMA voltages CitationIchitsubo et al. (1996) may have believed they were obtaining varyingly sized particles, although the tail of the DMA distribution likely contained the same particles for each different classification voltage (below 2.5 nm).
CitationAlonso et al. (1997) attempted to correct for the problems mentioned above by using a tandem DMA measurement technique, which uses one DMA to classify the particles and a second DMA to scan the classified distribution to determine its actual size. This method showed a greater agreement between penetration measurements and the theory of CitationCheng and Yeh (1980) (refer to Section 2). However, the minimum particle size shown by the authors using the tandem DMA measurements was significantly larger (except for one point at 1.36 nm) than for the single DMA setup, which may be due to particle losses in the 2nd DMA. This means that CitationAlonso et al. (1997) have only shown one datum in the size range where CitationIchitsubo et al. (1996) claim that they have measured thermal rebound.
More recent experimental work (CitationBalazy et al. 2004), has purported to show that thermal bounce can occur at a particle size as high as 20 nm. These experiments were conducted using liquid di-ethyl-hexyl-sebacate (DEHS) aerosol (generated using a Collison nebulizer), which was then collected on polypropylene filters. However this work did not exclude electrostatic effects, since the particles were not neutralised. Furthermore, the aerosol used was polydisperse, with only a small number of particles in the size range of interest, compared to the modal diameter of the particle size distribution, which was much larger. Unlike the previous work discussed, the authors did not pre-classify this aerosol, rather they used an electrical mobility spectrometer (1000XP WPS, MSP Corporation, USA—which consists of a DMA and CPC in one unit) in scanning mode to perform efficiency measurements by comparing complete upstream and downstream particle size distributions. It is not known if the data presented were raw data or calculated values from the data inversion, which can be a source of additional artifacts or uncertainty.
It is therefore evident that the experimental results presented to date are not conclusive, and further work is required to detect the true onset of particle bounce, when other factors can be neglected. Although it is difficult (with current technology) to make measurements at smaller particle sizes than have previously been measured, this work will attempt to improve the clarity of previous work by examining the filtration efficiency of sub-20 nm aerosol particles on grounded metal filters and screens and polypropylene mesh, in order to allow electrostatic effects to be measured. Furthermore, the experiments will compare different measurement methods and different measurement equipment. NaCl particles will be used as the test aerosol, since they exist as a uniform cubic crystal in this region (thus are close to spherical) and have a relatively low density. These particles will be passed through the filter uncharged, and with a defined charge level, to allow quantification of charge effects, and separation of these effects from thermal rebound effects.
2. THEORY
For filtration applications, the classical single-fiber efficiency is widely used, and has proven sufficiently accurate (CitationHinds 1999). However, a separate theory for screen-type diffusion batteries has been derived from the single-fiber efficiency theory (CitationCheng and Yeh 1980), which gives the penetration (P) of a series of n screens as,
The work of CitationCheng and Yeh (1980), lists the diffusional collection (η D ) efficiency as,
Neither the single fiber efficiency theory, nor the CitationCheng and Yeh (1980) theory include thermal rebound, so therefore, if thermal rebound does not occur within a filter or mesh, it would be expected that the agreement between the experimental results and the appropriate theory would be very good.
3. METHODS
The experimental methodology was devised to allow examination of various sources of error or artifacts which could explain some of the results of previous authors. Specifically, the methodology will allow effects such as experimental chamber design, sampling method, measurement method, CPC model, and electrostatic effects to all be quantified, and differentiated from thermal rebound. The methodology thus allows exclusion of a great deal of measurement errors from thermal rebound detection.
3.1 Experimental Apparatus
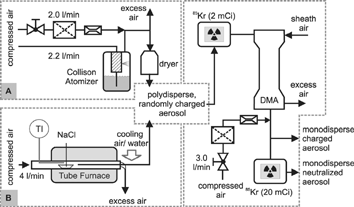
shows the two different particle generation methods used. NaCl particles were generated using either a Collison atomizer (—Topas, Germany) or an evaporation/condensation method (CitationKasper and Berner 1978) (). The latter method was found to generate larger numbers of smaller particles than the former, and therefore was used to generate all sub-10 nm particles. Once generated, the aerosol was neutralized, then classified into a monomobile size using either an improved Vienna DMA (R1 = 25 mm, R2 = 33 mm, and L = 114 mm) or a short Grimm Vienna DMA (R1 = 13 mm, R2 = 20 mm, and L = 88 mm—Grimm, Germany). The sheath and excess-air flow rates through both DMAs were 20 l/min, respectively. After the DMA, the aerosol was either neutralized (to produce uncharged particles), or left as singly charged particles (as selected by the DMA).
FIG. 1 Generation and conditioning methods for monodisperse NaCl test aerosol, (A) Collison atomizer, (B) Evaporation/condensation method.
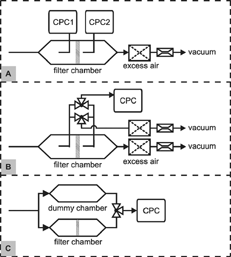
shows the three different filter chamber and CPC configurations used. The setup shown in consisted of a single cylindrical filter chamber (10 cm diameter, flow rate = 6.8 l/min (U 0 = 0.0144 m/s)) with upstream and downstream sampling points, to which were connected either two identical TSI 3010 CPCs (TSI, USA), or a TSI 3022 CPC to count the upstream particle concentrations and a Grimm CPC 5.403 (Grimm, Germany) to count the downstream particles (after the filter)—hereafter referred to as Method A. —Method B shows the same filter chamber, however modified to use only one CPC (either a Grimm CPC 5.403 or a TSI 3025), with a continuous and equal airflow (0.3 l/min) drawn through the sampling point not in use by the CPC. The sampling points were isokinetic, both sampling lines of equal length and diffusional losses in the chamber between the two sampling points were measured without a filter/mesh, and found to be negligible in all cases. —Method C—shows the “dummy” filter chamber method used in previous work (CitationIchitsubo et al. 1996; CitationAlonso et al. 1997). This was used with a TSI 3025 CPC. The filter chambers used for Method C had an internal diameter of 2.2 cm, and the flow rate used was 1.5 l/min (U 0 = 0.0658 m/s). Particle concentration in all testing apparatus (A/B and C) was always 104/cm3 or lower, allowing the single particle count mode of the CPCs to be used throughout all experiments, as it is more accurate than other operational modes.
FIG. 2 Filter chamber and CPC configurations used in experiments, (A) Upstream-downstream sampling dual CPC method, (B) Upstream-downstream sampling single CPC method, (C) Dummy filter chamber method.
shows scanning electron microscope (SEM) images of the stainless steel filter (A), nickel mesh (B), and polypropylene mesh (C) used in the experiments. The specifications of the filter/meshes are given in . For all experiments the filter or mesh was located in a metal filter chamber, which was grounded to prevent the filter becoming charged. However in the case of the polypropylene mesh this does not prevent the filter material from retaining a charge. All connecting lines in the apparatus shown in and were made from electrically conductive tubing.
FIG. 3 Filter and meshes used in experiments, (A) Stainless steel, (B) Nickel, (C) PETEX (polypropylene). gives specifications.
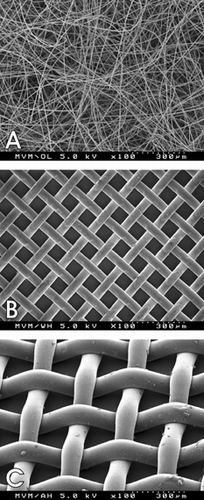
TABLE 1 Filter and mesh parameters
4. RESULTS AND DISCUSSION
All capture efficiency results are shown in terms of the collection efficiency E (= 1−P) with respect to the electrical mobility particle diameter d ME (calculated using the classical Stokes-Einstein equation to allow comparison with previous work), and all results show a comparison between the appropriate theory and the experimental data. For most of the experiments, the filter or meshes were loaded with both uncharged and charged aerosol, to measure the effect of particle charge on the overall value of E. All data points are an average of at least 2 replicates, however error bars are not shown to aid figure clarity.
4.1 Method A and CPC Evaluation and Comparison
As stated in Section 3, Method A was initially used with two identical TSI 3010 CPCs to perform measurements. In order to allow a reliable comparison between the two CPCs, an initial test was performed to measure the diffusional losses between sampling points, and compare the counting efficiency of the two instruments against each other, over the range of particle sizes to be studied. This test was performed by operating the filter chamber without a filter, and making multiple measurements with both CPCs, exchanging the position of the CPCs (upstream and downstream) between runs. Many repetitions of these measurements showed that there was no measurable diffusional loss between sampling points, and that both the CPCs performed measurements with equivalent accuracy, with an difference of less than ± 5% between the two instruments. However, when the TSI 3010 CPCs were actually used to measure collection efficiency, their counting efficiency for small particles was found to be the limiting factor for the use of this setup. It became apparent that regardless of which filter or mesh was used, some strange measurement artifacts (measured using twin TSI 3010s) were observed in the region of 10 nm and below. This is likely to be due to the comparatively low counting efficiency of this instrument, which drops off sharply in the region below 12 nm, as shown clearly in , for the CPCs used. Furthermore, the TSI 3010 operates on a 17 K temperature difference, however the instrument regulates the temperature difference, rather than the saturator and condenser temperature, so therefore the counting efficiency of an instrument may change during operation, if the ambient conditions change.
FIG. 4 Counting efficiency of the TSI 3025 and 3010 CPCs, and the Grimm CPC 5.403 (for two different temperature differences (25°C and 30°C)) for NaCl particles. All counting efficiencies were measured according to the method of CitationHeim et al. (2004). All measurements are means of a minimum of 3 repetitions, however error bars are not shown to aid figure clarity, though the average standard deviation for all measurements is ± 10% of the mean value.
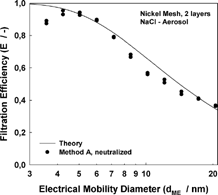
For these reasons, the CPCs were both replaced by alternate instruments with an improved counting efficiency over the TSI 3010—a TSI 3022 to measure the upstream particle concentration and a Grimm 5.403 to measure the downstream concentration (after the filter/mesh). shows the filtration efficiency for two layers of nickel mesh, measured using the Grimm/TSI combination. A noticeable deviation from the theory is present for particles below 5 nm. Although this may appear to be the onset of thermal rebound effects, later results will show that this is due to small variations in counting efficiency of the two CPCs (Grimm 5.403 and TSI 3022) during operation.
FIG. 5 Capture efficiency of the nickel mesh (2 layers) for NaCl, measured using Method A.
shows the comparative counting efficiency of the TSI 3022 and the Grimm 5.403 for NaCl. The results are shown as TSI 3022 counts divided by Grimm 5.403 counts. It is evident that the 3022 has a similar counting efficiency to the Grimm instrument in the upper particle size ranges, however for the sizes below 7 nm the 3022 begins to show an improved counting efficiency over the Grimm instrument. It was attempted to account for this difference by measuring the comparative counting efficiencies and applying a correction factor to the results, however, it is evident from that due to the steepness of the curve in the region below 6 nm, slight differences in the counting efficiency caused by temperature fluctuations can have a great influence on the results. A result such as this can be easily misinterpreted as thermal rebound.
FIG. 6 Comparative counting efficiency of the TSI 3022 CPC and the Grimm 5.403 (for two different temperature differences (25°C and 30°C)) for NaCl particles, measured with the Method A/B filter chamber. The measured results are compared to a fit curve for the two CPCs, which is obtained from a parametric fit to the measured counting efficiency of the TSI 3022 (CitationAnkilov et al. 2002) divided by a parametric fit to the measured Grimm 5.403 (25 K) data (). The data for the smallest 2 particle sizes for the “TSI 3022/Grimm 5.403 @ 25 K” are not shown for reasons of figure clarity (however follow the trend of the calculated fit).
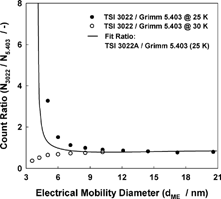
It has been shown previously that the counting efficiency of a CPC can be improved by increasing the temperature difference between saturator and condenser (CitationRussell et al. 1996). The temperature difference of the Grimm CPC 5.403 was increased from the factory settings of 10°C for the condenser and 35°C for the saturator to 8°C and 38°C respectively. This change produced a significant increase in the counting efficiency of the CPC for small particles, with no adverse effects (e.g., homogeneous condensation). As it is expected that the final droplet size within the CPC will change when this increased temperature difference is used, measurements in the photometric mode were avoided. The counting efficiency of the Grimm CPC 5.403 after the temperature difference increase is shown in , compared with the counting efficiency of the TSI 3025, and it is evident that the counting efficiency of the two instruments is now comparable. shows the measured ratio of the TSI 3022 counting efficiency to the Grimm 5.403 counting efficiency, and it is evident that when the Grimm 5.403 is operated at 30 K temperature difference, the comparative counting efficiency of the two instruments is far less sensitive to small changes in particle size.
With the improved counting efficiencies of the TSI 3022 and the modified Grimm 5.403, the collection efficiency measurements made using Method A were improved, however some measurement artifacts remained, due to the slight differences in CPC counting efficiency, which can be magnified by temperature fluctuations during operation, therefore Method B was devised. The use of one CPC ensures that any temperature-induced counting efficiency fluctuations are consistent for both upstream and downstream results.
4.2 Methods B and C
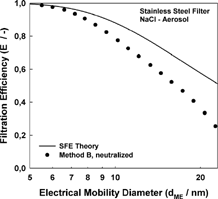
Using only one CPC (Grimm 5.403 at 30°C temperature difference or a TSI 3025) and switching between upstream and downstream sampling points provided much more reliable results with fewer CPC induced measurement artifacts. shows the collection efficiency for the stainless steel filter measured using this method. The agreement between the single fiber efficiency theory and the results is generally quite good, however as particle size increases so does the deviation between theory and experiment. This is believed to be due to the high degree of inhomogeneity in the filter. It is evident that the filtration efficiency, even for such a low packing density filter is effectively unity from the size of 5.5 nm and below, so therefore, to allow the examination of thermal rebound, a material with a lower collection efficiency should be used. Therefore subsequent measurements were made with the nickel mesh, using varying numbers of layers to achieve the desired collection efficiency.
FIG. 7 Capture efficiency of the stainless steel filter for NaCl, measured using Method B.
shows the results for a single, and triple layer of nickel mesh measured using Method B. The single mesh layer was measured using both charged and neutralised aerosol. The agreement between theory and experimental results is generally very good, with no discernible consistent deviation from theory as particle size decreases. For the single layer mesh, measured with both charged and uncharged aerosol, there appears to be a slight increase in efficiency as the particle size decreases, although the filter was neutralised. However the difference is not significant. also shows the results for Method C, for a single layer of nickel mesh, and it is evident that these results are of comparable or slightly worse agreement between the theory and experimental results as the Method B data. The efficiency for this configuration is lower since the velocity is higher, and thus the time period when diffusional capture can occur is shortened. The slight disagreement between the slope of the experimental data curve and the theory is likely due to edge effects induced by the small diameter of the filter chamber. Also, the difference between the neutralized and charged aerosol is more pronounced, than for method B, and this deviation commences at a larger particle size. A possible explanation for this may be the presence of a rubber sealing ring inside the filter chamber, which may have retained a charge, and due to the aforementioned edge effects of the small chamber, may have affected the results.
FIG. 8 Capture efficiency of the nickel mesh for NaCl, measured using Method B (U 0 = 0.0144 m/s) and Method C (U 0 = 0.0658 m/s, neut. = neutralized, chgd. = charged).
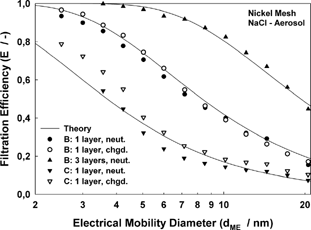
It is evident that the methodologies of both Method B and Method C produce results of equal accuracy, however it should be ensured that the filter chambers are of sufficient size, to minimize any edge effects which may occur.
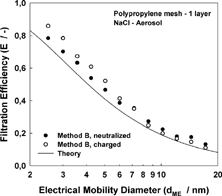
shows the collection efficiency for the polypropylene mesh for both charged and neutralized aerosols, measured by means of Method B. The results are averaged from data for both the temperature modified Grimm 5.403 and the TSI 3025. Both CPCs produced a very close agreement, and there was no significant difference between results, allowing them to be averaged. For this figure, it is evident that, unlike the nickel mesh, both charged and neutralized particles show a higher collection efficiency than the theory predicts. This is likely to be due to the effect observed by CitationYang and Lee (2005) who found that charged polymer fiber filters had an increased collection efficiency for neutralized aerosol when compared to an uncharged filter. Since the polypropylene mesh used in the current study was not neutralized prior to use, it may have possessed a slight charge and caused a similar effect to the one found by CitationYang and Lee (2005) to occur. As found for the nickel mesh, the charged aerosol was captured with a greater efficiency than the neutralised aerosol, however this difference was more pronounced for the polypropylene filter, than for the nickel mesh (, Method B, 1 Layer). These effects may be due to a residual static charge on the filter fibers (as can be produced by triboelectric effects), which can greatly increase particle capture efficiency. According to the theory presented in CitationBrown (1993), the influence of electrostatic image charge effects for the polypropylene mesh can be neglected since the value of the electrostatic capture mechanism in this particular case is approximately 5 orders of magnitude lower than the diffusional capture mechanism. However this theory assumes that the filter/fibers are uncharged and the aerosol charged, so therefore may not adequately account for the opposite case of uncharged aerosol and charged fibers.
FIG. 9 Capture efficiency of the polypropylene mesh for NaCl, measured using Method B and Method C.
A further possible effect that may occur is the accumulation of charged particles on the mesh increasing the capture efficiency over time, due to an increasing electrostatic field between the filter and the housing, as observed previously (CitationAlonso and Alguacil 1999). However in contradiction to the aforementioned work, the multiple measurement repetitions for each configuration in this work showed no such increase in collection efficiency over time. This discrepancy, may be due to the lower particle concentrations and shorter loading time in the current work.
5. CONCLUSION
It is evident from the current work that when accurate sampling methods are used, no thermal rebound can be detected (for the particle type used) in the size range down to 2.5 nm. Only the measurement apparatus and method used in Methods B and C produced consistently accurate and reliable results. The authors consider Method C to be superior, since the entire flow is sampled (which negates the need for isokinetic sampling) and the high symmetry of the particle flow paths, which makes separate measurement of the diffusional losses in the filter chamber without a filter unnecessary. However, depending on the size of the filter chamber, edge effects can be enhanced by this method.
When filters or meshes can be neutralized or grounded, only slight particle-charge induced effects on the collection efficiency can be observed. However for plastic mesh (which cannot be reliably grounded or neutralized for long periods), a significant difference in the capture efficiency can be observed with charged particles compared to uncharged, resulting in an increased capture efficiency.
Further work to examine particles below 2.5 nm would be advantageous. The authors propose that the optimal method to examine diffusional collection efficiency in this region would be to use electrosprayed monodisperse molecular standards (Ude and Fernández de la Mora) as the test aerosol, classified using a high resolution nano-DMA (CitationFernández de la Mora et al. 2004), and measured using a turbulent mixing type CPC (CitationGamero-Castano and Fernández de la Mora 2000) to perform measurements in conjunction with the Method B or Method C test apparatus.
Acknowledgments
The authors would like to thank Dr. Einar Kruis from the Universität Duisburg-Essen for the loan of the TSI 3025 CPC. And SEFAR, Switzerland for supplying the PETEX mesh used in the experiments.
Notes
a Manufacturer specifications.
Related Research Data
REFERENCES
- Alonso , M. and Alguacil , F. J. 1999 . Filtration of Unipolarly Charged Aerosol Nanoparticles with an Initially Discharged Dielectric Screen . J. Colloid and Interface Sci. , 216 : 71 – 76 .
- Alonso , M. , Kousaka , Y. , Hashimoto , T. and Hashimoto , N. 1997 . Penetration of Nanometer-Sized Aerosol Particles Through Wire Screen and Laminar Flow Tube . Aerosol Sci. Technol. , 27 : 471 – 480 .
- Ankilov , A. , Baklanov , A. Colhoun , M. 2002 . Particle Size Dependent Response of Aerosol Counters . Atmos. Res. , 62 : 209 – 237 . [CROSSREF] [CSA]
- Balazy , A. , Podgorsky , A. and Gradon , L. 2004 . Filtration of Nanosized Aerosol Particles in Fibrous Filters I—Experimental results . J. Aerosol Sci. , : S967 – S968 . EAC Proceedings II[CROSSREF]
- Brown , R. C. 1993 . Air Filtration, an Integrated Approach to the Theory and Applications of Fibrous Filters , Oxford, , UK : Pergamon .
- Cheng , Y. S. , Yamada , Y. and Yeh , H. C. 1990 . Diffusional Deposition on Model Fibrous Filters with Intermediate Porosity . Aerosol Sci. Technol. , 12 : 286 – 299 .
- Cheng , Y. S. and Yeh , H. C. 1980 . Theory of a Screen-Type Diffusion Battery . J. Aerosol Sci. , 11 : 313 – 320 . [CROSSREF]
- Fernández de la Mora , J. , Labowsky , M. , Schmitt , I J. II and Nelson , W. Method and Apparatus to Increase the Resolution and Widen the Range of Differential Mobility Analyzers (DMA's) . U.S. Patent, Number 6,787,763 . 2004 .
- Gamero-Castano , M. and Fernández de la Mora , J. 2000 . A Condensation Nucleus Counter (CNC) Sensitive to Singly Charged Sub-Nanometer Particles . J. Aerosol Sci. , 31 : 757 – 772 . [CROSSREF] [CSA]
- Heim , M. , Kasper , G. , Reischl , G. P. and Gerhart , C. 2004 . Performance of a New Commercial Electrical Mobility Spectrometer . Aerosol Sci. Technol. , 32 : 3 – 14 . [CROSSREF]
- Hinds , W. C. 1999 . Aerosol Technology , New York : John Wiley & Sons .
- Ichitsubo , H. , Hashimoto , T. , Alonso , M. and Kousaka , Y. 1996 . Penetration of Ultrafine Particles and Ion Clusters Through Wire Screens . Aerosol Sci. Technol. , 24 : 119 – 127 .
- Kasper , G. and Berner , A. 1978 . A Generator for the Production of Extremely Monodisperse Sodium Chloride Aerosols (in German) . Staub , 38 : 183 – 186 .
- Kirsch , A. A. and Fuchs , N. A. 1968 . Studies of Fibrous Aerosol Filters—III. Diffusional Deposition of Aerosols in Fibrous Filters . Annals of Occupational Hygiene , 11 : 299 – 304 . [PUBMED] [INFOTRIEVE]
- Mäkelä , J. , Jokinen , V. , Mattila , T. , Ukkonen , A. and Keskinen , J. 1996 . Mobility Distribution of Acetone Cluster Ions . J. Aerosol Sci. , 27 : 175 – 190 . [CROSSREF]
- Russell , L. M. , Zhang , S. , Flagan , R. C. and Seinfeld , J. H. 1996 . Radially Classified Aerosol Detector for Aircraft-Based Submicron Aerosol Measurements . J. Atmos. Oceanic Technol. , 13 : 598 – 609 . [CROSSREF] [CSA]
- Ude , S. and Fernández de la Mora , J. Molecular Monodisperse Mobility and Mass Standards from Electrosprays of Tetra-Alkyl Ammonium halides. Accepted for publication . J. Aerosol Sci. , [CSA]
- Wang , H.-C. and Kasper , G. 1991 . Filtration Efficiency of Nanometer-Size Aerosol Particles . J. Aerosol Sci. , 22 : 31 – 41 . [CROSSREF] [CSA]
- Winklmayer , W. , Reischl , G. P. , Lindner , A. O. and Berner , A. 1991 . A New Electrical Mobility Spectrometer for the Measurement of Aerosol Size Distributions . Aerosol Sci. Technol. , 22 : 289 – 296 . [CROSSREF]
- Yang , S. and Lee , W. M. 2005 . Filtration Characteristics of a Fibrous Filter Pretreated with Anionic Surfactants for Monodisperse Solid Aerosols . J. Aerosol Sci. , 36 : 419 – 551 . [CROSSREF]