The hygroscopic behavior of 0.1 to 4 μ m NaBr, CsCl, NaCl, (NH4)2SO4, and KBr particles were monitored using a transmission electron microscope (TEM) equipped with an environmental cell into which gases can be introduced. This instrument, commonly called an environmental transmission electron microscope or ETEM, allowed us to observe phase transitions and behavior of small particles at relative humidities between 0 and 100%. We used deliquescence relative humidity and efflorescence relative humidity values from the literature for each salt to calibrate the relative humidity in the environmental cell. Using our methodology, we reliably and accurately measured the phase transitions and hygroscopic behavior of inorganic particles with the ETEM.
INTRODUCTION
Aerosol particles are ubiquitous in the atmosphere and influence Earth's radiative budget directly by scattering and absorbing sunlight (CitationCharlson et al. 1992), and indirectly by serving as cloud condensation nuclei (CitationDeMott and Rogers 1990). Aerosol particles can also provide surfaces for heterogeneous chemistry in the atmosphere (e.g., CitationHu and Abbatt 1997). Their impact on climate and atmospheric chemistry depends, in part, on their water content and size, which in turn depends on atmospheric relative humidity (RH) and particle composition.
Aerosol particles with different compositions behave differently as atmospheric RH changes. Laboratory studies (e.g., CitationTang and Munkelwitz 1984; CitationTang and Munkelwitz 1994; CitationMartin 2000, and references therein) firmly establish the RH at which a variety of atmospheric aerosol particles take up water to form a solution droplet (deliquescence), and the RH at which these aerosol particles lose water to form crystals (efflorescence). Experimental techniques used to study the thermodynamic and kinetic properties of phase transitions include, but are not limited to, aerosol flow tubes equipped for FTIR spectroscopy, electrodynamic balances, absorption cells, and mobility spectrometers. These techniques provide the deliquescence RH (DRH) and efflorescence RH (ERH) of many atmospheric aerosol particles reported in the literature. Although they are sensitive to changes associated with particle phase transitions, they are not capable of studying the morphology changes that micrometer and submicrometer particles undergo as RH is cycled.
Environmental scanning electron microscopy (ESEM) has been used to study morphology changes in individual aerosol particles through changes in RH (e.g., CitationEbert et al. 2002; CitationHoffman et al. 2004). A major drawback of the use of ESEM to study the hygroscopic behavior of individual aerosol particles is that it has a limited spatial resolution. In contrast, the transmission electron microscope (TEM) is a powerful analytical instrument for the study of atmospheric aerosol particles because it can resolve features down to fractions of a nanometer and can provide information on size, structure, morphology, and composition of individual aerosol particles. The TEM has been successfully used to characterize aerosol particles from a variety of sources such as biomass burning, and source areas such as the marine boundary layer (CitationBuseck et al. 2002; CitationBuseck and Posfai 1999). Traditional use of the TEM excludes it from studying the effects of changing environmental conditions, such as RH, on atmospheric aerosol particles because of the high vacuum required for operation.
Advances in the environmental TEM (ETEM) make it possible to obtain well-resolved images during in-situ studies of gas-solid chemical reactions such as oxidation/reduction, nitridation, and polymerization (CitationSharma 2001). These studies are carried out in an environmental cell located in the electron-optical column of the TEM. The environmental cell used in this study employs differential pumping and small apertures to maintain a controlled environment in the sample region. The ETEM is designed to allow up to ∼ 10 torr of gas pressure in the environmental cell without seriously deteriorating image resolution. Therefore, the ETEM can be used to study phase transitions of atmospherically relevant aerosol particles because the technique allows them to be observed at RH conditions encountered in the atmosphere.
This work reports the first use of the ETEM to study the hygroscopic behavior of particles representative of the atmosphere, establishing the feasibility of the ETEM to observe particle deliquescence, efflorescence, and hygroscopic growth. We measured the DRH and ERH of a variety of inorganic salts (KBr, (NH4)2SO4, NaCl, CsCl, and NaBr) and compared our measurements to the accepted DRH and ERH values to determine the accuracy of our methodology. Furthermore, the effect of electron dose rate, sample substrate, and particle size on phase transitions studied using the ETEM is not known. Therefore, we determined the effects of these factors on the DRH and ERH measured using the ETEM.
EXPERIMENTAL
All deliquescence and efflorescence measurements were carried out in a 200-kV FEI Tecnai F20 TEM outfitted with a differentially pumped environmental cell. A schematic diagram of the environmental cell and details regarding the principles of operation are described elsewhere (CitationSharma 2001; CitationSharma and Weiss 1998). We describe experiment-specific details in the following section.
Particles used in this study were generated from 1 M bulk KBr, (NH4)2SO4, NaCl, CsCl, and NaBr solutions using a TSI model # 3076 atomizer. The particles were next passed through a diffusion dryer (TSI model #3062), which reduced the ambient RH to between ∼ 45 and 65%. The particles were then deposited by diffusion onto one of four types of TEM grids: carbon Type-A, 300 mesh Cu (Ted Pella, Inc. #1820); lacey carbon Type-A, 300 mesh Cu (Ted Pella, Inc. #1890); Formvar® carbon, 200 mesh Ni (SPI Supplies, Inc. #3420N-CF); or carbon-coated, 200 mesh Ni (SPI Supplies, Inc. #3520N-CF). These types of grids were chosen to determine if differences in the thermal conductivity of the grid material or contact with different grid coatings affected our measurements.
Phase transition experiments were initiated by inserting TEM grids laden with particles into the evacuated ETEM column using a single-tilt sample holder that employed liquid nitrogen to cool the specimen area (). The liquid nitrogen was contained in a dewar outside of the microscope column and was connected via a conducting rod to the specimen-holder tip. The rod, which was insulated with a vacuum jacket from the environment inside the microscope, contained an electrical heater to control and a silicon diode to measure sample temperature. The holder was designed so that the entire specimen holder tip was cooled, enabling the minimum possible thermal gradient around the particles.
FIG. 1 Schematic diagram of the experimental apparatus.
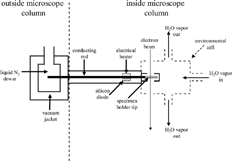
The silicon diode in the conducting rod was located approximately 2.5 cm from the specimen holder tip, and thus we could not measure temperature directly at the sample area while performing phase transition experiments. Therefore, prior to experimentation, the temperature at the sample location was measured using a type-T thermocouple (Omega Engineering Inc. #450-ATT, accuracy of ± 0.26°C). A temperature calibration curve was constructed by plotting the temperature (in Kelvin) measured by the thermocouple versus that measured by the silicon diode. This calibration curve (slope = 0.83 ± 0.01, and y-intercept = 54.3 ± 4.1) was used to estimate the sample temperature during the experiments.
After inserting the sample into the ETEM, the temperature was allowed to equilibrate to ∼ 279 K using a combination of liquid nitrogen cooling and resistive heating. The sample temperature was maintained at ∼ 279 K so that a RH of 100% was attained if ∼ 7 torr of water vapor was allowed in the environmental cell of the ETEM (see explanation in the following section on the determination of RH). Once the temperature was equilibrated (∼ 5 minutes), the electron beam was turned on and an image of the particles was recorded under vacuum conditions (pressure < 2.2 × 10− 5 torr). To minimize the radiation damage that occurs when samples of ammonium sulfate and metal halides are studied using TEM (CitationAllen et al. 1998; CitationEgerton et al. 1987; CitationLi et al. 2003a), we blocked the electron beam after the initial image was recorded. This procedure not only minimized radiation damage but also particle heating, which could have affected the RH measurements. Although particle heating from the electron beam was minimized using this methodology, it was possible that particle temperature, and thus RH measurements, were affected during the imaging process.
After recording an initial image of the sample, water vapor was introduced into the environmental cell of the ETEM from a glass bulb containing room temperature distilled water. The vapor pressure in the environmental cell was regulated using a mechanical leak valve and measured using a capacitance manometer (calibrated prior to the experiments) located outside the ETEM. Because the gaseous mean free path of the water vapor in the environmental cell was much less than the size of the cell itself, we estimated that the temperatures of the particles and the water vapor surrounding the particles were approximately equal. Under this approximation, the RH the particles experienced was calculated using Equation Equation1:
where RHecell is the relative humidity in the environmental cell of the ETEM, PH2O is the vapor pressure in the environmental cell (measured using the capacitance manometer), and PH2O, sat is the saturation vapor pressure at the sample temperature (determined using water vapor pressure measurements from CitationWexler (1976)). Therefore, we achieved a desired value of RH by carefully opening or closing the mechanical leak, recording the water vapor pressure in the environmental cell, and performing the RH calculation using Equation Equation1.
Allowing for an ∼ 1 minute equilibration period at an initial RH, the electron beam was unblocked and an image of the particles was recorded. If the particles remained crystalline, the electron beam was blocked and the water vapor pressure in the environmental cell was increased. This process was repeated in steps until the particles deliquesced. After an image of the deliquesced particles was obtained, the electron beam was blocked and the water vapor pressure in the environmental cell was decreased. After an ∼ 1 minute equilibration period, the electron beam was unblocked and an image of the particles was recorded. Water vapor pressure in the environmental cell was incrementally decreased, with images obtained at each step, until the particles effloresced.
Estimated uncertainties in measurements of sample temperature used to calculate PH2O, sat and in water vapor pressure were used to calculate the estimated uncertainty of the apparent RH in the environmental cell. However, these uncertainties were not well known because there was no reliable way to estimate local heating of the particles from the electron beam and because water vapor pressure was not be measured immediately adjacent to the sample. Therefore, we used measured (from the ETEM) and accepted DRH and ERH values (from the literature) for each salt to calibrate the RH in the environmental cell of the ETEM. Using this calibration, the determination of RH was more accurate than attempting to estimate errors in particle temperature and water vapor pressure. Thus, the RH values in this manuscript were adjusted by correcting the apparent RH measured using the ETEM with this calibration.
An electron dose rate of 0.53 ± 0.15 electrons/Å2 s was used to obtain high-quality images during our phase transition experiments. Despite the careful regulation of particle electron exposure, small fluctuations in electron dose rate occurred during measurements. To determine the extent to which phase transitions were affected by electron exposure, we performed deliquescence and efflorescence experiments with (NH4)2SO4 and CsCl particles using a range of electron dose rates (∼ 0.1 electrons/Å2 s to 3.5 electrons/Å2 s).
RESULTS AND DISCUSSION
shows images of each chemical species taken immediately before and after deliquescence at ∼ 279 K. Prior to deliquescence, particle morphology remains generally unchanged as the RH in the environmental cell is increased from 0%. An enlargement and rounding in particle morphology occurs once the DRH is reached, which we interpret as resulting from deliquescence. The change in particle morphology associated with deliquescence for NaBr, CsCl, and NaCl particles is apparent; however, the change for (NH4)2SO4 and KBr particles is more subtle. Because the (NH4)2SO4 and KBr particles have a rounded shape whether effloresced or deliquesced, an enlargement in particle size was used to determine the DRH. Although difficult to see in the figure, the (NH4)2SO4 and KBr particles show an increase in size after the DRH is reached. With the exception of CsCl, the RH values following and prior to deliquescence bracket the accepted DRH. Although the ETEM measurements of the DRH of CsCl are not as accurate as for the other particles, the measurements are within 3% of their accepted values. The observations in demonstrate the suitability of the ETEM to study the deliquescence of atmospheric aerosol particles.
FIG. 2 Images of each salt taken immediately before and after deliquescence at ∼ 279 K. The NaBr and CsCl particles are imaged on lacey carbon substrates whereas the other salts are imaged on substrates with continuous carbon films. A change in particle morphology occurs at RH values greater than the DRH for each of the salt particles.
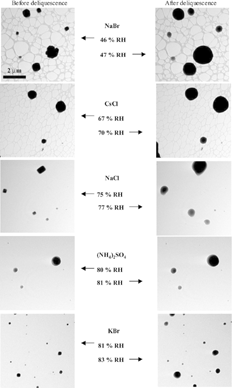
Phase transitions for a given salt can vary with temperature. CitationOnasch et al. (1999) observed that the deliquescence transition for (NH4)2SO4 changed from 80% RH at 294.8 K to 82% RH at 258.0 K, and the efflorescence transition increased from 32 to 39% RH by decreasing the temperature from 294.8 to 234.3 K. CitationCziczo and Abbatt (2000) reported that decreasing temperature from 283–253 K caused the NaCl deliquescence transition to increase from 75 to 80% RH and the efflorescence transition to decrease from 45 to 35% RH. No data are available on the temperature dependence of the DRH and ERH for the other chemical species in this study. Therefore, we used the room-temperature data as the accepted DRH and ERH values for NaBr, CsCl, and KBr. Because the phase transitions for (NH4)2SO4 and NaCl are nearly independent of temperature between room temperature and 279 K (and for consistency), we also used the room temperature data as the accepted DRH and ERH values for these species.
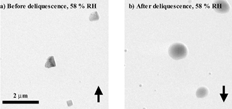
a shows crystalline NaCl particles and b shows NaCl solution droplets, both imaged at ∼ 279 K and 58% RH. The phenomenon of different phases at the same temperature and water vapor pressure can be explained considering particle history and is commonly referred to as the hysteresis effect. As the RH in the ETEM is increased from 0% RH, the particles remain crystalline. Once the RH reaches the DRH, the particles gain water to maintain equilibrium with the water vapor surrounding them. Conversely, when the RH is decreased in the ETEM, the particles lose water. When the RH is decreased below the DRH, the droplets do not immediately effloresce, but remain supersaturated until reaching a lower RH where efflorescence occurs. The NaCl particles shown in a have not been exposed to RH values greater than the DRH of 75% and are therefore crystalline at 58% RH. However, the NaCl solution droplets shown in had previously been exposed to water vapor pressures above the deliquescence point, and therefore remained as solution droplets at 58% RH. The result of this hysteresis effect has been extensively studied for many atmospherically relevant aerosol particles and can also be observed using the ETEM.
FIG. 3 The crystalline particles in a are imaged at 58% RH as the RH is increased from 0% RH (up arrow), and the solution particles in b are imaged at 58% RH as the RH is decreased from 84% RH (down arrow) at ∼ 279 K.
shows images of each chemical species taken immediately before and after efflorescence at ∼ 279 K. As the RH in the ETEM is decreased from values above the DRH, the particles lose water and shrink to maintain equilibrium with the water vapor. However, the round shapes of the particles remain generally unchanged. Once the ERH is reached, a change in particle morphology occurs indicating that the particle is no longer a solution droplet. The change in particle morphology associated with CsCl efflorescence is not as evident as for the other types of particles. However, the original images (which are much larger than those in ) clearly show crystal faces in the effloresced CsCl particles. In contrast to CsCl, the change in particle morphology due to efflorescence for (NH4)2SO4 and KBr particles is quite different. It is fairly easy to tell that these particles have effloresced; however, they form crystals with strange shapes. It is well known that (NH4)2SO4 particles are extremely beam sensitive (CitationLi et al. 2003a). Therefore, these shapes could be attributed to damage by the electron beam.
FIG. 4 Images of each chemical species taken immediately before and after efflorescence at ∼ 279 K. The NaBr and CsCl particles are imaged on lacey carbon substrates whereas the other salts are imaged on substrates with continuous carbon films. A change in particle morphology occurs at RH values less than the ERH for each of the salt particles.
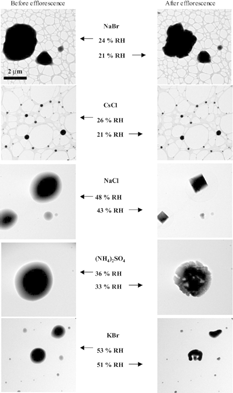
With the exception of CsCl, the RH values prior to and after efflorescence bracket the accepted ERH. The ERH measured using the ETEM for CsCl is within 12% of its accepted value. This large discrepancy is cause for concern but not surprising if one considers that many different studies using a variety of techniques determine a wide range of ERH values for the same salts (see CitationMartin 2000, and references therein). Heterogeneous nucleation of the solution droplets arising from the substrate or impurities can be ruled out because each salt effloresces at a RH lower than the accepted ERH.
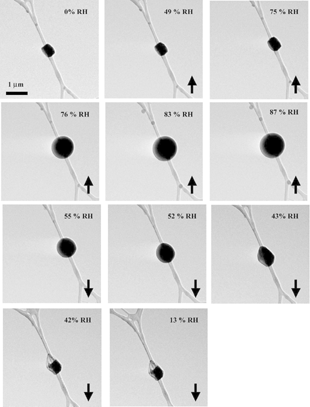
The images in through show that it is possible to study the phase and behavior of individual inorganic particles at RH values between 0 and 100% in the environmental cell of the ETEM. In order to more fully demonstrate the capability of the ETEM to image particles at various RH values, shows images of a NaCl particle as the RH is increased from 0 to 87% (up arrows) and decreased from 87 to 13% (down arrows) at ∼ 279 K. As expected, particle morphology does not change appreciably as RH is increased from 0 to 75%. However, once 76% RH is attained, the particle becomes bigger and rounder, indicating deliquescence. As RH is further increased from 76 to 87%, the images show particle growth in response to the increase in surrounding water vapor. As RH in the environmental cell of the ETEM is decreased from 87 to 43% RH, the particle shrinks. Once the ERH of 42% is reached, the particle crystallizes, and further decreases in RH do not affect particle morphology.
FIG. 5 Images of a NaCl particle as the RH is increased from 0 to 87% and then decreased from 87 to 13% at ∼ 279 K. The up arrows indicate increasing water vapor pressure, and the down arrows indicate decreasing water vapor pressure in the environmental cell of the ETEM.
To demonstrate the accuracy of the RH measurements, shows the apparent DRH and ERH measured using the ETEM versus accepted values at 298 K for (NH4)2SO4 (CitationCziczo et al. 1997), NaCl (CitationRichardson and Snyder 1994), and CsCl (CitationRichardson and Snyder 1994), and at 293 K for KBr and NaBr (CitationCohen et al. 1987a; CitationCohen et al. 1987b). A 1:1 line (solid) allows comparison of our measured values to accepted values. Each data point represents the average of at least 20 particles of different sizes on the four-substrate types used in this study. The small error bars represent one standard deviation from this average, whereas the large error bars indicate the additional error arising from uncertainties in temperature and water vapor pressure. It is evident that the apparent DRH and ERH measured by the ETEM for all the particles studied agree with the values reported in the literature within estimated errors.
FIG. 6 Apparent DRH and ERH measured at ∼ 279 K using the ETEM versus accepted values at 298 K for various salts. The horizontal error bars represent error in the accepted phase transition data reported in the literature. The 1:1 line (solid) shows the extent to which the apparent and accepted values agree and the dashed line represents a linear fit to the ETEM data. The inset shows phase transition values corrected using the linear fit to the ETEM data.
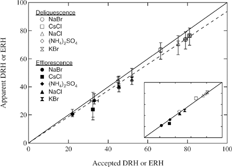
In spite of agreement within estimated uncertainty, the DRH and ERH values measured using the ETEM for most of our samples are slightly lower than the values in the literature. We have good reproducibility in the phase transition measurements, but the limitation of measuring particle temperature during a deliquescence or efflorescence experiment introduces uncertainty to the results, as does the determination of water vapor pressure in the environmental cell. The combined uncertainty in the calculation of RH is difficult to estimate. One way around this difficulty is to use the measured DRH and ERH values to calibrate the RH measurement in the environmental cell of the ETEM. The dashed line in represents a linear fit (slope = 0.94 ± 0.02, y-intercept = 0) to the measured phase transition data. Determination of RH in the environmental cell is probably far more accurate using this linear fit than attempting to estimate errors in temperature and water vapor pressure. Thus, the values for DRH and ERH presented in this manuscript are corrected by dividing the apparent RH measured using the ETEM by 0.94.
The inset in shows the calibration-adjusted DRH and ERH values for each salt. After this correction, the phase transition values agree better with the accepted values. As stated above, the slope of the linear fit to the measured phase transition data (which are used to adjust the data) is 0.94 ± 0.02. The error in the linear fit corresponds to an error for each data point of < 1.4% RH.
shows DRH and ERH values as a function of particle size for each salt. These data were obtained over multiple days and runs, and each data point represents the RH at which the deliquescence or efflorescence phase transition occurs for a single particle. The solid lines represent the accepted DRH and the dashed lines represent the accepted ERH for each system. The measured DRH and ERH values in agree well with accepted values. Furthermore, differences in particle sizes from 0.1 to 4 μ m do not affect the phase transitions. It remains to be determined why the spread in the ERH data for CsCl particles is larger than the other salts. However, there is no systematic dependence on size for particles from 0.1 to 2 μ m.
FIG. 7 DRH and ERH versus particle size (0.1 to 4 μ m) for various salts. Each point represents the RH at ∼ 279 K where the deliquescence or efflorescence phase transition occurs for a single particle. The solid lines represent the accepted DRH, and the dashed lines represent the accepted ERH for each system.
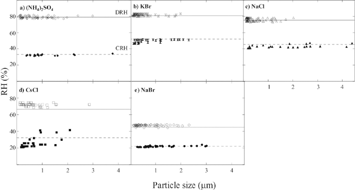
The data in include measurements on four types of TEM grids. The results show that neither particle size nor sample substrate have a significant effect on our measurements. Although there are differences in thermal conductivity between the Cu and Ni grids, there is no noticeable difference in the RH at which the particles deliquesce or effloresce. Furthermore, there is no obvious difference in the DRH or ERH values if the substrate contains a discontinuous carbon layer or a Formvar® backing.
Finally, we performed deliquescence and efflorescence experiments using (NH4)2SO4 and CsCl particles over a range of electron dose rates (∼ 0.1 electrons/Å2 s to 3.5 electrons/Å2 s). We found that within experimental error, the DRH and ERH measured using the ETEM were not affected by large fluctuations in electron exposure.
SUMMARY AND DISCUSSION
We measured the DRH and ERH and studied the hygroscopic behavior of 0.1 to 4 μ m NaBr, CsCl, NaCl, (NH4)2SO4, and KBr particles using an ETEM. This is the first study to employ this method for observation of the hygroscopic behavior of inorganic atmospheric particles. We used the DRH and ERH values to calibrate the RH in the environmental cell of the ETEM to reliably and accurately study the phase transitions of aerosol particles. We also showed that differences in electron dose rate, particle size (within bounds), and sample substrate have no effect on phase transitions measured by the ETEM.
The ETEM can be used to solve a variety of atmospheric issues because of its capability to monitor morphological changes in aerosol particles as RH is cycled. Because it is possible to image particles that are less than 100 nm in diameter, one of our goals is to use the ETEM to study the phase transitions of atmospheric nanoparticles (< 100 nm). Although atmospheric nanoparticles are ubiquitous in the lower troposphere, their phase transitions are not well understood. Currently, three thermodynamic models exist for the deliquescence of nanoparticles. However, they predict opposite signs for the dependence of the DRH on particle size (CitationDjikaev et al. 2001; CitationMirabel et al. 2000; CitationRussell and Ming 2002). Recently, a tandem nano-differential mobility analyzer was used to determine that the DRH of NaCl nanoparticles increased as particle size decreased (CitationBiskos et al. 2005). We would like to test and confirm this result using the ETEM.
The ETEM can also be used to study phase transitions of aerosol particles collected in field campaigns. A number of investigators have shown that aerosol particles collected from clean and polluted air masses contain a complex mixture of components such as NaCl, mixed-cation (Na, Mg, K, and Ca) sulfates, Na2SO4,soot, and Fe oxides (CitationBuseck and Posfai 1999; CitationLi et al. 2003a; CitationLi et al. 2003b; CitationPosfai et al. 1994; CitationPosfai et al. 2003). Using the ETEM we could (in real time) monitor deliquescence, water uptake, and efflorescence of various areas in a single particle. This type of study would allow the estimation of water content for an aerosol particle that is too complex to study using traditional methods.
Acknowledgments
This material is based on work supported by the National Science Foundation under Grant No. 0304213. Any opinions, findings, and conclusions or recommendations expressed in this material are those of the authors and do not necessarily reflect the views of the National Science Foundation. We gratefully acknowledge the use of facilities within the center for Solid State Science at Arizona State University. In particular, we thank Karl Weiss, John Wheatley, Renu Sharma, and Peter Crozier for assistance.
REFERENCES
- Allen , H. C. , Mecartney , M. L. and Hemminger , J. C. 1998 . Minimizing Transmission Electron Microscopy Beam Damage During the Study of Surface Reactions on Sodium Chloride . Microscopy and Microanalysis , 4 ( 1 ) : 23 – 33 . [PUBMED] [INFOTRIEVE] [CSA]
- Basilevsky , A. 1994 . Statistical Factor Analysis and Related Methods, Theory and Applications. , New York : Wiley and Sons .
- Biskos , G. , Malinowski , A. , Russell , L. M. , Buseck , P. R. and Martin , S. T. 2005 . Nanosize Effect on the Deliquescence and Efflorescence of NaCl Particles . Aerosol Science and Technology , submitted, June 2005[CSA]
- Buseck , P. R. , Jacob , D. J. , Posfai , M. , Li , J. and Anderson , J. R. 2002 . “ Minerals in the Air: An Environmental Perspective ” . In Frontiers in Geochemistry: Global Inorganic Chemistry , Edited by: Ernst , W. G. 106 – 122 . Geological Society of America .
- Buseck , P. R. and Posfai , M. 1999 . Airborne Minerals and Related Aerosol Particles: Effects on Climate and the Environment . Proc. Natl. Acad. Sci. USA , 96 ( 7 ) : 3372 – 3379 . [PUBMED] [INFOTRIEVE] [CSA] [CROSSREF]
- Charlson , R. J. , Schwartz , S. E. , Hales , J. M. , Cess , R. D. , Coakley , J. A. , Hansen , J. E. and Hofmann , D. J. 1992 . Climate Forcing by Anthropogenic Aerosols . Science , 255 : 423 – 430 . [CSA]
- Cohen , M. D. , Flagan , R. C. and Seinfeld , J. H. 1987a . Studies of Concentrated Electrolyte-Solutions Using the Electrodynamic Balance .1. Water Activities for Single-Electrolyte Solutions . J. Phys. Chem. , 91 ( 17 ) : 4563 – 4574 . [CSA] [CROSSREF]
- Cohen , M. D. , Flagan , R. C. and Seinfeld , J. H. 1987b . Studies of Concentrated Electrolyte-Solutions Using the Electrodynamic Balance .3. Solute Nucleation . J. Phys. Chem. , 91 ( 17 ) : 4583 – 4590 . [CSA] [CROSSREF]
- Cziczo , D. J. and Abbatt , J. P. D. 2000 . Infrared Observations of the Response of NaCl, MgCl2, NH4HSO4, and NH4NO3 Aerosols to Changes in Relative Humidity from 298 to 238 K . J. Phys. Chem. A , 104 ( 10 ) : 2038 – 2047 . [CSA] [CROSSREF]
- Cziczo , D. J. , Nowak , J. B. , Hu , J. H. and Abbatt , J. P. D. 1997 . Infrared Spectroscopy of Model Tropospheric Aerosols as a Function of Relative Humidity: Observation of Deliquescence and Crystallization . J. Geophys. Res. Atmospheres , 102 ( D15 ) : 18843 – 18850 . [CSA] [CROSSREF]
- DeMott , P. J. and Rogers , D. C. 1990 . Freezing Nucleation Rates of Dilute Solution Droplets Measured Between -30°C and -40°C in Laboratory Simulations of Natural Clouds . J. Atmos. Sci. , 47 : 1056 – 1064 . [CSA] [CROSSREF]
- Djikaev , Y. S. , Bowles , R. , Reiss , H. , Hameri , K. , Laaksonen , A. and Vakeva , M. 2001 . Theory of Size Dependent Deliquescence of Nanoparticles: Relation to Heterogeneous Nucleation and Comparison with Experiments . J. Phys. Chem. B , 105 ( 32 ) : 7708 – 7722 . [CSA] [CROSSREF]
- Ebert , M. , Inerle-Hof , M. and Weinbruch , S. 2002 . Environmental Scanning Electron Microscopy as a New Technique to Determine the Hygroscopic Behaviour of Individual Aerosol Particles . Atmos. Environ. , 36 ( 39–40 ) : 5909 – 5916 . [CSA] [CROSSREF]
- Egerton , R. F. , Crozier , P. A. and Rice , P. 1987 . Electron Energy-Loss Spectroscopy and Chemical-Change . Ultramicroscopy , 23 ( 3–4 ) : 305 – 312 . [CSA] [CROSSREF]
- Hoffman , R. C. , Laskin , A. and Finlayson-Pitts , B. J. 2004 . Sodium Nitrate Particles: Physical and Chemical Properties During Hydration and Dehydration, and Implications for Aged Sea Salt Aerosols . J. Aerosol Sci. , 35 ( 7 ) : 869 – 887 . [CSA] [CROSSREF]
- Hu , J. H. and Abbatt , J. P. D. 1997 . Reaction Probabilities for N2O5 Hydrolysis on Sulfuric Acid and Ammonium Sulfate Aerosols at Room Temperature . J. Phys. Chem. A. , 101 ( 5 ) : 871 – 878 . [CSA] [CROSSREF]
- Li , J. , Anderson , J. R. and Buseck , P. R. 2003a . TEM Study of Aerosol Particles from Clean and Polluted Marine Boundary Layers Over the North Atlantic . J. Geophys. Res. Atmospheres , 108 ( D6 ) : 4189 – 4203 . [CSA] [CROSSREF]
- Li , J. , Posfai , M. , Hobbs , P. V. and Buseck , P. R. 2003b . Individual Aerosol Particles from Biomass Burning in Southern Africa: 2, Compositions and Aging of Anorganic Particles . J. Geophys. Res. Atmospheres , 108 ( D13 ) : 8484 – 8495 . [CSA] [CROSSREF]
- Martin , S. T. 2000 . Phase Transitions of Aqueous Atmospheric Particles . Chem. Rev. , 100 ( 9 ) : 3403 – 3454 . [PUBMED] [INFOTRIEVE] [CSA] [CROSSREF]
- Mirabel , P. , Reiss , H. and Bowles , R. K. 2000 . A Theory for the Deliquescence of Small Particles . J. Chem. Physics , 113 ( 18 ) : 8200 – 8205 . [CSA] [CROSSREF]
- Onasch , T. B. , Siefert , R. L. , Brooks , S. D. , Prenni , A. J. , Murray , B. , Wilson , M. A. and Tolbert , M. A. 1999 . Infrared Spectroscopic Study of the Deliquescence and Efflorescence of Ammonium Sulfate Aerosol as a Function of Temperature . J. Geophys. Res. Atmospheres , 104 ( D17 ) : 21,321 – 326 . [CSA]
- Posfai , M. , Anderson , J. R. , Buseck , P. R. , Shattuck , T. W. and Tindale , N. W. 1994 . Constituents of Remote Pacific Marine Aerosol—A TEM Study . Atmos. Environ. , 28 ( 10 ) : 1747 – 1756 . [CSA] [CROSSREF]
- Posfai , M. , Simonics , R. , Li , J. , Hobbs , P. V. and Buseck , P. R. 2003 . Individual Aerosol Particles from Biomass Burning in Southern Africa: 1. Compositions and Size Distributions of Carbonaceous Particles . J. Geophys. Res. Atmospheres , 108 ( D13 ) : 8483 – 8495 . [CSA] [CROSSREF]
- Richardson , C. B. and Snyder , T. D. 1994 . A Study of Heterogeneous Nucleation in Aqueous-Solutions . Langmuir , 10 ( 7 ) : 2462 – 2465 . [CSA] [CROSSREF]
- Russell , L. M. and Ming , Y. 2002 . Deliquescence of Small Particles . J. Chem. Physics , 116 ( 1 ) : 311 – 321 . [CSA] [CROSSREF]
- Sharma , R. 2001 . Design and Applications of Environmental Cell Transmission Electron Microscope for In Situ Observations of Gas-Solid Reactions . Microscopy and Microanalysis , : 494 – 506 . [CSA]
- Sharma , R. and Weiss , K. 1998 . Development of a TEM to Study In Situ Structural and Chemical Changes at an Atomic Level During Gas-Solid Interactions at Elevated Temperatures . Microscopy Research and Technique , 42 ( 4 ) : 270 – 280 . [PUBMED] [INFOTRIEVE] [CSA] [CROSSREF]
- Tang , I. N. and Munkelwitz , H. R. 1984 . An Investigation of Solute Nucleation in Levitated Solution Droplets . J. Colloid and Interface Science , 98 ( 2 ) : 430 – 438 . [CSA] [CROSSREF]
- Tang , I. N. and Munkelwitz , H. R. 1994 . Aerosol Phase-Transformation and Growth in the Atmosphere . J. Appl. Meteorol. , 33 ( 7 ) : 791 – 796 . [CSA] [CROSSREF]
- Wexler , A. 1976 . Vapor Pressure Formulation for Water in the Range 0 to 100 C. A Revision . Journal of Research of the National Bureau of Standards , 73A ( 5 ) : 493 – 495 . [CSA]