The objective of this study was to investigate the feasibility of the Aerodynamic Particle Sizer (APS) and the Electrical Low-Pressure Impactor (ELPI) to study mass weighted particle size distributions. Unimodal and bimodal liquid test aerosols were produced to a small chamber. Simultaneous measurements were performed with an APS 3320, an APS 3321, an ELPI and a Dekati Low-Pressure Impactor (DLPI) analyzed gravimetrically. ELPI current and mass responses were simulated for lognormal size distributions using a parameterization of the impactor kernel functions. In experiments with a single coarse mode, the mass ratio to the DLPI was between 0.75 and 1.15 for both APS models up to 5 μ m and for the ELPI up to 3 μ m. For larger sizes the ELPI and APS 3320 overestimated and the APS 3321 underestimated the concentration. In experiments with a single fine mode, submicrometer ELPI and DLPI results were in good agreement. However, in contrast to the DLPI all three spectrometers showed a significant mass fraction above 1 μ m. In experiments with a bimodal size distribution, the mass ratios were altered compared to single coarse mode experiments. Simulations showed that uncertainties in ELPI measurements of larger particles occur when concentrations of small particles are high. Several mechanisms that may bias ELPI and APS measurements are described. With knowledge of these, ELPI and APS 3321 can, under many circumstances give accurate time-resolved mass size distributions for particles smaller than 3 and 5 μm, respectively.
*During the study, E. Gustavsson was affiliated with the Division of Ergonomics and Aerosol Technology, Lund University, Lund, Sweden.
**During the study, L. Asking was affiliated with Astra Zeneca R&D, Lund, Sweden.
INTRODUCTION
The mass-weighted size distribution of airborne particles is an often requested quantity in air quality or emission studies, since most environmental and health standards (e.g., PM2.5 and PM10) are set on a mass basis. When measurements are performed close to a source, such as in indoor and occupational environments or during emissions measurements, the particle size distribution may change rapidly over time. Currently there is a lack of methods to directly measure the mass size distribution with high time resolution.
In several studies, measurements of number- (or surface area) weighted size distributions have been used as surrogate to estimate the mass size distribution (CitationShen et al. 2002; CitationPark et al. 2003; CitationKhlystov et al. 2004). Slightly different approaches have been used. CitationPark et al. (2003) showed that the mass concentration can be calculated once the effective density ρ eff of the particles is known. For spherical nonporous particles, the effective density equals the inherent material density. For size classifications based on aerodynamic (D ae ) and mobility (D B ) equivalent diameters, the mass concentration, m i , in a measurement channel can be calculated from the number concentration, N i , C ae , and C B denote the Cunningham correction factor evaluated at the aerodynamic and mobility diameter, respectively and ρ0 denotes 1 g/cm3.
Small shifts in the size determination cause relatively larger errors in the assessed particle mass due to the cubic dependence of particle diameter in Equation (Equation1). Another problem is that a small fraction of the smaller particles that dominates the number concentration may be misclassified to the large particle size channels. This causes overestimation of the mass in these channels.
As an example in measurements of biomass combustion emissions from small district heating plants, the mass size distribution often consists of a dominating relatively constant mode in the 50–300 nm range and a time-varying super-micrometer mode (CitationPagels et al. 2003). Such distributions put high demands on the sensitivity of the size spectrometers. The Electrical Low-Pressure Impactor (CitationELPI, Keskinen et al. 1992) and the Aerodynamic Particle Sizer (CitationAPS, Agarwal et al. 1982) are two widely used spectrometers with high time resolution. The feasibility of such instruments to assess different mass size distributions, including bimodal, have been little studied.
The size classification in the ELPI and the APS is closely related to the aerodynamic equivalent diameter, which is the relevant property determining transport and deposition for particle sizes larger than about 0.5 μ m. This is an advantage compared to purely optical techniques (e.g., Optical Particle Counters; OPC), in studies where, for example, respiratory deposition, transport in the atmosphere or penetration through filters should be estimated. Furthermore, the relation between optical equivalent sizes determined with an OPC and the particle mass is strongly dependent on the optical properties of the particles and is affected by Mie-resonances (CitationMcMurry 2000).
The objective of this study is to evaluate the feasibility of the APS 3320, APS 3321, and the ELPI to assess the mass distribution. Instrument responses to liquid lab-generated polydisperse aerosols consisting of (1) a single fine mode, (2) a single coarse mode, and (3) a bimodal distribution consisting of a fine and a coarse mode are evaluated. To further interpret the data, ELPI responses are modeled for lognormal input size distributions using a mathematical model of the impactor performance.
AERODYNAMIC PARTICLE SIZER
The APS is a time-of-flight analyser, which determines a property closely related to the aerodynamic equivalent diameter for sizes between 0.5 and 20 μ m (CitationBaron and Willeke 2001). A fraction of the sampled aerosol is passed through a system of two acceleration nozzles. Single particles are counted and size classified by measuring the time-of-flight for transport between two laser beams. Particles with small aerodynamic diameters accelerate faster than larger particles due to inertia, thus having short time-of-flight. A calibration between time-of-flight and aerodynamic diameter is done for each instrument individual using spherical monodisperse test particles with known density (e.g., PSL spheres).
The APS has been extensively used to characterize ambient and indoor aerosols (CitationShen et al. 2002; CitationYanosky et al. 2002), combustion aerosols (CitationPagels et al. 2003; CitationFerge et al. 2004), and to characterize pharmaceutical inhalation devices (CitationStein et al. 2003). Often the APS has been used to quantify size-dependent penetration through filters and size-selective samplers (CitationGudmundsson et al. 1998).
For sizes larger than about 1 μ m, the particle Reynolds number is higher than 0.1 so the drag force the particles experience deviates from that predicted with Stokes law. The effects of particle density and shape on the relation between aerodynamic equivalent diameter and time-of-flight, then become more complex. Corrections for density effects are well established (CitationChen et al. 1990). Corrections for particle shape are more complex (CitationCheng et al. 1993), partly because nonspherical particles may preferentially orient themselves with their maximum cross-section perpendicular to the direction of motion. This increases the drag force, causing the particle size to be underestimated. For example, CitationMarshall et al. (1990) showed that the diameter given by the APS was about 25% lower than the aerodynamic diameter measured with a Timbrell spectrometer for Natrojarosite particles with a dynamic shape factor of 1.19. Due to the high acceleration field in the APS, liquid particles which are initially spherical may be distorted (CitationBartley et al. 2000) and orient in a similar manner as non-spherical particles. The size-shift increases with increasing droplet diameter and depends on liquid surface tension and viscosity. CitationGriffiths et al. (1986) found that the APS underestimated the aerodynamic diameters of Di-Ethyl-Hexyl-Sebacate (DEHS) droplets by 4, 10, and 16% for 5, 7, and 10 μ m droplets, respectively. CitationKinney and Pui (1995) have shown that for liquid particles there are substantial impaction losses in the inner acceleration nozzle for particles larger than about 5 μ m. These losses may be smaller for non-sticky solid particles.
In the earlier versions of the APS, models 3300 and 3310 (TSI Inc., St. Paul, Minnesota, USA), coincidence problems and phantom particles are encountered (CitationHeithbrink et al. 1991). These cause significant errors in mass size distributions at particle concentrations above 50–100 cm−3 (CitationPeters et al. 1993). The more recent models, 3320 and 3321, have upgraded optics and electronic detection circuitry, where the two laser beams partially overlap to eliminate coincidence and phantom particles (CitationHolm et al. 1997) at the expense of a reduced size resolution. In addition to time-of-flight, the maximum intensity of scattered light is stored for each particle. In the summing mode these are stored independently, while in the correlated mode, the time-of-flight and the light scattering signals are binned together for each particle.
Each detected particle is categorized into one of 4 events dependent on the structure of the continuous intensity signal recorded by the photo-detector. Event 1 consists of either particles with time-of-flight shorter than for the lowest size channel (0.532 μ m) or particles with only one maximum above the detection threshold. Event 2 particles are correctly classified particles with two peaks above the detection threshold. Event 3 particles have three peaks above the detection threshold and are caused by coincidence. Event 4 particles result when the signal is above the detection threshold longer than the timer range (4.1 μ s). It is not known how well the coincidence rejection system performs at high concentrations.
CitationStein et al. (2002) demonstrated that sizes of a small fraction of the classified particles in the APS 3320 are strongly overestimated. CFD calculations showed that these anomalous particles result from “recirculation” in the sensing volume. Although anomalous particles were few in number, they seriously distorted the mass size distribution. For example, the mass median aerodynamic diameter (MMAD) shifted from 0.5–1.5 μ m as measured with an Andersen cascade impactor to 3–14 μ m in the APS 3320 for the pharmaceutical Metered Dose Inhaler (MDI) devices characterized. Recirculating particles are not accelerated in a correct manner and thus have a long time-of-flight, while they scatter light corresponding to their smaller “true” diameter. Therefore, when sampling in the correlated mode some of the anomalous particles can be eliminated in the post analysis. However, CitationArmendariz and Leith (2002) showed that: (1) Size classification was not correct in the correlated mode. (2) There was a significant particle count loss increasing at lower concentrations. CitationArmendariz and Leith (2002) also compared the mass size distribution of liquid oleic acid aerosol measured with an APS 3320 and a Sierra cascade impactor. The mass detected with the APS 3320 operated in the summing mode after passing a 100:1 model 3302A TSI diluter was 0.4–1.0 of the mass gravimetrically determined with the Sierra impactor in the size range 0.5–5 μ m. For larger sizes, anomalous particles led to severe overestimation of the mass concentration.
Similar measurements were repeated for the same APS unit after upgrading to the 3321 version (CitationPeters and Leith 2003). Problems associated with recirculating particles and problems specific for the correlated mode were eliminated. However, the fraction of gravimetrically determined polydisperse oil aerosol (high vacuum oil) detected with APS 3321 was lower, 0.4–0.6, for particles between 0.8 and 4 μ m. It is not known if these counting efficiencies are applicable to other APS 3321 units and more studies are needed. CitationStein et al. (2003) found good agreement for several MDIs when comparing the results of an APS 3321 and an Andersen cascade impactor for both the MMAD and the geometric standard deviation (σg).
ELECTRICAL LOW-PRESSURE IMPACTOR
In the ELPI, particles are unipolarly charged to a well-defined level with a simple point type unipolar diode charger. The charged particles are then size fractionated according to the aerodynamic equivalent diameter in a 13-stage multi-jet low-pressure impactor equipped with electrically insulated stages. The electrical currents from the stages are detected with low-noise electrometers. Since unipolar charging is related to the active surface area for smaller particles, the primary signal of the ELPI is the aerodynamic size distribution of the active surface area (CitationBaron and Willeke 2001). In the conventional set-up, particles between 0.03 and 10 μ m can be detected, but for applications to for example engine exhaust, one impactor stage can be replaced by an electrical filter stage to detect particles from 0.007 to 6 μ m.
The ELPI has been extensively used to characterize combustion aerosols from engine exhaust (e.g., CitationShi et al. 2000; CitationVan Gulijk et al. 2004) and biomass (CitationLillieblad et al. 2004; CitationJohansson et al. 2004; CitationHays et al. 2003). Other examples of applications are for occupational (CitationBrouver et al. 2004) and ambient (CitationHitzenberger et al. 2004; CitationTemesi et al. 2001) aerosols and to characterize the charge state of pharmaceutical aerosols (Glouver et al. 2004). Yet another application is to retrieve information of particle morphology and effective density on-line in combination with differential mobility analyzers (CitationVirtanen et al. 2004).
The charger efficiency function, CE, relates the detected current, I, to the number concentration entering the instrument, N, and is used to determine number or mass size distributions. The charger efficiency depends strongly on particle size and the following power function is recommended by the manufacturer (CitationDekati 2002).
The charger efficiency depends on the charge that attaches to each particle, ne, the penetration through the charger, P, and the flow rate, Q. To experimentally determine the charger efficiency function one can use monodisperse particles and simultaneously measure the current with an ELPI and the number concentration with an APS or a Condensation Particle Counter (CPC) (CitationKeskinen et al. 1992; CitationMarjamäki et al. 2000). For submicrometer particles CitationMarjamäki et al. (2000) used a slightly different method, where the current resulting from the charge of particles that had passed the ELPI charger was compared to singly charged particles.
The charger efficiency is dependent on the mobility diameter, while the size classification is determined by the aerodynamic diameter. Therefore, the effective density which relates these two equivalent diameters needs to be known to calculate the number or mass concentration in each stage. In the current ELPI software, the collection efficiency function of each impactor stage is approximated by an ideal rectangular function and the CE function is evaluated at the stage geometric midpoint, D B,j (CitationBaron and Willeke 2001). The mass concentration in an impactor stage, j, is then estimated from the (corrected) stage current I j .
Uncertainties in mass concentrations due to simplifications in the software such as rectangular collection efficiency functions and uncertainties in the used CE-functions have received little attention in the literature. It has been briefly reported that the mass concentration calculated with the CE function given by CitationMarjamäki et al. (2000), leads to an overestimation of the particle mass for D ae larger than 2.5 μ m (CitationDekati 2002) of polydisperse DEHS aerosols. If an alternative CE function was derived (the one given in Equation Equation2), without correcting for APS losses in the number concentration measurement in the calibration by CitationMarjamäki et al. (2000), the agreement improved but large particle concentrations were still overestimated.
The collection efficiency curves of the cascade impactor can be calibrated with monodisperse particles using electrical detection with the whole cascade impactor assembled (CitationMarjamäki et al. 2000; CitationKeskinen et al. 1999). However, once an impactor design has been calibrated it is possible to predict the cut-off diameters, D ae,50 (aerodynamic diameter for 50% penetration) from measurements of the stage pressures (CitationHillamo and Kauppinen 1991). This is employed in the commercial ELPI system (Dekati Ltd., Tampere, Finland). The same cascade impactor design used without electrical detection is referred to as the DLPI (Dekati Low-Pressure Impactor; Dekati Ltd.).
CitationVirtanen et al. (2001) reported detailed measurements of secondary collection of particles much smaller than the cut-off diameter for sizes between 10–400 nm. These losses which are caused by diffusion and induced image charges were below 2.0% in each stage for 30 nm particles and below 0.5% for particles above 200 nm. Fine particles can cause a relatively large contribution to the detected current in the coarse particle impactor stages. A non-iterative calculation algorithm is used in the ELPI software to correct the detected raw current for particle losses (CitationMoisio 1999) according to the data by CitationVirtanen et al. (2001). Uncertainties in mass determinations of larger particles due to fine particle losses have been little studied. No experimental measurements of losses have been reported for particles larger than 400 nm for the ELPI/DLPI impactor.
CitationRistimäki et al. (2002) presented a procedure involving the impactor kernel functions to simulate the current response for a given number-weighted mobility size distribution. A parameterization of the collection efficiency curves of the ELPI/DLPI impactor, which neglects particle losses smaller than the cut-point, was recently presented by CitationDong et al. (2004).
Few evaluations of the instrument can be found in the literature. Mariq et al. (2000) compared an early version of the ELPI with the Scanning Mobility Particle Sizer (SMPS) for engine exhaust aerosol. CitationCowen et al. (2001) reported ambient air PM2.5 measurements from Pittsburgh and Fresno (US) with two 30 dm3/min ELPI units operated in parallel and the US federal reference method (gravimetrical analysis of filters). Results from the ELPI units were highly correlated with the gravimetric method (r 2 = 0.84 − 0.90). The mass ratio between the two ELPI units was 0.92 and 1.24 in the two measurement series. PM2.5 was significantly higher for ELPI compared to the gravimetric method (mass ratio 1.8–2.6). No drying system was applied and the differences may be partly attributed to particle bound water retained in the ELPI measurements.
METHODS
Aerosol Generation
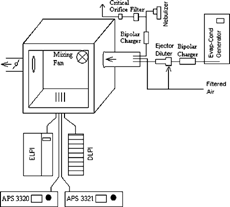
Coarse particles were generated with a nebulizer intended for drug delivery applications (Pari Boy, PARI GmbH, Germany). The nebulizer was operated with a pressure of 0.2 bar and the top valve blocked. Non-diluted liquid Di-Ethyl-Hexyl-Sebacate (DEHS) was used. The DEHS (Sigma Chemicals, > 99.5% purity) has a density of 0.91 g/cm3 and a sufficiently low volatility that evaporation can be neglected. The major part of the flow was controlled by a critical orifice connected to vacuum after a total filter and was discarded. A minor part of the flow was passed through a bipolar charger, diluted with filtered air and directed to a 0.5 m3 experimental chamber (). At the top of the chamber a fan operated at a low velocity to minimize concentration gradients without introducing high losses of the largest particles. The major difference compared to previous mass evaluation of the APS 3320/21 for coarse mode aerosol is the use of an aerosol generation system, which produces a relatively low number of particles so all instruments sample an adequate mass, without the necessity of using a diluter upstream the APS, thus avoiding uncertainties caused by estimation of losses and dilution ratio.
Figure 1 Experimental set-up used in the instrument evaluation to study mass size distributions of polydisperse aerosols.
Fine mode particles of DEHS were generated with a monodisperse particle generator of the evaporation-condensation type (model SLG 300, TOPAS GmbH Germany). The generator was used in the homogeneous nucleation mode without any seed aerosol. A fraction of the produced aerosol was passed through a bipolar charger and then diluted with filtered air in an ejector-type diluter (Dekati Ltd.). By controlling the pressure applied to the filtered air inlet of the diluter, the sample flow rate was stabilized. The aerosol was further diluted and transported to the 0.5 m3 chamber.
Measurement of Polydisperse Mass Distributions
Particles were sampled by an ELPI (Dekati Ltd.), an APS 3320 (TSI Inc.), an APS 3321 (TSI Inc.), and a low-pressure multi-jet cascade impactor (DLPI, Dekati Ltd.) used with gravimetrical analysis. The four instruments were operated simultaneously and particles were sampled with 10 and 13 mm inner diameter copper tubes, 50 mm apart. The thin-walled sampling tubes were directed upwards with entrances 100 mm above the bottom of the chamber. Soft bends of 45 degrees were used in the transport lines to fit the instruments. CitationSu and Vincent (2004) have reported experimental aspiration efficiencies in calm air for samplers positioned upwards with ratios of the sedimentation velocity to the sampling velocity (R c) of 0.1 and 0.01. For a given inlet Stokes number, the aspiration increases towards 1.0 with decreasing R c. R c values in our study were below 0.005. Predictions using R c = 0.01 for the highest Stokes number (20 μ m particles) in our study gives an aspiration larger than 0.99, therefore no correction for aspiration was applied. Calculated combined losses due to sedimentation and transport losses in bends (CitationBaron and Willeke 2001) were less than 0.5%, 2.5%, and 10% for 2, 5, and 10 μ m particles, respectively. Mass concentrations in each instrument were corrected for the calculated losses.
Triplicate experiments were performed with a single fine mode and with a single coarse mode. Duplicate experiments were performed for a bimodal size distribution. Each experiment lasted 90–100 min. The number concentration detected with the APS 3321 was 600–800 cm−3 in experiments with a single coarse mode, while in experiments with a single fine mode the estimated number concentration from the ELPI was ∼ 50,000 cm−3. The mass concentration was 0.5–1.5 mg/m3 for each mode.
The ELPI unit was a 10 dm3/min unit without the electrical filter stage (ELPI S/N 24237; cascade impactor S/N 2193), operated with non-treated bare stages. It had been operated ∼ 50 h and was delivered 6 months before the measurement. The APS 3321 (S/N 1078) had been operated ∼ 30 h since being upgraded from 3320 to 3321 and calibrated by the manufacturer 3 months before the measurements. The APS 3320 (S/N 1073) had been operated ∼ 200 h. The DLPI (S/N 2103) had been operated ∼ 100 h. The ELPI and APS instruments were run with filtered air for around 1 h prior to each experiment to reach temperature stability in the instruments. Zero level adjustment of the electrometers in the ELPI was performed just before starting an experiment. The charger and the impactor stages were cleaned with isopropyl alcohol as suggested in the operation manual before each set of experiments. The ELPIVI software (ver. 3.10, rev. 454, Dekati Ltd.) was used to process the raw data. The correction algorithm for particle losses was enabled and the measurement range 40000 pA was used. Charger efficiency functions from a calibration with monodisperse particles presented in this study were used to process the ELPI data. The results were compared with results obtained with CE functions recommended by CitationMarjamäki et al. (2000) and CitationDekati (2002).
The APS 3320 and 3321 were operated in the summing mode. The total flow rate (nominally 5.0 dm3/min) and the sample flow rate (nominally 1.0 dm3/min) were measured using a bubble flow meter (Gilian Gilibrator, US). The Aerosol Instrument Manager software (version 5.2, TSI Inc.) was used. The DLPI was used with bare aluminum substrates. After leak tests of the impactors, a pressure of 100 ± 2 mbar was established downstream the ELPI and DLPI. Volume flow rates through the impactors were measured with a bubble flow meter (Gilian Gilibrator). The flow rate through the ELPI and DLPI is stabilized by operating the final stage as a critical orifice.
The substrates were gravimetrically analyzed with a balance (Electronic semi-micro balance, model 2004 MP6, Sartorius) with 10 μ g resolution. Three non exposed blank substrates were handled identically to the exposed substrates in each impactor experiment. All substrates were discharged with a 210Po α -emitter before being weighed. Blank substrates never changed by more than 20 μ g on the scale of the balance. The standard deviation during tests with repeated weighing of non exposed substrates was estimated to 11 μ g. The maximum loading on a single substrate in each experiment was on the order of 300 μ g. From this the uncertainty associated with the gravimetrical analysis in mean concentrations from triplicate experiments was estimated to be less than 3% (standard error of the mean) in the stages with highest loading.
The mass ratio of the APS and ELPI instruments to the DLPI was calculated by dividing the ELPI and APS masses with the DLPI mass. The data from the softwares of the APS and ELPI instruments was first binned into sections corresponding to the DLPI cut-off diameters for each impactor stage. This approach assumes that the collection efficiency curves of the DLPI are rectangular. The effect of this simplification was evaluated both through simulations and through data inversion. Mass ratios were only reported when DLPI data points were within 10% of the inverted distribution and when estimated uncertainties from the gravimetric determination of the DLPI mean concentration were less than 10%.
Instrument Calibration
The particle size calibration of the APS instruments was checked with Polystyrene latex (PSL) spheres of sizes 0.945, 2.0, 3.3, and 5.0 μ m (Dyno spheres, Norway), before (only 3.3 and 5 μ m) and after the main measurement series. Airborne PSL spheres were produced by nebulization of a suspension diluted with Milli-Q water. The aerosol was diluted with dry air, heated to 40ˆC and passed through a mixing chamber before sampled simultaneously with the APS 3320 and 3321.
To determine the charger efficiency function of the ELPI, a narrow (σg < 1.2) particle size distribution of DEHS aerosol was produced with the TOPAS generator operated in the conventional mode with a low concentration NaCl seed aerosol. For 0.15–0.7 μ m particles, a DMA was used to narrow the size distribution down to σ g < 1.1. The calibration aerosol was passed through a bipolar charger and diluted (). The aerosol was then fed into the ELPI, a CPC 3010 and a CPC 3022 (TSI Inc.). The agreement between the two CPCs was within 3% and in most experiments only the CPC 3022 was used to determine the number concentration. The calibration resulted in direct measurements of the number concentration and the current, from which the charger efficiency relation was determined. The particle size distribution was checked with a SMPS system (TSI 3934) operated in a closed loop set up. The DMA was calibrated with 0.5 μ m PSL spheres. In connection with the CE calibration, the collection efficiency curves of the impactor were checked for stages 4–7, according to the electrical calibration method (CitationKeskinen et al. 1999).
Figure 2 Set-up used for calibration of the ELPI unit with monodisperse particles for 0.15–0.7 μ m particles (left) and 0.8–4 μ m particles (right).
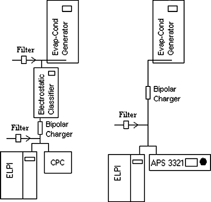
For particles sizes between 0.8 and 4 μ m, the aerosol from the TOPAS generator was diluted, then passed through a bipolar charger and directed with equal transport lines to an APS 3321 and the ELPI. This method is somewhat more uncertain since the APS is used as the standard for the number concentration and there are losses in the APS accelerating nozzle.
Modeling of ELPI and DLPI Response to Lognormal Input Distributions
The experimental study was accompanied by simulations of the ELPI and DLPI response to lognormal input distributions using a mathematical model of the impactor performance. This allowed us to model potential artifacts caused by sensor cross-sensitivity and the approach used in the ELPI software to calculate mass distributions. The following issues were studied (1) The electrical current signal to the coarse particle stages caused by losses of fine particles was modeled and compared with the signal from true coarse particles, (2) The mass response of the ELPI and DLPI was modeled using rectangular efficiency functions evaluated at the stage geometric mid point. This represents the approach used in the ELPI software and in normal use of the DLPI. The results were compared with the lognormal input distribution, (3) The influence on the mass response of secondary collected particles smaller than the stage cut-off diameter but larger than 400 nm.
Four lognormal distributions with a particle density of unit specific gravity and equal total mass concentrations (GMD = 0.13, 0.30, 3.0, and 4.7 μ m, with corresponding σg = 1.4, 1.4, 2.0, and 1.7) were used as input distributions. The mass concentration collected in stage j of the DLPI impactor, M j , can be determined from the integral over all sizes of the input mass distribution, m, with the stage kernel function, K j . Numerically this is formulated as a sum over q discrete particle diameters (Equation Equation4). 300 particle size channels between 0.02 and 20 μ m, equally spaced on a logarithmic diameter scale were used in the simulations.
For ELPI the current distribution, i q , leaving the charger has to be calculated (CitationRistimäki et al. 2002) from the input mass distribution. This is done by rearranging Equation (Equation3) and applying it in every (q) size channel. The resulting current, I j , in impactor stage j is then calculated with Equation (Equation5). Mass concentrations in each impactor stage were then evaluated at the stage diameter midpoint according to Equation (Equation3) to simulate the approach used in the ELPI software.
A parameterization of the impactor collection efficiency functions, E j , is given in Equations (6–9). Primary particle collection due to impaction on the impaction substrate, E imp (Equation Equation7), and secondary collection mechanisms are treated as competing independent mechanisms (the total penetration probability through an impactor stage is the product of the penetration probabilities of each mechanism). Particle deposition due to secondary mechanisms affects the collection efficiency curves only for low collection efficiencies below the cut-point of each stage. These mechanisms can be divided into a term, E Sec.Small , dependent on mobility diameter describing wall losses of small particles primarily by diffusion, (Equation Equation8) and a term, E Sec.Large , describing losses of larger particles due to for example impaction in impactor nozzles and on obstacles between each stage (Equation Equation9).
The impaction efficiency depends on two empirically determined parameters, D ae,50,j , the aerodynamic equivalent cut-off diameter and B j , a measure of the steepness of the collection efficiency curve for impactor stage j. We used values of B j fitted by CitationDong et al. (2004) to the calibration given by CitationMarjamäki et al. (2000). The parameterization of E Sec.Small is estimated from detailed measurements of losses up to 400 nm reported by CitationVirtanen et al. (2001), it approaches zero for particles larger than 400 nm. For particles larger than 100 nm, losses due to induced electrical image charges contribute to E Sec.Small . Our simple fit assumes that, for a given diameter, the losses are the same in each impactor stage. This agrees to within a factor of two with the experimental data, which is enough for the purpose of this work. In simulating the mass response of the ELPI, the E Sec.Small term was ignored, since a correction is made for this type of losses in the ELPI software.
In most of our simulations E Sec.Large was set to zero, due to lack of reliable data. However, to get a rough estimate of whether such losses have a noticeable effect on coarse mode mass distributions in the ELPI, we used in a few simulations an estimation which is based on loss data reported by CitationWang and John (1988) for the similar Berner Low-Pressure Impactor (BLPI). In our fit (Equation Equation9) the loss per stage due to E Sec.Large are zero below 0.4 μ m and increases linearly to a constant value of 1% above 1 μ m. As a simplification, losses are estimated to be the same in every stage for a given size.
Kernel functions of each impactor stage were then calculated according to the product given in Equation (Equation10). A graphical representation of similar Kernel functions can be found in CitationRistimäki et al. (2002).
Inversion Method to Fit Lognormal Distributions
The ELPI software and conventional DLPI analysis gives a single data point for each impactor stage. An additional inversion algorithm was used to fit lognormal modes to allow comparison of GMD and σg between the experimental data of the instruments. Further the inversion considers the impactor kernel functions to compare with the use of rectangular efficiency functions used in the ELPI software and normal analysis of the DLPI.
The inversion algorithm is based on the methodology described in the simulations above. One or two lognormal modes were fitted to the experimental DLPI data. To the ELPI data only a single mode was fitted since the effective numerical ranks of the inversion problem becomes relatively low for the mass moment (CitationLemmetty et al. 2005). From lognormal input mass distributions, the impactor response was simulated as described in the previous sections according to Equations (4) and (5). The term E Sec.Small was included and E Sec.Large was excluded.
Mobility sizes were used when evaluating the ELPI charger efficiency and to describe secondary collection of small particles. The best-fit lognormal mass distribution was calculated by minimizing the residual (sum of squares), S ELPI, between simulated (I sim,j ) and measured (I exp,j ) impactor currents (Equation Equation11), using weighted non-linear least squares regression analysis (CitationO'Shaughnessy and Raabe 2003). The current was chosen in the minimization procedure since it is the primary signal of the ELPI. A weighting factor, which consists of the size dependent terms of Equation (Equation3) was used not to bias the inversion procedure in particle diameter. A similar approach was used to find the lognormal mass distribution that minimizes the difference between simulated (M sim,j ) and experimental (M exp,j ) mass concentrations for the DLPI (Equation Equation12).
RESULTS AND DISCUSSION
Modeling of DLPI and ELPI Responses for Lognormal Input Size Distributions
The modeled ELPI current response of four lognormal input size distributions of equal mass is given in . The electrical current signal from the 0.13 μ m distribution fine mode is higher than the signal from the coarse distributions in every impactor stage and for the 0.30 μ m size distribution in stage 12. These effects are a consequence of the secondary particle collection due to diffusion and image charges incorporated in the kernel functions used in the simulations.
Figure 3 (a) Input current distributions (equal mass) and simulated ELPI current distributions. E Sec.Small included in the Kernel functions. (b) Input mass distributions and corresponding simulated ELPI mass distributions evaluated at the geometrical midpoints of each impactor stage, assuming rectangular collection efficiency functions. E Sec.Small excluded. (c) Input mass distributions and corresponding simulated ELPI mass distributions evaluated at the geometrical midpoints of each impactor stage. Effect of including E Sec.Large is demonstrated. E Sec.Small excluded. (d) Input mass distributions and simulated DLPI distributions evaluated at the geometrical midpoints of each stage. E Sec.Small included in the used Kernel functions.
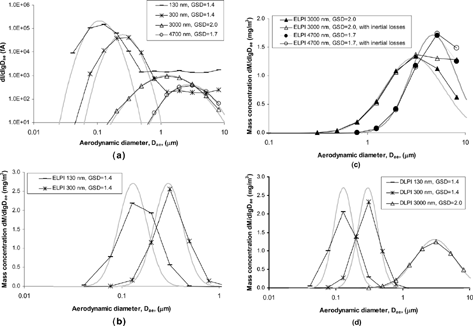
The low signal (true coarse particles) to noise (fine particles deposited in coarse particle stages) ratio may cause difficulties in performing the correction of fine particle losses in the ELPI software for bimodal distributions. Note that particle losses in the ELPI will also be recorded when particles deposit on other surfaces than the impaction substrate. Narrow mass distributions with GMD as low as 130 nm (in mobility size, which determines the losses) may occur, for example, in favorable biomass combustion.
Compared to the lognormal input distributions, the modeled ELPI mass responses () are slightly shifted to larger particles with wider size distributions. In addition, the total mass in the fine mode is slightly higher than the input mass. Deviations are strongest at the large particle tail of the distribution. The observed effects are caused by the use of rectangular collection efficiency curves used to simulate the approach in the ELPI software. The size shift and the overestimation in total mass occur because the true collection efficiency curves cause a fraction of particles to be collected in stages with higher cut-points than their true size. This leads to overestimation of the mass of these particles. It should be noted that the efficiency curves of stages 1–5 (∼ 30–250 nm) in the ELPI/DLPI impactor are less steep and sampling of smaller particles therefore gives larger uncertainties.
Collection of fine particles significantly smaller than the cut-off diameter due to secondary mechanisms (E Sec.Small ) is excluded from the analysis in because it is treated in the ELPI software. However, secondary losses of larger particles (E Sec.Large ) are not addressed in the present software. The influence of such losses is shown in . Note the overestimation in stage 12 for the largest particles. This is because the E Sec.Large term causes a larger tail toward the small particle end of the stage collection efficiency curve and stage kernel function. The mass ratio of ELPI to the input distribution is different for the two particle size distributions because the fraction of misclassified smaller particles is larger for the 3.0 μ m mode.
Shifts in diameter and distribution width are smaller for the DLPI () compared to the ELPI. In the case of DLPI, the non-ideal efficiency curves cause only a slight redistribution in size of the mass concentration.
Instrument Calibration
The agreement with the specified PSL diameter was within 2% for the APS 3321 for tests both before and after the main measurement series. However, there was a change in the calibration for the APS 3320 from agreement within 4% before to a 5–12% underestimation of the specified particle diameter after the main measurement series. The reason for the change is not known. The APS 3320 was omitted from the results of the bimodal size distribution due to the instability in the size calibration.
The ELPI charger efficiency values deduced from the calibration performed in this study () were about 30% higher than those given by the manufacturer (CitationDekati 2002) and CitationMarjamäki et al. (2000), that is, the current recorded with the ELPI unit was higher than expected from previous calibrations. Note that except for a constant offset there is good agreement with the CE function given by CitationDekati (2002). Therefore, we decided to keep the exponents in the Dekati CE function and their power function was simply multiplied with the best-fit factor 1.31. Note that the CitationDekati (2002) and CitationMarjamäki et al. (2000) are based on the same data set and only differs in neglecting losses in the reference instrument (an APS 3303) in the former.
Figure 4 Experimentally determined charger efficiency and fit according to the calibration performed in this study, compared to previously recommended fits.
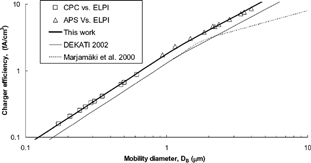
The cut-off diameters of the impactor given by the manufacturer from stage pressure measurements agreed to within 4% with our tests with monodisperse particles. With the exception of stage 5, the slopes of each stage were in relatively good agreement with those implemented in Equation (Equation7), based on the results of CitationMarjamäki et al. (2000). Stage 5 had a significantly steeper efficiency curve according to our measurements. However, it should be noted that in our measurements, fewer data points were used at each stage.
An uncertainty of 4% in the ELPI diameter measurement (cut-off diameter) and 2% in the volume flow rate gives a maximum uncertainty in mass concentration of around 8%. Errors in the charger efficiency, due to the simplified data reduction method in the software, the correction of losses due to secondary collection mechanisms and errors in the zero adjustments of the electrometers will also influence the results in this study.
For the APS, an uncertainty of 3% in diameter and 5% in the concentration measurement (from typical differences between the measured sample flow rate and that registered by the software), leads to an uncertainty in mass concentration of less than 15% according to Equation (Equation1). For the present study, errors due to droplet deformation, counting efficiency and particle miss-classification (e.g., anomalous particles in the APS 3320) will also influence the results.
Performance of the Particle Generation System
In , the mean values of the DLPI measurements from each experiment series are given as total mass concentration, inverted geometrical mean diameter and σg. The variability is given as the standard deviation of each series. Only small variations occurred in the size distributions within each experiment series. It should be noted that in bimodal experiments a larger mean diameter was used for the coarse mode compared to experiments with a single coarse mode. A representative time series for an experiment with a single coarse mode is given as total mass in a and as GMD in . Typically, relative standard deviations over time (coefficient of variation) in total mass and GMD were 5% for both the coarse and the fine mode.
Figure 5 (a) Representative time series of a coarse mode experiment. Total mass concentration calculated with the software of each instrument. (b) Representative time series of a coarse mode experiment. Geometrical mass mean diameter, calculated with the software of each instrument.
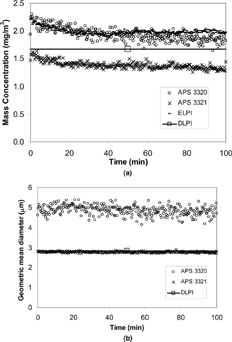
Table 1 Properties of the polydisperse aerosols used in the study according to the gravimetrical analysis with the DLPI. Uncertainties are estimated standard deviations from variations between experiments. GMD and σg estimated with the inversion procedure
The particle size distributions for the bimodal and single fine mode trials are similar to the size distributions from biomass combustion reported by CitationPagels et al. (2003) in terms of aerodynamic diameter and concentration after primary dilution.
Results of Polydisperse Mass Size Distributions
Mean size distributions from experiments with a single fine mode are given in and results of individual experiments in . There is relatively good agreement between the ELPI and DLPI data points and a further improvement is found in the inverted size distribution. All three spectrometers showed significant contributions to the total mass in the coarse mode range, although the coarse mode DLPI mass concentration was close to zero.
Figure 6 Mass size distributions from experiments with a single fine mode, given as mean results of three experiments. ELPI data points have been calculated with the ELPI software. Results of the ELPI and DLPI inversion procedures are given as lognormal fits.
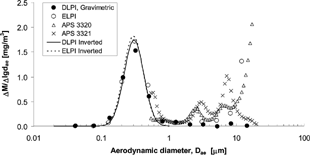
Table 2 Aerosol properties derived from each experiment in trials with a single fine mode. GMD and σg for DLPI and ELPI estimated with the inversion procedure
Mean size distributions from experiments with a single coarse mode are summarized in and results of individual experiments are given in . Relatively good agreement compared to the DLPI was found up to 5 μ m for both APS models and up to 3 μ m for the ELPI. For larger particles, ELPI overestimated the particle mass compared to the DLPI. The APS 3320 strongly overestimated the mass of particles larger than 10 μ m. The APS 3321 underestimated the mass larger than 5 μ m. The GMD was significantly higher for the APS 3320 and ELPI compared to the DLPI and the APS 3321.
Figure 7 Mass size distributions from experiments with a single coarse mode, given as mean results of three experiments. ELPI data points have been calculated with the ELPI software. Results of the ELPI and DLPI inversion procedures are given as lognormal fits.
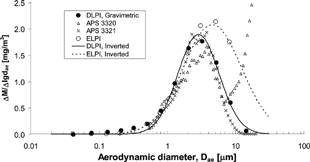
Table 3 Aerosol properties derived from each experiment in trials with a single coarse mode. GMD and σg for DLPI and ELPI estimated with the inversion procedure
In the experiments with both the fine and coarse mode present ( and ), there was a similar good agreement for the fine mode between ELPI and DLPI as in single fine mode experiments. The ELPI mass was overestimated compared to the DLPI for particles larger than 5 μ m. The APS 3321 was in relatively good agreement with the DLPI. However, note that the mass ratio of the APS 3321 to DLPI was higher than in experiments with a single coarse mode, especially for particles larger than 5 μ m.
Figure 8 Mass size distributions from the bimodal experiments, given as mean results of two experiments. ELPI data points have been calculated with the ELPI software. Results of the ELPI (only fine mode fitted) and DLPI inversion procedures are given as lognormal fits.
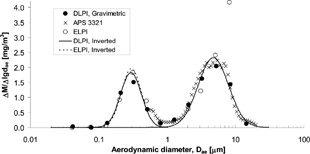
Table 4 Aerosol properties derived from each experiment in trials with bimodal size distribution. GMD and σg for DLPI and ELPI estimated with the inversion procedure
Interpretation of ELPI Results
Good agreement was found between ELPI and DLPI in the fine mode, when using the charger efficiency function deduced from the calibration performed in this study. The PM1 ratio of ELPI to DLPI for experiments with a single fine mode and bimodal size distributions were 1.05 ± 0.09 and 1.06 ± 0.10 with the CE function derived in this study. The corresponding ratios were 1.38 ± 0.14 and 1.39 ± 0.15 for the CE function given by CitationDekati (2002). The relatively good agreement between ELPI and DLPI data points and the improved agreement of the inverted distributions is supported by the simulations of and is a result of the steep collection efficiency curves in the size range.
The high concentrations in the coarse ELPI stages for experiments with a single fine mode are likely caused by fine particle losses. If loss correction is deactivated in the software the assessed mass concentration becomes dominated by coarse particles. Even a small error in the correction can result in non-negligible mass in the upper stages, due to the high value of the charger efficiency. For statistical reasons, negative values after loss correction may occasionally occur. Results showing negative masses are not allowed in the software and as a consequence, the mean value of many measurements will be biased high. In the ELPI software a correction warning can be given in each impactor stage when the correction is larger than a specified percentage of the reported signal. SMPS measurements showed that the particle concentration below the lowest impactor cut-off diameter (30 nm) was negligible. This is important since high concentrations below the lowest impactor cut-off diameter can be corrected for in the ELPI software, only when the filter stage is used.
In experiments with a single coarse mode, the DLPI data are in agreement to within 5% (between 1 and 10 μ m) with the inverted distribution, indicating that either data set can be used for the calculation of size dependent mass ratios. The results from the ELPI software overestimates the mass compared to DLPI for the largest particles. The inversion does not significantly improve the ELPI-DLPI agreement. It should be pointed out that the inversion algorithm does not take into account secondary collection of larger particles. The inverted distribution is very sensitive to noise in the upper two ELPI stages and is less reliable in this case. Overestimations in the experiments appeared for both the charger efficiency deduced here and the two CE functions reported in the literature. CE functions reported by CitationMarjamäki et al. (2000), where corrections are made for particle losses in the APS, serving as number reference in the calibration experiments, resulted in the highest overestimation.
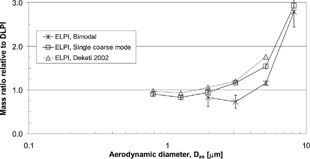
We calculated the mass ratio of the ELPI to the DLPI () to compare in more detail the performance of the instruments. A data set of similar parallel ELPI-DLPI measurements of polydisperse DEHS particles presented by CitationDekati (2002) is included for comparison. The charger efficiency function recommended by CitationDekati (2002) was used in the Dekati data set. Note that a similar size dependency of the mass ratio is found in the Dekati data set. As supported by the simulations () it is likely that secondary collection of particles smaller than the cut-off point not corrected for in the present ELPI-software contributed to the observed overestimation. However, errors in the chosen charger efficiency function for the larger particles can generate similar errors and the two effects are not easily separated. Simply adjusting the CE-function until best agreement with gravimetric measurements is not advisable since our simulations show that artifacts caused by secondary collection are dependent on the size distribution. A better option is to perform a detailed calibration of the collection efficiency curves of the upper ELPI stages extending down to 400 nm to capture the extent of secondary collection and complement previous data.
Figure 9 Mass concentration ratios of ELPI to DLPI in experiments with a single coarse mode and bimodal size distribution. Uncertainties given as estimated standard deviations. Estimated mass ratios from CitationDekati (2002) are included for comparison.
In a recent article, CitationMarjamäki et al. (2005) extrapolated their data on seconday particle collection to larger particles for the case of image charge losses. They used estimates of the charge level of the particles leaving the unipolar charger and found that the electrical mobility increases with size, which causes increases of image charge losses from around 0.1% at 200 nm to 2% at 3 μ m (stage 9). These losses are higher than those used in our simulations above 1 μ m.
The good agreement between the two ELPI units in , although two different CE functions were used, suggests that the CE function derived from calibration experiments presented in , may only be applicable for the unit used in this study.
In the measurements with a bimodal size distribution, the ELPI/DLPI agreement was again good for the fine mode, while an overestimation for ELPI was found for particles larger than 5 μ m. This is likely caused by a combination of the effects discussed for experiments with single modes. The mass ratio was slightly lower in the range 3–5 μ m compared to experiments with a single coarse mode. Note that the simulations in also predicted a lower mass ratio (when including E Sec.Large ). The correction term for fine particle losses (E Sec.Small ) is relatively large in the coarse particle stages in this case. Especially in stage 12 this may introduce uncertainties (simulations; ). It should be mentioned that the mobility sizes of fine mode particles sampled here were relatively large (200–300 nm) and diffusion deposition increases strongly with decreasing mobility size. As shown in the simulations, the signal to noise ratio problem will influence more stages if the fine particle mode shifts toward smaller sizes.
Interpretation of APS Results
Mass ratios of APS to DLPI are given in . In experiments with a single coarse mode there was good agreement between the APS 3321 and the DLPI mass in the range 0.8–5 μ m. A slightly lower mass ratio was found for the APS 3320. The underestimation of larger particles in the APS 3321 is assumed to be caused by a combination of impaction losses in the inner acceleration nozzle and underestimation of liquid particle sizes. The combined effects lead to a strong gradient in the counting efficiency in the range 5–10 μ m. The estimated counting efficiency due to the two mechanisms based on previous studies decreases from 0.75 to 0.25 between 5 and 10 μ m, which is slightly lower than our results. For the APS 3320 the mass ratio increases above 5 μ m and there is severe overestimation of particles larger than 10 μ m. This is identified as the “anomalous” particles recirculating in the sensor described by CitationArmendariz and Leith (2002) and CitationStein et al. (2002). Note that anomalous particles may appear at smaller diameters when the size distribution is shifted towards smaller particles, therefore any measurement above about 3–5 μ m with the APS 3320 should be treated with care.
Figure 10 Mass concentration ratios of APS to DLPI in experiments with a single coarse mode and bimodal size distribution. Uncertainties given as estimated standard deviations. Mass ratios reported by CitationPeters and Leith (2003) included for comparison.
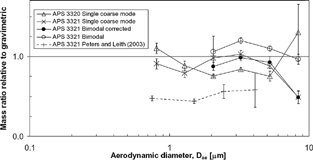
It can be noted that the mass ratio in the range 0.8–5 μ m reported here is significantly higher than that reported by CitationPeters and Leith (2003) for the APS 3321 and by CitationArmendariz and Leith (2002) for some sizes for the APS 3320. Reasons for the differences are not clear. CitationYanosky et al. (2002) reported a 30% difference in PM2.5 estimates from two APS 3320 units operated in parallel in indoor air measurements. Based on the available data sets it may therefore be recommended to calibrate the APS routinely, not only in terms of particle size, but also in terms of particle number or mass to enable quantitative measurements.
The APS systems were also included in the experiments with a single fine mode to study the performance of the coincidence rejection system in the APS 3320/21 series. Again, recirculating particles dominated in the APS 3320 for diameters larger than about 8 μ m. Particles recorded in the coarse range with the APS 3321 appear as pronounced peaks at around 3.0 and 7.5 μ m. When correcting the APS 3320 using the final size calibration after the main measurement campaign, the agreement of the peak diameters improves (this correction is plausible since experiments with a single fine mode were performed just before the final size calibration). The local maximum in the APS 3321 raw-data () appeared at accumulator bins with 2.5 and 1.6 times higher TOF than the bins with the highest number concentration.
Figure 11 Raw-data from single fine mode APS 3321 experiments, normalized to the mean time-of-flight.
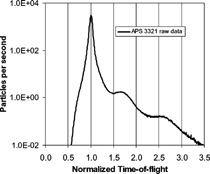
The total concentration of detected particles in the APS 3321 was ∼ 4000 cm−3, with around 40% of the particles categorized as event 1 (most of these had two peaks above the detection threshold, but TOF shorter than the smallest size channel, 0.53 μ m). The fraction of particles in the two supermicrometer “bumps” in was ∼ 0.3 and ∼ 0.03% of the total detected concentration. The fraction classified as event 3 coincidence particles was 7%.
When analyzing the photo-detector signal with an oscilloscope we found relatively large variations in signal intensity between the two peaks of single particles and between different particles. However, the spread in time-of-flight of the accumulator bin raw data was small (). A possible mechanism that may cause the APS to classify coincidence events as a valid event 2 particles is shown in .
Figure 12 A possible mechanism to produce coincidence counts in the APS 3320/21. The two particles arrive with a time-lag of half the time of flight of the single particles. The distance between the peaks of the combined signal is ∼ 1.35 the time-of-flight of the single particles.
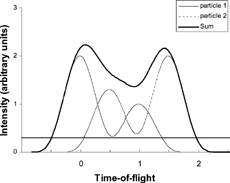
Assume that two particles with similar TOF but varying scattering intensity are simultaneously present in the sensor volume. The structure of the summed signal from the two particles depends strongly on the time-lag between the two particles. When the time-lag is below half the TOF, the combined signal has only two pronounced peaks and may be identified as a single event 2 particle with a TOF less than 1.5 of that for the individual particles. A similar event 2 like signal may be produced at the two local maximums in the mass distribution, but these require more complex combinations.
It should be noted that these experiments may represent an extreme situation with a total concentration of 50,000 particles cm−3, which are all at or just below the detection limit of the APS. We have observed other wider size distributions to give less problems with coincidence at the same detected number concentrations in the APS. Assuming that the reported effects are caused by coincidence, these are expected to be strongly reduced when the instrument is used at detected concentrations below 1000 cm−3. Extension of the range of APS measurements above 1000 cm−3 would improve the statistics for larger particles, especially in processes with fast time variations and high concentrations of small particles. Also it reduces the need for sample dilution, which may bias the size distribution. Therefore coincidence effects in the APS 3321 need to be studied systemically.
In experiments with a bimodal size distribution the mass ratio () was higher compared to the experiments with a single coarse mode. After subtracting particle counts detected in the experiments with a single fine mode with almost identical fine mode size distribution and concentration, the mass ratio reduced to that found in the experiments with a single coarse mode. This observation is consistent with the counts of the larger particles in single fine mode experiments being false counts caused by coincidence.
Implications for Mass Size Measurements with ELPI and APS
In general, liquid particles favor the impactor measurements (ELPI) because uncertainties related to particle bounce are avoided. In the APS, on the other hand, a size shift may be obtained for larger liquid particles and losses in the inner inlet may be larger compared to solid particles. Extrapolating the data from this study to solid particles should therefore be done with caution.
For many applications the main interest is in particles smaller than 5 μ m, where the APS 3321 has been shown to perform well. For example, the APS is often used in parallel with an SMPS system to cover the full size range up to 2.5 μ m. This study suggests that a well-calibrated APS 3321 can then give highly accurate data. One uncertainty not studied here is the counting efficiency in the size range 0.5–0.8 μ m.
Major uncertainties when estimating the mass for complex particle mixtures involve unknown effective density (Equation Equation1). Especially in atmospheric applications, the aerosol is externally mixed and effective densities may vary as much as from 0.3 for soot agglomerates (CitationPark et al. 2003) to higher than 2 for salts and crustal material. It should be noted that the effective density as given in Equation (Equation1) may not be appropriate for the APS for non-spherical particles, since preferential particle orientation can cause underestimation of the aerodynamic diameter and thereby the particle mass. The APS 3321 but not the APS 3320 may also give useful data for larger particles.
The ELPI has the advantage that it covers the full size range of interest in most situations, while uncertainties are introduced due to the limited size resolution. For ELPI, the measurement quality is also expected to increase for particles smaller than 2.5 μ m. For particles larger than 2.5 μ m, uncertainties still remain in terms of collection of particles smaller than the cut-point and the charger efficiency. A major limitation to ELPI measurements is the signal to noise ratio problem described in this study. It becomes less important for particles smaller than 2.5 μ m. However, in situations with high concentrations of ultrafine particles ( < 100 nm) for example from diesel engines and during nucleation events in the atmosphere, the measurement quality may decrease also for particles below 2.5 μ m.
Uncertainties requiring further study include the use of the mobility equivalent diameter in the charger efficiency function and material dependent field charging of larger particles. Bounce of solid particles and secondary collection mechanisms at high substrate loadings may be prevented by the use of sintered steel collection substrates (CitationMarjamäki et al. 2004) at the expense of less steep collection efficiency curves. An advantage with the ELPI is that uncertainties caused by unknown effective density are small for mass concentrations in the size range 0.1–1 μ m (CitationMoisio 1999). However, effective densities are needed to accurately apply the correction algorithm for small particle losses.
SUMMARY AND CONCLUSIONS
The procedure used in the ELPI software can give a good estimate of the mass concentration and size distribution when (1) the charger efficiency function is known, (2) stage collection functions are steep, (3) losses due to secondary collection efficiencies are known, and (4) the signal of particles collected with primary collection mechanisms is sufficient compared to the noise caused by secondary collected smaller particles. In several stages of the impactor the collection efficiency curves are less steep and secondary collection is not fully known. Then a more accurate interpretation/representation than the presently used rectangular efficiency curves is needed for more accurate mass distributions. However, as stated by CitationLemmetty et al. (2005) the nature of the third moment (volume and mass) ELPI response functions makes elaborative inversion methods difficult, when extracting multi-modal mass size distributions.
With the empirically determined charger efficiency from this study, fine mode ELPI and DLPI results were in good agreement. In single coarse mode and bimodal experiments, the ELPI mass concentration was significantly higher than the DLPI for particles larger than 3 and 5 μ m, respectively. This was attributed to secondary collection of particles smaller than the stage cut-off point and uncertainties in the charger efficiency function.
Relatively good agreement was found between the DLPI and both APS models in the size range 0.8–5 μ m. The mass ratio for the APS 3321 (0.8–1.0) is higher than previously reported. At 8 μ m the mass ratio decreased to 0.5, slightly higher than predictions from combined transport losses in the instrument and underestimation of droplet sizes. The APS 3320 showed severe overestimation for particles above 8–10 μ m, caused by false counts attributed to particles recirculating in the sensor.
In experiments with a single narrow fine mode at high number concentrations, both APS models showed a significant mass fraction above 1 μ m. These counts, which were suggested to be caused by coincidence are expected to be of minor importance at concentrations below 1000 cm3 (particles counted by the APS that is larger than about 0.2–0.5 μ m), but need to be further studied.
Several observations in this and other studies for both the ELPI and the APS 3321 have shown deviations in estimated masses of up to 30% between individual instruments, indicating that both size and concentration calibration need to be performed frequently. With this in mind, in many situations well-calibrated ELPI and the APS 3321 are expected to give reliable highly time- and size resolved mass size distributions up to 3 and 5 μ m, respectively. Presently, few other instruments can give such information.
Both instruments require knowledge of particle density. Major uncertainties include correction of small particles losses and sampling of solid particles in the ELPI and orientation effects of non-spherical particles in the APS. For larger particles, additional factors need to be further addressed, including the ELPI charger efficiency function and secondary collection mechanisms. For the APS 3321 additional factors include underestimation of liquid droplet sizes and inlet and transport efficiency.
Acknowledgments
This work was supported by the Building and Its Indoor Environment, a research school at Lund University and the Biofuels-Health-Environment project (Swedish Energy Agency, STEM). We are indebted to Dr. Michael Strand and Prof. Mehri Sanati at Växjö University for letting us use their ELPI and DLPI.
Notes
*During the study, E. Gustavsson was affiliated with the Division of Ergonomics and Aerosol Technology, Lund University, Lund, Sweden.
**During the study, L. Asking was affiliated with Astra Zeneca R&D, Lund, Sweden.
a Below 1 μ m.
b Above 1 μ m.
*Mtot denotes total mass concentration given as mg/m3.
REFERENCES
- Agarwal , J. K. , Remiarz , R. J. , Quant , F. R. and Sem , G. J. 1982 . Real-Time Aerodynamic Particle-Size Analyzer . J. Aerosol Sci. , 13 : 222 – 223 . [CSA]
- Armendariz , A. J. and Leith , D. 2002 . Concentration Measurement and Counting Efficiency for the Aerodynamic Particle Sizer 3320 . J. Aerosol Sci. , 33 : 133 – 148 . [CSA] [CROSSREF]
- Baron , P. A. and Willeke , K. 2001 . Aerosol Measurement—Principles, Techniques and Applications , 2nd ed. , New York : John Wiley & Sons .
- Bartley , D. L. , Martinez , A. B. , Baron , P. A. , Secker , D. R. and Hirst , E. 2000 . Droplet Distortion in Accelerating Flow . J. Aerosol Sc. , 31 : 1447 – 1460 . [CSA] [CROSSREF]
- Brouwer , D. H. , Gijsbers , J. H. J. and Lurvink , M. W. M. 2004 . Personal Exposure to Ultrafine Particles in the Workplace: Exploring Sampling Techniques and Strategies . Ann. Occup. Hyg. , 48 : 439 – 453 . [PUBMED] [INFOTRIEVE] [CSA] [CROSSREF]
- Chen , B. T. , Cheng , Y. S. and Yeh , H. C. 1990 . A Study of Density Effect and Droplet Deformation in the TSI Aerodynamic Particle Sizer . Aerosol Sci. Technol. , 12 : 278 – 285 . [CSA]
- Cheng , Y. S. , Chen , B. T. , Yeh , H. C. , Marshall , I. A. , Mitchell , J. P. and Griffiths , W. D. 1993 . Behavior of Compact Nonspherical Particles in the TSI Aerodynamic Particle Sizer Model Aps33B—Ultra-Stokesian Drag Forces . Aerosol Sci. Technol. , 19 : 255 – 267 . [CSA]
- Cowen , K. , Kelly , T. , Coutant , B. and Riggs , K. " Environmetal Technology Verification Report, Dekati Ltd., Electrical Low Pressure Impactor (ELPI). ." Particle Monitor. Battelle, EPA. , 2001, http://www.epa.gov/etv/pdfs/vrvs/01_vr_dekati_elpi.pdf 2004-12-10
- Dekati Ltd. 2002 . ELPI Charger Efficiency , Dekati Ltd. . Technical Note
- Dong , Y. , Hays , M. D. , Dean Smith , N. and Kinsey , J. S. 2004 . Inverting Cascade Impactor Data for Size-Resolved Characterization of Fine Particulate Source Emissions . J Aerosol Sci. , 35 : 1497 – 1512 . [CSA] [CROSSREF]
- Ferge , T. , Maguhn , J. , Felber , H. and Zimmermann , R. 2004 . Particle Collection Efficiency and Particle Re-Entrainment of an Electrostatic Precipitator in a Sewage Sludge Incineration Plant . Environ. Sci. Technol. , 38 : 1545 – 1553 . [PUBMED] [INFOTRIEVE] [CSA] [CROSSREF]
- Glover , W. and Chan , H. K. 2004 . Electrostatic Charge Characterization of Pharmaceutical Aerosols Using Electrical Low-Pressure Impaction (ELPI) . J. Aerosol Sci. , 35 : 755 – 764 . [CSA] [CROSSREF]
- Griffiths , W. D. , Iles , P. J. and Vaughan , N. P. 1986 . The Behavior of Liquid Droplet Aerosols in An Aps-3300 . J. Aerosol Sci. , 17 : 921 – 930 . [CSA] [CROSSREF]
- Gudmundsson , A. and Liden , G. 1998 . Determination of Cyclone Model Variability Using a Time-of-Flight Instrument . Aerosol Sci. Technol. , 28 : 197 – 214 . [CSA]
- Hays , M. D. , Smith , N. D. , Kinsey , J. , Dong , Y. J. and Kariher , P. 2003 . Polycyclic Aromatic Hydrocarbon Size Distributions in Aerosols from Appliances of Residential Wood Combustion as Determined by Direct Thermal Desorption—GC/MS . J. Aerosol Sci. , 34 : 1061 – 1084 . [CSA] [CROSSREF]
- Heitbrink , W. A. , Baron , P. A. and Willeke , K. 1991 . Coincidence in Time-Of-Flight Aerosol Spectrometers—Phantom Particle Creation . Aerosol Sci. Technol. , 14 : 112 – 126 . [CSA]
- Hillamo , R. E. and Kauppinen , E. I. 1991 . On the Performance of the Berner Low-Pressure Impactor . Aerosol Sci. Technol. , 14 : 33 – 47 . [CSA]
- Hitzenberger , R. , Berner , A. , Galambos , Z. , Maenhaut , W. , Cafmeyer , J. , Schwarz , J. , Muller , K. , Spindler , G. , Wieprecht , W. , Acker , K. , Hillamo , R. and Makela , T. 2004 . Intercomparison of Methods to Measure the Mass Concentration of the Atmospheric Aerosol During INTERCOMP2000—Influence of Instrumentation and Size Cuts . Atmos. Environ. , 38 : 6467 – 6476 . [CSA] [CROSSREF]
- Holm , R. L. , Caldow , R. , Hairston , P. P. , Quant , F. R. and Sem , G. J. 1997 . An Enhanced Time-of-Flight Spectrometer That Measures Aerodynamic Size Plus Light-Scattering Intensity . J. Aerosol Sci. , 28 : S11 – S12 . [CSA] [CROSSREF]
- Johansson , L. S. , Leckner , B. , Gustavsson , L. , Cooper , D. , Tullin , C. and Potter , A. 2004 . Emission Characteristics of Modern and Old-Type Residential Boilers Fired with Wood Logs and Wood Pellets . Atmos. Environ. , 38 : 4183 – 4195 . [CSA] [CROSSREF]
- Keskinen , J. , Marjamaki , M. , Virtanen , A. , Makela , T. and Hillamo , R. 1999 . Electrical Calibration Method for Cascade Impactors . J. Aerosol Sci. , 30 : 111 – 116 . [CSA] [CROSSREF]
- Keskinen , J. , Pietarinen , K. and Lehtimaki , M. 1992 . Electrical Low-Pressure Impactor . J. Aerosol Sci. , 23 : 353 – 360 . [CSA] [CROSSREF]
- Khlystov , A. , Stanier , C. and Pandis , S. N. 2004 . An Algorithm for Combining Electrical Mobility and Aerodynamic Size Distributions Data When Measuring Ambient Aerosol . Aerosol Sci. Technol. , 38 : 229 – 238 . [CSA] [CROSSREF]
- Kinney , P. D. and Pui , D. Y. H. 1995 . Inlet Efficiency Study for the Tsi Aerodynamic Particle Sizer . Particle & Particle Systems Characterization , 12 : 188 – 193 . [CSA] [CROSSREF]
- Lillieblad , L. , Szpila , A. , Strand , M. , Pagels , J. , Rupar-Gadd , K. , Gudmundsson , A. , Swietlicki , E. , Bohgard , M. and Sanati , M. 2004 . Boiler Operation Influence on the Emissions of Submicrometer-Sized Particles and Polycyclic Aromatic Hydrocarbons from Biomass-Fired Grate Boilers . Energy & Fuels , 18 : 410 – 417 . [CSA] [CROSSREF]
- Lemmety , M. , Marjamäki , M. and Keskinen , J. 2005 . The ELPI Response and Data Reduction II: Properties of Kernels and Data Inversion . Aerosol Sci. Technol. , 39 : 583 – 595 . [CSA] [CROSSREF]
- Maricq , M. M. , Podsiadlik , D. H. and Chase , R. E. 2000 . Size Distributions of Motor Vehicle Exhaust PM: A Comparison Between ELPI and SMPS Measurements . Aerosol Sci. Technol. , 33 : 239 – 260 . [CSA] [CROSSREF]
- Marjamäki , M. and Keskinen , J. 2004 . Effect of Impaction Plate Roughness and Porosity on Collection Efficiency . J. Aerosol Sci. , 35 : 301 – 308 . [CSA] [CROSSREF]
- Marjamäki , M. , Keskinen , J. , Chen , D. R. and Pui , D. Y. H. 2000 . Performance Evaluation of the Electrical Low-Pressure Impactor (ELPI) . J. Aerosol Sci. , 31 : 249 – 261 . [CSA] [CROSSREF]
- Marjamäki , M. , Lemmetty , M. and Keskinen , J. 2005 . ELPI Response and Data Reduction I: Response Functions . Aerosol Sci. Technol. , 39 : 575 – 582 . [CSA] [CROSSREF]
- Marshall , I. A. , Mitchell , J. P. and Griffiths , W. D. 1990 . Calibration of A Tsi-Aerodynamic Particle Sizer with Monodisperse Nonspherical Particles . J. Aerosol Sci. , 21 : S613 – S616 . [CSA] [CROSSREF]
- McMurry , P. H. 2000 . A Review of Atmospheric Aerosol Measurements . Atmos. Environ. , 34 : 1959 – 1999 . [CSA] [CROSSREF]
- Moisio , M. 1999 . Real-Time Size Distribution Measurement of Combustion Aerosols. , Tampere University of Technology, Publication 279 . PhD Thesis
- O'Shaughnessy , P. T. and Raabe , O. G. 2003 . A Comparison of Cascade Impactor Data Reduction Methods . Aerosol Sci. Technol. , 37 : 187 – 200 . [CSA] [CROSSREF]
- Pagels , J. , Strand , M. , Rissler , J. , Szpila , A. , Gudmundsson , A. , Bohgard , M. , Lillieblad , L. , Sanati , M. and Swietlicki , E. 2003 . Characteristics of Aerosol Particles Formed During Grate Combustion of Moist Forest Residue . J. Aerosol Sci. , 34 : 1043 – 1059 . [CSA] [CROSSREF]
- Park , K. , Cao , F. , Kittelson , D. B. and McMurry , P. H. 2003 . Relationship between Particle Mass and Mobility for Diesel Exhaust Particles . Environ. Sci. Technol. , 37 : 577 – 583 . [PUBMED] [INFOTRIEVE] [CSA] [CROSSREF]
- Peters , T. M. , Chein , H. M. , Lundgren , D. A. and Keady , P. B. 1993 . Comparison and Combination of Aerosol-Size Distributions Measured with A Low-Pressure Impactor, Differential Mobility Particle Sizer, Electrical Aerosol Analyzer, and Aerodynamic Particle Sizer . Aerosol Sci. Technol. , 19 : 396 – 405 . [CSA]
- Peters , T. M. and Leith , D. 2003 . Concentration measurement and counting efficiency of the aerodynamic particle sizer 3321 . J. Aerosol Sci. , 34 : 627 – 634 . [CSA] [CROSSREF]
- Ristimäki , J. , Virtanen , A. , Marjamäki , M. , Rostedt , A. and Keskinen , J. 2002 . On-Line Measurement of Size Distribution and Effective Density of Submicron Aerosol Particles . J. Aerosol Sci. , 33 : 1541 – 1557 . [CSA] [CROSSREF]
- Shen , S. , Jaques , P. A. , Zhu , Y. F. , Geller , M. D. and Sioutas , C. 2002 . Evaluation of the SMPS-APS System as a Continuous Monitor for Measuring PM2.5, PM10 and Coarse (PM2.5-10) Concentrations . Atmos. Environ. , 36 : 3939 – 3950 . [CSA] [CROSSREF]
- Shi , J. P. , Mark , D. and Harrison , R. M. 2000 . Characterization of Particles from a Current Technology Heavy-Duty Diesel Engine . Environmental Science & Technology , 34 : 748 – 755 . [CSA] [CROSSREF]
- Stein , S. W. , Gabrio , B. J. , Oberreit , D. , Hairston , P. , Myrdal , P. B. and Beck , T. J. 2002 . An Evaluation of Mass-Weighted Size Distribution Measurements with the Model 3320 Aerodynamic Particle Sizer . Aerosol Sci. Technol. , 36 : 845 – 854 . [CSA] [CROSSREF]
- Stein , S. W. , Myrdal , P. B. , Gabrio , B. J. , Obereit , D. and Beck , T. J. 2003 . Evaluation of a New Aerodynamic Particle Sizer (R) Spectrometer for Size Distribution Measurements of Solution Metered Dose Inhalers . Journal of Aerosol Medicine-Deposition Clearance and Effects in the Lung , 16 : 107 – 119 . [CSA]
- Su , W. C. and Vincent , J. H. 2004 . Experimental Measurements and Numerical Calculations of Aspiration Efficiency for Cylindrical Thin-Walled Aerosol Samplers in Perfectly Calm Air . Aerosol Sci. Technol. , 38 : 766 – 781 . [CSA] [CROSSREF]
- Temesi , D. , Molnar , A. , Meszaros , E. , Feczko , T. , Gelencser , A. , Kiss , G. and Krivacsy , Z. 2001 . Size Resolved Chemical Mass Balance of Aerosol Particles Over Rural Hungary . Atmos. Environ. , 35 : 4347 – 4355 . [CSA] [CROSSREF]
- Van Gulijk , C. , Marijnissen , J. C. M. , Makkee , M. , Moulijn , J. A. and Schmidt-Ott , A. 2004 . Measuring Diesel Soot with a Scanning Mobility Particle Sizer and An Electrical Low-Pressure Impactor: Performance Assessment with a Model for Fractal-Like Agglomerates . J. Aerosol Sci. , 35 : 633 – 655 . [CSA] [CROSSREF]
- Virtanen , A. , Marjamaki , M. , Ristimäki , J. and Keskinen , J. 2001 . Fine Particle Losses in Electrical Low-Pressure Impactor . J. Aerosol Sci. , 32 : 389 – 401 . [CSA] [CROSSREF]
- Virtanen , A. , Ristimäki , J. and Keskinen , J. 2004 . Method for Measuring Effective Density and Fractal Dimension of Aerosol Agglomerates . Aerosol Sci. Technol. , 38 : 437 – 446 . [CSA] [CROSSREF]
- Wang , H. C. and John , W. 1988 . Characteristics of the Berner Impactor for Sampling Inorganic-Ions . Aerosol Sci. Technol. , 8 : 157 – 172 . [CSA]
- Yanosky , J. D. , Williams , P. L. and MacIntosh , D. L. 2002 . A Comparison of Two Direct-Reading Aerosol Monitors with the Federal Reference Method for PM2.5 in Indoor Air . Atmos. Environ. , 36 : 107 – 112 . [CSA] [CROSSREF]