A novel bioaerosol sampling technique, which utilizes the bubbling process in the collection fluid, has recently been developed and found feasible for a long-term personal sampling of airborne bacteria and fungal spores as it maintained high physical collection efficiency and high microbial recovery rate for robust and stress-sensitive microorganisms. Further tests have shown that the new technique also has potential to collect viable airborne viruses, particularly when utilized for a short-term sampling of robust strains. As the short-term sampling has a limited application for assessing personal exposure in bioaerosol-contaminated environments, the present study was undertaken to investigate the feasibility of the “bubbler” for a long-term monitoring of viable airborne viruses. Liquid droplets containing Vaccinia virions (that simulate Variola, a causative agent of smallpox) were aerosolized with a Collison nebulizer into a 400-liter test chamber, from which the droplets were collected by three identical prototype personal samplers in the liquid medium during different time periods ranging from 1 to 6 hours. The viral content was measured in the collection fluid of the sampler and in the initial suspension of the nebulizer using the fluorescence-based method and by enumerating plaque-forming units per milliliter of the fluids. The relative recovery of viruses after the sampling act was determined. The results show that the “bubbling” technique has consistent collection efficiency over time and is capable of maintaining the viability of Vaccinia, for at least 6 hours, with a loss in recovery rate of about 10%. The data demonstrate a good potential of the new technique for measuring personal exposure to robust airborne viruses over a long period.
INTRODUCTION
A variety of techniques are currently used for monitoring viable airborne microorganisms (CitationBurge and Solomon 1987; CitationMacher et al. 1995; CitationReponen et al. 2001; CitationHo 2002; CitationGrinshpun et al. 2005). Most of the existing bioaerosol samplers utilize one of the following three collection methods: dry filtration, impaction onto a nutrient (e.g., agar), or impingement into a liquid. Although some other principles, such as electrostatic precipitation, have been also explored for bacteria (CitationMainelis et al. 1999, Citation2002a, Citation2002b) and viruses (CitationHogan et al. 2004), the above three methods are primarily used in the field. Due to a strong desiccation effect and subsequent low microbial recovery, the dry filtration is not generally recommended for a long-term viable bioaerosol monitoring and is primarily used for the total (viable + non-viable) microorganism enumeration (CitationCox and Wathes 1995). Direct collection of airborne microbes onto an agar surface has some limitations associated with the surface overloading (CitationReponen et al. 2001), impaction- and desiccation-caused stresses (CitationCrook 1995; CitationStewart et al. 1995), masking effect (CitationChang et al. 1994, Citation1995), the need of specific growth media for certain species (CitationCox and Wathes 1995), and other factors. Collection of viable bioaerosol particles into a liquid is often preferred over other methods. Indeed, the liquid sample can be adjusted through serial dilution to conduct analyses with various lower and upper limits of detection/enumeration. Furthermore, liquid sub-samples can be prepared and subsequently analyzed using various analytical procedures, which include not only culture-based and total microbial enumerations but also quantification of endotoxin, immunoassay, genetic analyses, and so on.
Most of commercially available impingers used for bioaerosol collection produce very high sampling velocities (up to 300 m/sec), which cause rather violent motion in the collection fluid that, in turn, enhances the liquid evaporation and re-aerosolization of the collected particles. These effects were quantified for the AGI-30 (Ace Glass Inc., Vineland, NJ, USA) filled with water (CitationLin et al. 1997; CitationGrinshpun et al. 1997). Some problems associated with conventional impingers have been addressed in the design of the Swirling Aerosol Collector (CitationWilleke et al. 1998), which is presently manufactured as the BioSampler (SKC Inc., Eighty Four, PA, USA). The BioSampler operates at a sampling flow rate of 12.5 L/min and utilizes a viscous, non-evaporative collection fluid. It has been found suitable for a long-term stationary sampling of airborne bacterial and fungi (CitationWilleke et al. 1998; CitationLin et al. 1999).
In general, presently available liquid impingers have been designed as stationary devices. They operate at relatively high flow rates (10–50 L/min) and exhibit rather high pressure drop (up to 50,000 Pa). Although these characteristics make them generally efficient for collecting small particles, these stationary samplers are not easily adaptable for the personal bioaerosol monitoring, which utilizes battery-operated pumps and requires rather low air flow resistance. A new concept based on a microbial collection by bubbling of the air through a porous medium submerged into a liquid (CitationAgranovski et al. 2002b) allows achieving high collection efficiency for submicrometer particles at relatively low sampling flow rates and under conditions that reduce mechanical stress on microorganisms. This concept has been materialized in a prototype personal sampler (CitationAgranovski et al. 2002a; CitationAgranovski et al. 2004a) called “the bubbler.” The device consists of inner (45 mm internal diameter) and outer (semi-cylinder with the internal diameter of 75 mm) cases with a porous media secured by a nut to the bottom of the inner case. The outer case is filled with 50 mL of collecting liquid so that the filter is fully submerged at the distance of 15 mm from the bottom of the outer case. The operational principle is based on bubbling of contaminated air through the filter submerged into a liquid layer, which subsequently split into a multitude of very small bubbles. The particulates are scavenged by these bubbles, and, thus, effectively removed. The sampler body is leakage-proof, and no spill of the collection fluid can occur as a result of human activities during personal sampling (the latter often becomes a concern when a liquid impinger is utilized as a personal sampler). A pen-type clamp is installed at the back wall of the sampler so that the device can be attached to the user's lapel for personal exposure monitoring. A portable vacuum pump is connected to the sampler's outlet to produce an air flow of 4 L/min.
The bubbler was shown to maintain the viability of bacterial and fungal microorganisms during a long-term sampling: the recovery rate of stress-sensitive, gram-negative P. fluorescens bacteria was 61 ± 20%, while stress-resistant B. subtilis bacteria and A. versicolor fungi demonstrated recovery of 95 ± 9% and 97 ± 6%, respectively (CitationAgranovski et al. 2002a). When challenged with the robust Vaccinia virus, the bubbler provided an 89% recovery after a 5-minute sampling (CitationAgranovski et al. 2004c). Although stress-sensitive Influenza virus recovered only at a 19% level (as reported in CitationAgranovski et al. 2004c), the “bubbling” technique showed promise, at least, for relatively stress-resistant viruses if they are collected during short-term intervals. This is remarkable given that viruses often exhibit much stronger response to stress than bacteria and fungi, making their collection from air environment especially challenging. Further testing revealed that the limit of detection of the newly developed “bubbler” collecting airborne viruses at 4 L/min was 125 PFU/L for the sampling time as short as 1 minute (PFU = Plaque Forming Units is the number of virions capable of forming plaque) (CitationAgranovski et al. 2004d). The limit of detection decreases linearly with the sampling time. However, it has not been determined whether the “bubbling” technique can ensure the same virus collection characteristics for the time periods considerably exceeding 5 minutes, which is often required for representative personal aerosol sampling. The current study was undertaken to evaluate the suitability of the prototype sampler for a long-term collection (up to 6 hours) using robust Vaccinia virus as a challenge aerosol.
METHODS
Test Virus
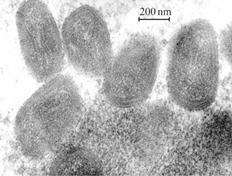
Vaccinia virus was chosen for this study because of its resistance to environmental stresses and since it is known as a surrogate of the smallpox-causing Variola. Both, Vaccinia and Variola are Orthopoxviruses; they have similar size and morphology and can be hardly distinguished by the electron microscopy (CitationHazelton and Gelderblom 2003). Robust viruses have recently gained a lot of interest because they are likely to be used in the event of bioterrorism or as a biological warfare. Microscopic photograph of Vaccinia obtained by the Transmission Electron Microscope (JEM-100S, Jeol, Tokyo, Japan) is presented in . Vaccinia is a relatively large virus with an aerodynamic diameter of about 400 nm. The viral strain LIVP (C0355 K0602) was obtained from the Ivanovsky Institute of Virology (Moscow, Russia) and passaged 10 times in embryonated chicken eggs. The virus-containing material at a concentration level of about 107 PFU per mL of liquid was obtained by culturing on cells 4647 (cells of Cercopetecus Aefiopsis embryo kidney) followed by a triple freezing/defrosting of the infected cell culture on the MEM maintenance media (MOM, Cat #11-100-22, ICN Biomedicals, Inc. Aurora, OH, USA). Before use in the experiments, the virus-containing media was kept at −70°C.
Experimental Apparatus and Protocol
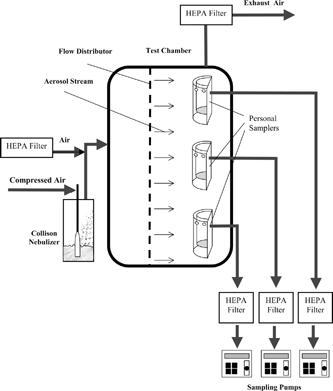
A diagram of the experimental setup is presented in . A 3-jet Collison nebulizer (BGI Inc., Waltham, MA, USA), operating at 6 L/min of filtered, compressed air, was filled with a diluted viral suspension containing 4 × 10⁴ PFU/mL. The nebulizer was recharged every hour with a fresh suspension to maintain the initial liquid level and to keep the viral concentration approximately the same throughout the entire procedure. Another portion of the dry, filtered air supplied at a flow rate of 10 L/min was mixed with the aerosol stream from the nebulizer before entering a 400-L dynamic test chamber, in which a horizontal aerosol flow of 0.1 m/s was established (CitationRyzhikov et al. 1995). A total air flow of 6 + 10 = 16 L/min allowed us to create appropriate operational conditions for the chamber (such as a uniform flow) and minimize the particle losses due to gravitational settling that may occur at low air velocities. The air flow uniformity was measured at the stage of the chamber commissioning and verified before each experimental run by both, optical particle counter (aerosol concentration), and hot wire anemometer (air velocity) at various points inside the facility (generally following an isokinetic procedure, as outlined in the US EPA Method 5). A variation between points did not exceed 10%.
Similar to our earlier study (CitationAgranovski et al. 2004c), a fluorescence dye (C20H10NA2O5, Fluka AG, Buchs, Switzerland) was added to the suspension in the nebulizer. This enabled us to quantify the amount of the viral material in the initial suspension (before aerosolization) as well as in the collection fluid (after sampling) using the fluorescence-based method. The relationship was established between the PFU concentration in a liquid and the fluorescence signal so that 1 fluorescence unit (FU) corresponded to 1 PFU. This was achieved at a fluorescence intensity of 4 × 10⁴ FU per mL. The amount of dye was subsequently determined for the nebulizer suspension. The fluorescence intensity was monitored by a fluorometer (FL-1, LOMO, St. Petersburg, Russia) with a resolution of 10 FU/mL.
Three identical bubbler prototype samplers, each filled by 50 mL of 2% Hanks solution containing bovine serum, anti-foam emulsion, and antibiotics (100 U/mL of penicillin and 100 μ g/mL of streptomycin), were placed into the test chamber and operated in parallel at a sampling flow rate of 4 L/min for up to 6 hours. The above-described collection fluid was chosen to maximize the viral recovery rate during the sampling procedure (CitationAgranovski et al. 2004a; CitationAgranovski et al. 2004b).
The amount of fluorescence in each sampler was measured after 1, 2, 4, and 6 hours, and a subsample of the collection fluid was taken at these time points for biological analysis to determine the viral concentration in the collecting fluid. The standard virus plaque assay procedure that conventionally utilized for Orthopoxviruses genera (CitationGould and Clegg 1985) was used for enumerating live viruses. Also, the samples of the initial suspension were taken from the nebulizer at the same points of time for the corresponding fluorescence measurements and PFU enumeration. To perform the procedure, the viral suspension was diluted in Erla medium containing antibiotics. Tenfold serial dilutions were conducted, and 100 μ L was added to confluent 4647 cell monolayers in 24-well cluster plates (Costar, Pleasanton, CA, USA). The cell culture produced from the kidney of African green monkey was obtained from the “Flow Laboratories” collection and cultivated in the Russian State Research Center of Virology and Biotechnology “Vector” (Koltsovo, Russia). Virus was allowed to adsorb for 1 hour at 37°C in a humidified incubator in a 5% CO2 atmosphere. Cluster plates were rocked every 10–15 min during 1 hour. The fluid was aspirated with an addition of 2 mL of overlay 1% agar (Difco) on the RPMI-1640 medium (containing 2% FCS and antibiotics). The cells were incubated for 48 hours at 37°C in a humidified incubator in a 5% CO2 atmosphere. Following this procedure, the cell monolayers were stained and plaques were enumerated.
Generally, the relative recovery rate can be calculated as the ratio of the PFU number per one fluorescence unit determined in the collection liquid after the sampling to that in the initial nebulizer suspension, i.e:
The concentration and size distribution of particles in the air was monitored by an optical aerosol spectrometer (Model 1.108, Grimm Aerosol Technik, Ainring, Germany). The experiments were performed at a relative humidity of 50–55% and an air temperature of 22–24°C. The HEPA filters were installed in the sampling lines (between the sampler and the sampling pump) and in the chamber's exhaust stream to protect the laboratory environment from the release of viruses.
RESULTS AND DISCUSSION
The particle size distribution of the virion-containing droplets measured by the optical aerosol spectrometer in the test chamber is presented in . Each data point represents the average of five experimental runs. The figure shows that the particle optical diameter ranged primarily from 0.5–2 μ m with the peak at about 1.1 μ m. The “carrier-to-virus” particle size ratio was ∼ 101. Since the relative humidity in the chamber was kept within a range of 50–55%, the particle size distribution was constantly changing as the particles were transported from the aerosolization point to the collection vessel. For that matter, it is important to specify that the probe of the aerosol spectrometer was placed inside the sampling inlet of the bubbler, right above the collection fluid level.
FIG. 3 The size distribution of virus-containing particles aerosolized by the nebulizer. The data represent the average values and the standard deviations of five measurements.
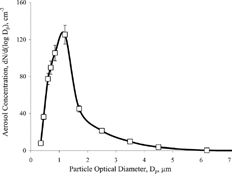
The decay in the Vaccinia virus concentration in the nebulizer suspension determined during one-hour time increments (between refills) did not exceed 7%. This suggests the consistency of the virion aerosolization conditions over the time of each experiment. Likewise, the real-time measurements of the aerosol concentration in the chamber (by the optical aerosol spectrometer) showed very high consistency. Thus, the bioaerosol in the sampling area had essentially the same characteristics during the entire test, and, therefore, any changes that could have occurred in the viral concentration of the collection fluid would solely represent the efficiency of the sampler.
presents the fluorescence intensity and the viral content in the collection fluid as a function of sampling time. Both functions show close-to-linear trend. An approximately constant rate of accumulation of viruses in the collection fluid over 6 hours demonstrates that the sampler collection efficiency is sustainable, which suggests a good potential of the “bubbling” technique for a long-term sampling of airborne viruses. As the physical collection efficiency generally depends on the particle size, it is acknowledged that in our experiments the particle size was represented by larger droplets carriers, not by single virions. On the other hand, if the liquid content of a droplet were to evaporate, the virion could be affected by desiccation environment and, as a result, become nonviable. The size range of virus-containing droplets generated in our tests was established to closely represent the naturally viral aerosol.
FIG. 4 Virus concentration in the collection fluid. The data represent the average values and the standard deviations of three measurements involving three identical samplers each.
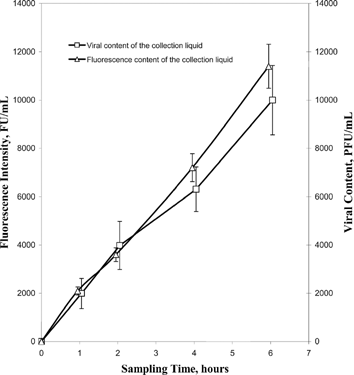
For an additional validation of the experimental method, a material balance calculation was carried out using the following information: the aerosolization rate of the nebulizer was 0.2 mL of liquid suspension per minute, the viral concentration in the nebulizer was 4 × 10⁴ PFU/mL, and the total air flow in the chamber was 16 L/min. Considering that the flow rate through each of the three samplers was 4 L/min, the maximum amount of liquid that could be possibly collected by each sampler per hour is 3 mL, and the corresponding amount of viral material is 12 × 104 PFU. This number of PFUs diluted in a 50 mL volume of the fluid in the sampler translates into a concentration of 2.4 × 10³ PFU/mL after an hour of continuous sampling. The experimentally measured viral concentration, obtained from the fluorescence-based analysis of the collection fluid following 1-hour sampling, was 1.95 × 10³ PFU/mL (as seen from ), that is, only 19% below the theoretical maximum. This relatively small difference can be attributed to the particle losses in the system.
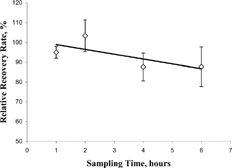
The data presented in show that the relative recovery of Vaccinia virus in the sampler was as high as about 90% during a six-hour operation. The inter-sampler variation did not exceed 20% for all the tests. In our earlier study (CitationAgranovski et al. 2004c), we obtained about the same average recovery rate of Vaccinia virus when performing a short-term (5-min) sampling with the bubbler. The present finding allows extending the sampling period much further. Some decrease in the recovery rate (represented by the regression curve and particular data points corresponding to 4 and 6 hours), is not statistically significant (p > 0.05), as verified by an ANOVA single factor test. A 10% loss in the viral recovery rate over 6 hours is indeed very low. The levels of Vaccinia survival in the bubbler obtained in this study is comparable to those found for stress-resistant bacterial and fungal strains, which were also collected by this sampler over prolonged sampling periods (CitationAgranovski et al. 2002b).
FIG. 5 Recovery rate of Vaccinia virus in the sampler. The data represent the average values and the standard deviations of three measurements involving three identical samplers each.
It is important to note that the data presented in this article were obtained with a robust virus strain and may not necessarily be applicable to viruses that are more sensitive. However, the primary public concern today is to be able to monitor particularly stress-resistant viral strains because of their association with emerging diseases and their deadly potential if used in bioterrorism activities.
REFERENCES
- Agranovski , I. , Agranovski , V. , Grinshpun , S. , Reponen , T. and Willeke , K. 2002a . Development and Evaluation of a New Personal Sampler for Viable Airborne Microorganisms . Atmos. Environ. , 36 : 889 – 898 . [CSA]
- Agranovski , I. , Agranovski , V. , Reponen , T. , Willeke , K. and Grinshpun , S. 2002b . Collection of Airborne Microorganisms into Liquid by Bubbling Through Porous Medium . Aerosol Sci. Tech. , 36 : 502 – 509 . [CSA] [CROSSREF]
- Agranovski , I. , Safatov , A. , Pyankov , O. , Sergeev , A. N. , Agafonov , A. , Ignatiev , G. , Ryabchikova , E. , Borodulin , A. , Sergeev , A. A. , Doerr , H. , Rabenau , H. and Agranovski , V. 2004a . Monitoring of Viable Airborne SARS Virus in Ambient Air . Atmos. Environ. , 38 : 3879 – 3884 . [CSA] [CROSSREF]
- Agranovski , I. , Safatov , A. , Borodulin , A. , Pyankov , O. , Petrishchenko , V. , Sergeev , A. , Agafonov , A. , Ignatiev , G. , Sergeev , A. and Agranovski , V. 2004b . Inactivation of Viruses in Bubbling Processes Utilized for Personal Bioaerosol Monitoring . Appl. Env. Microbiology , 70 : 6963 – 6967 . [CSA] [CROSSREF]
- Agranovski , I. , Safatov , A. , Borodulin , A. , Pyankov , O. , Petrishchenko , V. , Sergeev , A. , Sergeev , A. , Agranovski , V. and Grinshpun , S. 2004c . New Personal Sampler for Viable Airborne Viruses: Feasibility Study . J. Aerosol Sci. , 36 ( 5–6 ) : 609 – 617 . [CSA]
- Agranovski , I. , Safatov , A. , Sergeev , A. A. , Pyankov , O. , Petrishchenko , V. , Mikheev , M. and Sergeev , A. 2004d . Personal Sampler for Airborne Viruses; Determination of Lower Detection Limit . Lett. Appl. Microbiology , (under review)[CSA]
- Burge , H. A. and Solomon , W. R. 1987 . Sampling and Analysis of Biological Aerosols . Atmos. Environ. , 21 : 451 – 456 . [CSA] [CROSSREF]
- Comtois , P. and Isard , S. 1999 . Aerobiology: Coming of Age in a New Millennium . Aerobiologia , 15 : 259 – 266 . [CSA] [CROSSREF]
- Chang , C. W. , Hwang , Y. H. , Grinshpun , S. A. , Macher , J. M. and Willeke , K. 1994 . Evaluation of Counting Error Due to Colony Masking in Bioaerosol Sampling . Appl. Environ. Microbiology , 60 ( 10 ) : 3732 – 3738 . [CSA]
- Chang , C. W. , Grinshpun , S. A. , Willeke , K. , Macher , J. M. , Donnelly , J. , Clark , S. and Juozaitis , A. 1995 . Factors Affecting Microbiological Colony Count Accuracy for Bioaerosol Sampling and Analysis . Am. Ind. Hyg. Assoc. J. , 56 ( 10 ) : 979 – 986 . [PUBMED] [INFOTRIEVE] [CSA]
- Cox , C. S. and Wathes , C. M. , eds. 1995 . Bioaerosols Handbook. , Boca Raton , FL : CRC Lewis Publishers .
- Crook , B. 1995 . “ Inertial Samplers: Biological Perspective ” . In Bioaerosols Handbook , Edited by: Cox , C. S. and Wathes , C. M. pp. 247 – 267 . Boca Raton , FL : Lewis Publishers .
- Gould , E. A. and Clegg , J. C. S. 1985 . “ Growth, Titration and Purification of Alfa-Viruses and Flaviviruces ” . In Virology a Practical Approach, , Edited by: Mahy , B. W. J. pp. 43 – 78 . Oxford : Oxford University Press .
- Grinshpun , S. A. , Buttner , M. P. and Willeke , K. 2005 . “ Sampling of Airborne Microorganisms ” . In Manual of Environmental Microbiology , 3nd edition , Washington , DC : ASM Press . (in print)
- Grinshpun , S. A. , Willeke , K. , Ulevicius , V. , Juozaitis , A. , Terzieva , S. , Donnelly , J. , Stelma , G. N. and Brenner , K. 1997 . Effect of Impaction, Bounce and Reaerosolization on Collection Efficiency of Impingers . Aerosol Sci. Technol. , 26 ( 4 ) : 326 – 342 . [CSA]
- Hazelton , P. R. and Gelderblom , H. R. 2003 . Electron Microscopy for Rapid Diagnosis of Infectious Agents in Emergent Situations . Emerg. Infect. Dis. , 9 : 294 – 303 . [PUBMED] [INFOTRIEVE] [CSA]
- Ho , J. 2002 . Future of Biological Aerosol Detection . Analytica Chimica Acta , 457 : 125 – 148 . [CSA] [CROSSREF]
- Hogan , C. J. , Lee , M.-H. and Biswas , P. 2004 . Capture of Viral Particles in Soft X-Ray-Enhanced Corona Systems: Charge Distribution and Transport Characteristics . Aerosol Sci. Tech. , 38 : 475 – 486 . [CSA] [CROSSREF]
- Lin , X. , Reponen , T. , Willeke , K. , Grinshpun , S. A. , Foarde , K. K. and Ensor , D. S. 1999 . Long-Term Sampling of Airborne Bacteria and Fungi into a Non-Evaporating Liquid . Atmos. Environ. , 33 : 4291 – 4298 . [CSA] [CROSSREF]
- Lin , X. , Willeke , K. , Ulevicius , V. and Grinshpun , S. A. 1997 . Effect of Sampling Time on the Collection Efficiency of All-Glass Impingers . Am. Ind. Hyg. Assoc. J. , 58 : 480 – 488 . [CSA]
- Macher , J. M. , Chatigny , M. A. and Burge , H. A. 1995 . “ Sampling Airborne Microorganisms and Aeroallergens ” . In Air Sampling Instruments for Evaluation of Atmospheric Contaminants , Edited by: Cohen , B. S. and Hering , S. V. pp. 279 – 321 . Cincinnati , OH : ACGIH .
- Mainelis , G. , Grinshpun , S. A. , Willeke , K. , Reponen , T. , Ulevicius , V. and Hintz , P. 1999 . Collection of Airborne Microorganisms by Electrostatic Precipitation . Aerosol Sci. Tech. , 30 : 127 – 144 . [CSA] [CROSSREF]
- Mainelis , G. , Adhikari , A. , Willeke , K. , Lee , S. A. , Reponen , T. and Grinshpun , S. A. 2002a . Collection of Airborne Microorganisms by a New Electrostatic Precipitator . J. Aerosol Sci. , 33 : 1417 – 1432 . [CSA] [CROSSREF]
- Mainelis , G. , Willeke , K. , Adhikari , A. , Reponen , T. and Grinshpun , S. A. 2002b . Design and Collection Efficiency of a New Electrostatic Precipitator for Bioaerosol Collection . Aerosol Sci. Tech. , 36 : 1073 – 1085 . [CSA] [CROSSREF]
- Reponen , T. , Nevalainen , A. , Willeke , K. and Grinshpun , S. A. 2001 . “ Biological Particle Sampling ” . In Aerosol Measurement: Principles, Techniques, and Applications , 2nd edition , Edited by: Baron , P. A. and Willeke , K. pp. 751 – 777 . New York : Wiley & Sons .
- Ryzhikov , A. B. , Ryabchikova , E. I. , Sergeev , A. N. and Tkacheva , N. V. 1995 . Spread of Venezuelan Equine Encephalitis Virus in Mice Olfactory Tract . Arch. Virol. , 140 : 2243 – 2254 . [PUBMED] [INFOTRIEVE] [CSA] [CROSSREF]
- Stewart , S. , Grinshpun , S. A. , Willeke , K. , Terzieva , S. , Ulevicius , V. and Donnelly , J. 1995 . Effect of Impact Stress on Microbial Recovery on an Agar Surface . Appl. Environ. Microbiol. , 61 ( 4 ) : 1232 – 1239 . [PUBMED] [INFOTRIEVE] [CSA]
- Willeke , K. , Lin , X. and Grinshpun , S. A. 1998 . Improved Aerosol Collection by Combined Impaction and Centrifugal Motion . Aerosol Sci. Technol. , 28 : 439 – 456 . [CSA]
