Fine particle (PM2.5) emission rates and compositions from gray iron metal casting foundry were characterized for No-Bake molds poured at the Research Foundry located at Technikon, LLC (McClellan, CA). For each mold, PM2.5 was collected for chemical analysis, and particle size distributions were measured by an Electrical Low Pressure Impactor (ELPI) to understand PM emissions during different part of the casting process. Molds prepared with phenolic urethane binders were poured with Class 30 gray cast iron at 1,427–1,480°C. PM2.5 was collected from the pouring, cooling, and shakeout processes for each mold. Most of the PM2.5 mass emitted from these processes was composed of carbonaceous compounds, including 37–67% organic carbon (OC) and 17–30% elemental carbon (EC). Oxides of aluminum (Al), silicon (Si), calcium (Ca), and iron (Fe) constituted 8–20% of PM2.5 mass, and trace elements (e.g., K, Ti, Mn, Cu, Zn, and Pb) contributed 3–6%. Chemical abundances in PM were different between pouring and shakeout for each discrete mold. PM2.5 mass emissions from pouring were 15–25% of the total from each discrete mold. Ultrafine particles (< 0.1 μm) contributed less than 1% of PM2.5 mass, but nearly all of the particle numbers. Different mechanisms for pouring and shakeout result in variations in chemical abundances and particle size distributions. The highest PM2.5 mass and number concentrations were observed when shakeout started. PM2.5 size distributions in mass concentration during shakeout contained particles in the tail of coarse particles (1.6–2.5 μm) and a vapor condensation mode (0.65–1.6 μm). Flame conditions, vaporization, thermal decomposition of organic materials, and the variability of mold breakup during shakeout affect PM emission rates. A detailed chemical speciation for size-segregated PM samples at different process points needs to be conducted at full-scale foundries to obtain emission factors and source profiles applicable to emission inventories, source receptor modeling, and implementation of emission standards.
INTRODUCTION
U.S. foundry operations face many environmental challenges with implications for their competitiveness in the world market. The passage of the U.S. Clean Air Act Amendments of 1990 led to Air Toxics Regulations that include Maximum Achievable Control Technologies (MACT) regulations. MACT require foundries to meet hazardous air pollutant (HAP) emission levels equal to the average of those from the top 12% of the industry. The final version of the iron and steel foundry MACT (40 CFR Part 63), promulgated on 22 April 2004, requires that metal casting plants that are major sources begin controlling and monitoring their source emissions by 23 April 2007.
Although stationary source testing methods have not yet been specified for PM2.5 (particles with aerodynamic diameter less than 2.5 μm), MACT requires each foundry to demonstrate initial compliance by conducting performance tests for metal HAPs as well as organic HAPs. U.S. Environmental Protection Agency (EPA) Methods 18 and 29 are specified for the metals and organics, respectively. Methods 5 and 25A are allowed as surrogate methods for Methods 18 and 29, respectively. PM is collected on a glass fiber filter maintained at a specified temperature (near stack temperature), and the remaining gas stream passes through a series of impingers which are surrounded by ice at a temperature ∼0–4°C to collect condensable PM.
A dilution tunnel method (i.e., EPA Method 5G) is used for EPA certification of particulate emissions from residential wood combustion (CitationHouck et al. 2000; CitationMcCane and Williamson 1984; CitationMerill and Harris 1987). PM emissions from mobile sources employ a dilution tube to mix tailpipe emissions with clean ambient air maintained within a specified range of temperature and relative humidity (RH) (ISO 8178-1 and ISO 8178-2). Mobile source PM samples are collected isokinetically on filters from the dilution sampling system at a temperature of less than 52°C. The PM mass is then determined gravimetrically from the filter, similar to PM measurements made in ambient air.
Dilution sampling simulates the natural processes of PM formation in the atmosphere (CitationChang and England 2005), making emission measurements more relevant to human exposures. Comparisons between dilution sampling methods and the EPA hot-filter/impinger train method for collecting PM from a stationary source suggest that heated filter methods underestimate condensable species that are not collected at hot temperatures (CitationHildemann et al. 1989), and that the impinger method overestimates condensable species due to the formation of aerosols at ice cold temperatures and the adsorption of gases to water (CitationWien et al. 2001; CitationWatson 2002; CitationCorio and Sherwell 2000; CitationHolder et al. 2001). The sampling bias is more pronounced for sources containing low levels of solid particles and high condensable and soluble gases in the effluent. Discrepancies for source profiles developed from different source sampling methods may result in biases for emission inventories, air quality modeling, and emission trading. An ongoing effort of the American Society of Testing Methods (ASTM, D22.03) and the U.S. EPA (Conditional Test Method [CTM] 039, 2004) intends to define performance-based dilution sampling methodologies for stationary emission sources.
A lack of understanding about emission characteristics makes it difficult for the foundry industry to develop control and management strategies to comply with MACT. An objective of the Casting Emission Reduction Program (CERP) is to obtain representative PM emission data from different parts of the casting process. This study is the first of its kind to: (1) develop relationships among emissions of total hydrocarbon (THC), PM2.5, and emission parameters; (2) characterize the physical properties (size distributions of particle number and mass concentrations) of PM2.5 emissions in single-pour molds; (3) establish a baseline for speciated PM2.5 emissions in single-pour molds; and (4) validate the applicability and optimize the operation of the dilution sampling method for characterizing foundry emissions.
EXPERIMENTAL TEST METHOD AND FACILITY
Test Facility
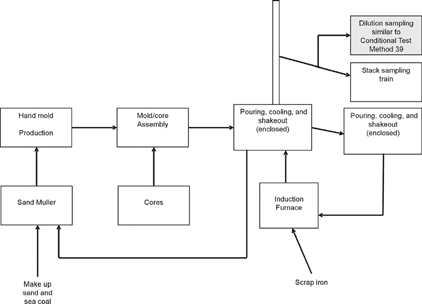
Samples from casting processes were collected from the Research Foundry at Technikon, LLC (McClellan, CA), under the sponsorship of the Casting Emission Reduction Program (CERP). The Research Foundry is designed to measure emissions from individually poured molds and is used to evaluate the impact on emissions from proposed alternative materials, equipment, or processes, prior to further validation at a full-scale foundry. Measurements at the Research Foundry were taken during the pouring, cooling, and shakeout processes for discreet molds under tightly controlled conditions. The flue gas was withdrawn from approximately the center of a 10 cm diameter duct at a port 5 m from the pour. The extracted sample was split into two streams: one was connected to the Desert Research Institute (DRI) Source Dilution Sampling System (CitationHildemann et al. 1989; CitationChang et al. 2004), which is similar to CTM 039; and the other connected to a modified EPA Method 201A with a PM2.5 cyclone (EPA CTM 040), followed by the EPA Method 202 impinger sampling train (). The results of PM2.5 emission factors between methods will be discussed in a companion paper (Sheya et al. 2005).
Figure 1 Schematic of the casting process and sampling location in the Research Foundry at Technikon, LLC (McClellan, CA).
The Technikon CERP testing team prepared the molds to a standard composition and recorded the following data: weight of the metal, mold binder composition and weight, number of cavities poured, percent lost on ignition (LOT), pouring temperature, and alloy weights. The mold pattern was a 4-on irregular gear, made with Wexford W450 Lakesand. The HA International Techniset® (Illinois) No-Bake® Phenolic-Urethane mold binder was 1.8% total binder (BOS) composed of number 6000 Part I resin (55%), 6433 Part II co-reactant (45%), and 17-727 Part III activator at 7% of Part I. Molds were poured with Class 30 gray cast iron at 1,427–1,482°C.
Within-duct conditions—such as concentrations of THC, carbon monoxide (CO), gas velocity, temperature, moisture, gas density and molecular weight, and absolute pressure—were monitored throughout the test. The initial sand temperature into the hood was maintained at 26.5–32.2°C with a minimum system process air temperature of 43.3°C. No particulate removal equipment was installed in the stack before the flue gas exhaust was extracted.
Dilution Sampling System
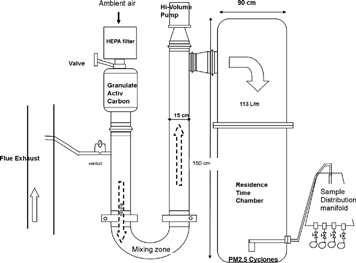
The DRI source dilution sampling system () draws 20–25 L/min of flue gas through a venturi flowmeter. The design and characterization of this dilution sampling were described in detail elsewhere (CitationHildemann et al. 1989). In brief, the sample line is heated at a temperature slightly higher than that of the flue gas to reduce particle thermophoresis losses and gas condensation on the probe. Ambient air passes through a high-efficiency particulate air (HEPA) filter to remove PM, followed by a granulated activated carbon bed to remove gaseous species and volatilized PM. The clean, cool ambient air dilutes and mixes with the flue gas in the U-shaped mixing zone. At the end of the mixing zone, 113 L/min of diluted sample at near ambient temperature and pressure is drawn into a residence chamber for 90 seconds of aging time, which permits the particles to cool, nucleate, coagulate, and grow by condensation. The excess flow is removed by a high-volume pump. A Bendix/Sensidyne 240 PM2.5 cyclone (Sensidyne®, Clearwater, FL) is used to remove larger particles (CitationChan and Lippman 1977). Sample flow enters the Teflon-coated distribution manifold, where two filter packs collect the PM samples for mass and chemical speciation. An additional port is connected to an Electrical Low Pressure Impactor (ELPI, Dekati, Finland) to measure particulate size distribution. The filter pack configurations include: (1) polyolefin-ringed Teflon membranes (2.0 μm pore size, 47-mm diameter, [#R2PJ047], Pall Life Sciences, Ann Arbor, MI) for mass and elemental analysis, followed by a pre-fired quartz-fiber filter (Pallflex, [QAT-2500-UP], Pall Life Sciences, Ann Arbor, MI) to quantify volatilized carbon; and (2) a pre-fired quartz-fiber filter for soluble ion and carbon analyses followed by a cellulose-fiber filter (47-mm in diameter, Whatman 31ET, Hillsboro, OR) impregnated with citric acid to collect gaseous ammonia (NH3). The flow rate, monitored by calibrated mass flowmeters (Model 3063, TSI, Shoreview, MN), was 51 L/min at ambient temperature and pressure through each Teflon/quartz and quartz/citric acid impregnated cellulose filter pack, and was 10 L/min for the ELPI. The filter packs were pre-loaded in the laboratory and equipped with quick-release connectors to minimize contamination. A data acquisition system monitored and recorded the flow rates of the venturi flowmeter and sample ports, as well as the temperature and RH of the ambient air and the diluted exhaust.
Figure 2 Schematic of the Desert Research Institute (DRI, Reno, NV) Source Dilution Sampling System.
Five tests were conducted under the same duct-supplied air temperature (29°C–35°C) and duct velocity. The sample collection schedule, duct flow rate, cast weights, and binder weights are shown in . Each dilution sampling test consisted of a complete, three-step, casting process of 4,500 seconds (2,700 seconds of pouring and cooling [regarded as a single step of pouring], 900 seconds of shakeout, and 900 seconds of after-cooling), except for Run 2, which sampled only 2,160 seconds of pouring and cooling due to a regional power failure. For filter pack sampling and ELPI measurements, 120–180 seconds of sampling time was added to adjust the target dilution air ratio at the beginning of every test and to include the 90-second aging time in the residence chamber.
TABLE 1 Daily test conditions for comparisons of the dilution sampling method and U.S. Environmental Protection Agency (EPA) Modified Method 201A (Conditional Test Method 040)/202 sampling train from the Research Foundry at Technikon, LLC (McClellan, CA) from February 25–27, 2004
Sample Analysis
PM2.5 mass was determined as the difference between pre- and post-sampling masses measured on Teflon-membrane filters with an MT 5 microbalance (Mettler, Placerville, CA) in a room controlled at 21.5 ± 2°C and 35% ± 5% RH. After weighing, Teflon-membrane samples were submitted for energy dispersive X-ray fluorescence (ED-XRF, Kevex0700, Kevex Corp., Foster City, CA) analysis of 40 elements (Na to U) (CitationWatson et al. 1999). Inorganic ions and carbon were determined from deposits on quartz-fiber filters. Chloride (Cl−), nitrate (NO− 3), and sulfate (SO4 =) were measured on one half of the quartz fiber filter extracted in distilled de-ionized water (DDW) by ion chromatography (IC) (CitationChow and Watson 1999) with a Dionex 500x system (Dionex, Sunnyvale, CA), after ammonium (NH4 +) was measured by the indolphenol method using an automated colorimetric (AC) system (Astoria-Pacific, Clackamas, OR). Citric acid impregnated cellulose-fiber filters were extracted in 0.1 M sodium citrate solution followed by AC analysis to determine NH3 as equivalent NH4 +. Eight organic and elemental carbon (OC, EC, and pyrolized carbon) fractions were determined following the Interagency Monitoring of Protected Visual Environmental (IMPROVE) protocol (CitationChow et al. 1993) using the DRI Model 2001 thermal/optical carbon analyzer. PM2.5 particle size distributions in the diluted effluent were measured continuously by the ELPI, which uses a unipolar corona charger to impart a positive charge on the measured aerosol and separates particles by impaction into 12 size fractions: 0.007–0.03, 0.056, 0.1, 0.22, 0.3, 0.59, 0.91, 1.5, 2.5, 3.8, 6.4, and 10 μm. The impaction substrates are electrically isolated with Teflon supports, and the accumulating charge on each impactor stage is measured by an array of electrometers. The measured current is proportional to the number of particles depositing on the stage, which can be converted to mass by assuming a spherical particle shape and density of 1 g/cm3. The 1-second response time of the ELPI allows for characterization of rapid changes in the particle-size distributions during the casting cycle.
RESULTS
Emission Factor
compares PM2.5 mass concentrations determined by filter samplers and the ELPI for each test. CitationChang et al. (2004) found that a dilution air ratio of 20 is sufficient to achieve stable ultrafine particle size distributions for most stationary source emissions.
TABLE 2 PM2.5 mass concentrations determined by filter sampler and electronic low-pressure impactor (ELPI) with DRI source dilution sampling system (similar to U.S. Environmental Protection Agency [EPA] Conditional Test Method 039)
This dilution air ratio was applied in Run 2, but it was increased in subsequent tests, as seen in , to minimize potential overloading for the filter samples. The in-stack PM2.5 mass and number concentrations were determined as:
shows that in-stack PM2.5 mass concentrations for each test range from 36 to 101 mg/m3. An average PM2.5 mass concentration of 1.1 mg/m3 was observed in diluted samples for Run 6. The high PM2.5 mass concentration in the diluted sample resulted in high mass loading of 2.7–4.7 mg on filter media for each 4,500 second test. ISO 8178-1 recommends a gas face velocity of 35–80 cm/s and a minimum loading of 0.465 μg/mm2 (i.e., 0.5 mg/1,075 mm2); thus, a dilution air ratio of 60 or higher is realistic for dilution sampling from this process.
The average PM2.5 mass for each of pouring/cooling and shakeout/after-cooling processes is compared by integrating the PM2.5 mass measured by ELPI during each process. shows that the pouring and cooling processes accounted for 15–27% of the total emissions. The average ELPI PM2.5 mass concentrations show reasonable agreement with the filter mass measurements. PM2.5 mass by ELPI are 77–95% of those determined by the filter samplers, and a ratio of 0.73 was observed for Run 2 (pouring and cooling). This result suggests that the ELPI can be used to estimate PM2.5 mass concentrations by applying an effective density of 1.175 g/cm3 for the materials used in these tests. Additional work is needed to confirm that this value is appropriate for conditions applied in an operating foundry.
The emission factors of PM2.5 chemical species are shown in in both pound (Ib) species/lb binder and Ib species/ ton metal. For the entire casting process, the most abundant species are carbonaceous compounds with an emission factor of 3.03 × 10⁻¹ to 6.26 × 10⁻¹ lb C/ton metal (2.45 × 10⁻³− 6.42 × 10⁻³ lb C/lb binder) for OC and 1.59 × 10⁻¹ to 5.47 × 10⁻¹ lb C/ton metal (1.28 × 1O−3 − 5.80 × 10⁻³ lb C/lb binder) for EC; i.e. OC carbon constitutes 37–67% of PM2.5 mass and EC constitutes 17–30%. Species that contributed more than 1% of PM2.5 mass (i.e., > 1.00 × 10⁻⁴ lb/ton metal or 1.00 × 10⁻² lb/lb binder) include silicon (Si), manganese (Mn), and iron (Fe). Emission factors and source profiles may differ for other core and binder materials.
TABLE 3 Emission factors of PM2.5 chemical species from the foundry process (4-on irregular gear No-Bake® molds). No weighing factors for metal oxides and organic carbon are applied
Process Variation of PM2.5 Emissions
The process variations of stack conditions and PM2.5 mass and number concentrations for Runs 3–6 are shown in and . Consistent patterns were observed among individual tests. In general, PM2.5 mass and number concentrations, stack temperature, and CO concentration increased rapidly as the cast iron was poured and decreased during the cooling period, except THC concentration increased gradually and was elevated by two to four fold. Maximum emissions occurred as shakeout started and decayed gradually during after-cooling process.
Figure 3 Process variations of stack temperature (°C), carbon monoxide (CO) concentration (ppm), and total hydrocarbon concentration (THC) (ppm), measured in: (a) Run 3, (b) Run 4, (c) Run 5, and (d) Run 6. (Note that peak stack temperature [°C] in Runs 5 and 6 during shakeout period exceeds 300°C; in Runs 3 and 4 it is ∼ 200°C.)
![Figure 3 Process variations of stack temperature (°C), carbon monoxide (CO) concentration (ppm), and total hydrocarbon concentration (THC) (ppm), measured in: (a) Run 3, (b) Run 4, (c) Run 5, and (d) Run 6. (Note that peak stack temperature [°C] in Runs 5 and 6 during shakeout period exceeds 300°C; in Runs 3 and 4 it is ∼ 200°C.)](/cms/asset/b998935f-425c-4ed2-af7c-d902b74a3ead/uast_a_133460_o_f0003.jpg)
Figure 4 Process variations of PM2.5 concentration (4 μg/m3) and number concentrations (particles/cc) measured by ELPI for: (a) Run 3, (b) Run 4, (c) Run 5, and (d) Run 6. (Note that PM2.5 mass concentrations in Runs 5 and 6 are approximately twice those of Runs 3 and 4, whereas PM2.5 number concentrations are similar.)
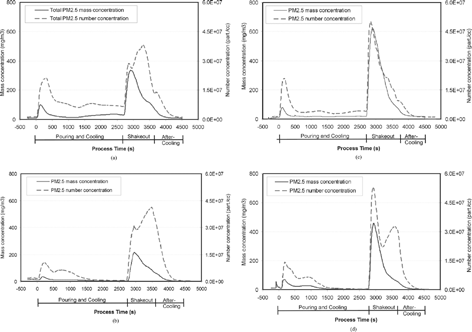
High variations were observed among the tests, especially during shakeout. In Runs 3 and 4, the highest stack temperatures during the shakeout period were around 200°C, much lower than those in Runs 5 and 6 (> 300°C). Peak PM2.5 mass concentrations (when shakeout started) in Runs 5 and 6 were twice of those in Runs 3 and 4. Since measurements of stack conditions were not affected by the dilution method, the variation of the PM2.5 mass emission rate is probably due to variations in the casting process, not the dilution air ratio applied. Dual peaks of THC and PM2.5 number concentrations during shakeout were observed in Runs 3, 4, and 6 (panels a, b, and d of and ). Between the two peaks, lower THC concentrations at 2,720–2,760 seconds (immediately after shakeout starts) correspond to increasing PM2.5 number concentrations. When the THC concentration in the second peak was relatively similar to the first peak, the second peak of PM2.5 number concentration was lower. In Run 4, a small increase in PM2.5 number concentration was observed after pouring, during which a lazy flame (flame with slow undulating movements approximately following the velocity of surrounding air) was observed over the mold.
PM2.5 Particle Size Distribution Measured by EPLI
The average mass fractions of nine size ranges over each 4,500 second test are shown in . More than 90% of PM2.5 mass is in the range of 0.3–2.5 μm, and ultrafine particles (particles less than 0.1 μm in diameter) from the last 3 impactor stages comprise less than 1% of the mass. The mass fraction of ultrafine particles in PM2.5 is usually small when primary particles from emission sources—such as a foundry, coal power plant, or steel mill—are dominated by solid particles. However, PM2.5 particle number concentrations are dominated by ultrafine particles due to their formation through nucleation of condensable species, condensational growth, and rapid coagulation. Particle number concentrations are more sensitive to the process variability then mass concentrations.
TABLE 4 Average PM2.5 mass fraction determined by Electrical Low-Pressure Impactor (ELPI)
The evolution of mass and number distributions is shown in and for Runs 3–6. Particle size distributions are shown as:
Figure 5 Distribution of calculated in-stack particle mass concentrations (mg/cm3/μm) for: (a) Run 3, (b) Run 4, (c) Run 5, and (d) Run 6.
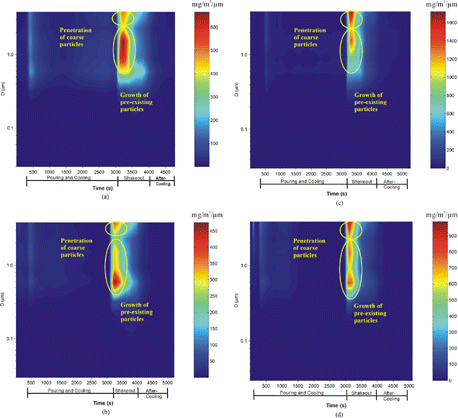
Figure 6 Distribution of calculated in-stack particle number concentrations (particles/cc/m) for: (a) Run 3, (b) Run 4, (c) Run 5, and (d) Run 6.
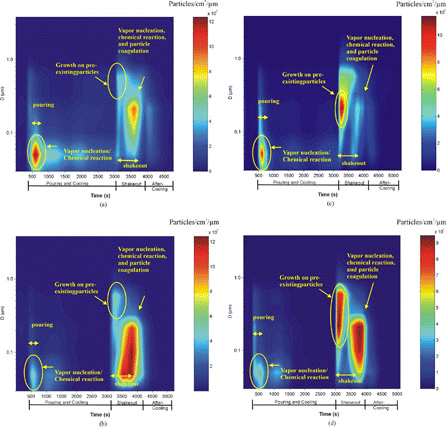
As shown in and , the mode of PM2.5 mass distributions for pouring is approximately 0.6–0.7μm. When the shakeout process starts, particle mass concentrations () show a bimodal distribution. The larger mode (> 1.6 μm) represents the tail of the coarse particle mode that penetrate the cyclone (2.5 μm cutpoint), shown in ; the 0.65–1.6 μm mode is probably due to formation formed by condensation of gases onto pre-existing solid particles, as well as coagulation of small particles. Three PM2.5 particle number concentration modes appear in : (1) a 30–60 nm mode during pouring; (2) a 170–650 nm mode in the first peak of shakeout; and (3) a 30–260 nm mode in the second peak of the shakeout. The high PM2.5 number concentration observed in the size range of 110–260 nm was mostly due to the condensation of vapor species and coagulation. The size of the number mode depends on the concentration of vapor species available for condensation and coagulation.
PM2.5 Emission Mechanisms in the Casting Process
PM emissions depend on thermal processes and on the materials used for casting process. Different PM emission characteristics observed in the pouring and shakeout processes were examined. It is hypothesized that as cast iron is poured into the mold, the heat transfers from the hot material (−1,500°C) to the cold mold (ambient temperature of 21°C), resulting in chemical reactions, vaporization, thermal decomposition, and the combustion of some organic compounds in the binder. The thermal decomposition and combustion occur where the metal and mold are in contact. Only limited organic and metal vapors are released as PM sources. During cooling, the heat transfer process slowly reaches a balance among the metal, the mold, and the air velocity around the mold. The vaporization and thermal decomposition of the binder continue steadily, as indicated by the THC level, but most of the organic vapors are trapped within the mold. Some flame combustion might occur on the surface of the mold.
As shakeout starts, the mold mechanically breaks down, releasing heat and trapped organic vapors. Larger sand particles suspended and smaller organic particles formed through chemical reactions and condensation. Therefore, two modes in the mass concentration are observed: (1) the end of a tail of coarse particles (> 1.6 m); and (2) the accumulation mode of ∼ 0.65–1.6 μm.
Concurrently, the released heat raises the temperature and the organic material is available for combustion. Depending on the flame condition, the organic material is consumed or combusted to carbon dioxide (CO2), CO, and some secondary organic compounds. Depending on the vapor pressure, part of the secondary organic compounds form particles through nucleation or condensation on existing small particles, so that a less than 0.3 μm mode of PM2.5 particle number concentration is observed along with residual organic vapors (measured as THC). To conserve available organic materials released in this process, the THC concentration increases as PM2.5 number concentration decreases and vice versa.
CONCLUSION
Particulate emissions from casting processes were characterized in a Research Foundry at Technikon, LLC (McClellan, CA). The goal was to characterize air pollutant emissions and optimize the operating parameters of a source dilution sampling system for foundry gray iron casting processes. Five tests were conducted from February 25–27, 2004, including one test for pouring only and four tests that consisted of pouring-cooling, shakeout and after-cooling. A dilution air ratio of 60 or higher was found to optimize PM2.5 mass loading on the filter sampling media. The most abundant PM2.5 chemical species were carbonaceous aerosol (OC and EC), iron (Fe), and manganese (Mn). PM2.5 emission factors and speciation profiles obtained in these tests were intended to establish a baseline for emission measurements for the particular binder and casting materials studied and are not intended for PM2.5 emission inventory estimation from full-scale foundries. High variability of air pollutant emissions was observed among the tests. PM2.5 mass emissions in the pouring process alone constituted 15–26% of the total. The mass fraction of ultrafine particles in PM2.5 was negligible. Concentrations of PM2.5 mass, CO, THC, and stack temperature increased when the pouring and shakeout processes commenced. For the PM2.5 number concentration, a second peak was observed during the shakeout process. The two mass modes observed during shakeout result from the solid sand particles in the mold residing in the larger size fraction (> 1.6 μm), and particles ranging in size from 0.65–1.6 μm formed through chemical reactions, and condensation of vapor species. PM2.5 emissions in the casting process depend on flame conditions, vaporization, and thermo-decomposition of organic material. The variability of mold breakup during shakeout can greatly affect quantity of PM2.5 emissions.
Future work should include characterizing emissions in full scale foundry facilities to validate the applicability of measuring PM mass and chemical compositions via the dilution sampling method. Knowledge of the relationships between the casting process and emissions could lead to more efficient manufacturing and lower emissions.
Acknowledgments
This work is supported by the Casting Emission Reduction Program (CERP), the American Foundry Society (AFS), the Casting Industry Supplier Association (CISA), the U.S. Environmental Protection Agency (EPA), the California Air Resources Board (ARB), and the U.S. Army (contract DAAE30-02-C-1095). The authors thank Steve Kohl and Dana Trimble of Desert Research Institute (DRI) for lab analysis and Jo Gerrard and Eric Dieterle of DRI for assembling and editing the manuscript.
Notes
*STP = 293.15 K and 760 mm Hg
**The fraction is the PM2.5 mass emitted from pouring of 900 seconds to each mold of 4,500 seconds by integrating ELPI concentration in each sub-process.
Related Research Data
REFERENCES
- Chan , T. and Lippman , M. 1977 . Particle Collection Efficiencies of Sampling Cyclones: An Empirical Theory . Environ. Sci. Technol. , 11 ( 4 ) : 377 – 386 . [CSA]
- Chang , M.-C. O. , Chow , J. C. , Watson , J. G. , Hopke , P. K. , Yi , S.-M. and England , G. C. 2004 . Measurement of Ultrafine Particle Size Distributions from Coal, Oil, and Gas-Fired Stationary Combustion Sources . J. Air & Waste Manage. Assoc. , 54 : 1494 – 1501 . [CSA]
- Chang , M.-C. O. and England , G. C. 2005 . Development of Fine Particulate Emission Factors and Speciation Profiles for Oil and Gas-Fired Combustion Systems, Update of Literature Review of Source Sampling and Analysis Methodologies for Characterizing Organic Aerosol and Fine Particulate Source Emission Profiles [online]. , Available (http://www.nyserda.org/programs/environment/emepreports.asp)[CSA]
- Chow , J. C. , Watson , J. G. , Pritchett , L. C. , Pierson , W. R. , Frazier , C. A. and Purcell , R. G. 1993 . The DRI Thermal/Optical Reflectance Carbon Analysis System: Description, Evaluation and Applications in U.S. Air Quality Studies . Atmos. Environ. , 27A ( 8 ) : 1185 – 1201 . [CSA]
- Chow , J. C. and Watson , J. G. 1999 . “ Ion chromatography in elemental analysis of airborne particles ” . In Elemental Analysis of Airborne Particles , Edited by: Landsberger , S. and Creatchman , M. Vol. 1 , pp. 97 – 137 . Amsterdam : Gordon and Breach Science .
- Chow , J. C. , Watson , J. G. , Kuhns , H. D. , Etyemezian , V. , Lowenthal , D. H. , Crow , D. J. , Kohl , S. D. , Engelbrecht , J. P. and Green , M. C. 2004 . Source Profiles for Industrial, Mobile, and Area Sources in the Big Bend Regional Aerosol Visibility and Observational (BRAVO) Study . Chemosphere , 54 ( 2 ) : 185 – 208 . [PUBMED] [INFOTRIEVE] [CROSSREF] [CSA]
- Corio , L. A. and Sherwell , J. 2000 . In-Stack Condensable Particulate Matter Measurements and Issues . J. Air & Waste Mange. Assoc. , 50 : 207 – 218 . [CSA]
- Hildemann , L. M. , Gass , G. R. and Markowski , G. R. 1989 . A Dilution Stack Sampler for Collection of Organic Aerosol Emissions: Design, Characterization and Field Tests . Aerosol Sci. & Technol , 10 : 193 – 204 . [CSA]
- Holder , T. E. , Goshaw , D. G. and Richards , J. R. 2001 . Artifact Formation in Method 202 Sampling Trains Used to Measure Condensable Particulate Matter Emissions from Portland Cement Kilns . Proceeding in Air & Waste Management Association 94th Annual Meeting and Exhibition . June 24–28 2001 , Orlando, FL.
- Houck , I. E. , Cooper , J. A. and Larson , E. R. Dilution Sampling for Chemical Receptor Source Fingerprinting, Paper No. 82-61. Presented at 75th Annual Meeting of the Air Pollution Control Association . June 1982 , New Orleans, LA.
- International Standard ISO 8178-1 . 1996 . Reciprocating internal combustion engines-Exhaust emission measurement-Part 1: Test-bed measurement of gaseous and particulate exhaust emissions. , [CSA]
- International Standard ISO 8178-1 . 1996 . Reciprocating internal combustion engines-Exhaust emission measurement-Part 2: Measurement of gaseous and particulate exhaust emissions at site. , [CSA]
- McCain , J. D. and Williamson , A. D. 1984 . Development and Evaluation of Dilution Probes Used for Sampling to Determine Source Signatures, EPA 600/S3-84-045. , Research Triangle Park, NC : U.S. Environmental Protection Agency .
- Merrill , R. G. and Harris , D. B. 1987 . Field and Laboratory Evaluation of a Woodstove Dilution Sampling System . 80th Annual Meeting of the Air Pollution Control Association . 1987 , New York.
- Technikon, LLC . 2003 . The Effect of Mold Surface Air Velocity on No-Bake PCS Emissions. , Technikon Report #1410-151 FM made to the U.S. Army in Casting Emission Reduction[CSA]
- Sheya , S. A. , Chang , M.-C. O. , Glowacki , C. , Prabhu , A. , Watson , J. G. and Chow , J. C. 2006 . Proceeding of Symposium on Air Quality Measurement Methods and Technology, Air and Waste Management Association, Paper 18 . 2006 , Durham, NC.
- U.S. EPA . 1991 . 55 Federal Register , Part 65433. Condensible particulate emissions from stationary sources[CSA]
- U.S. EPA . 2004 . 40 CFR Part 63: National emission standards for hazardous air pollutants for iron and steel foundries; Final rule; Federal register/ Vol. 60, No. 78. Thursday, April 23rd, 2004. Rule and regulation; 21906–21940[CSA]
- 2004 . July U.S. EPA Conditional Test Method (CTM 039) Measurement of PM2.5 and PMIO emissions by dilution sampling (constant sampling rate procedures)[CSA]
- 2005 . February 25 U.S. EPA Conditional Test Method (CTM 040) Method for Determination of PMIO and PM2.5 Emissions (Constant Sampling Rate)[CSA]
- Watson , J. G. , Chow , J. C. and Frazier , C. A. 1999 . “ X-ray Fluorescence Analysis of Ambient Air Samples ” . In Elemental Analysis of Airborne Particles , Edited by: Landsberger , S. and Creatchman , M. Vol. 1 , pp. 67 – 96 . Amsterdam : Gordon and Breach Science .
- Watson , J. G. 2002 . Visibility: Science and Regulation . J. Air & Waste Manage. Assoc. , 52 : 628 – 713 . [CSA]
- Wien , S. , England , G. C. , Loos , K. , Ritter , K. , Gurney , D. , McCarthy , J. , Liebowitz , B. , Joseph , J. and Franco , G. 2001 . PM2.5 Speciation Profiles and Emission Factors From Petroleum Industry Gas-Fired Sources . Proceedings International Emission Inventory Conference, “One atmosphere, One inventory, Many challenges.” . May 1–3 2001 , Denver, CO.