A real-time instrument employing photoelectric emission has been suggested as a semiquantitative tracer of black carbon (BC). The instrument is known as the Photoelectric Aerosol Sensor (PAS) and has been manufactured in Europe since the 1980s. As a test of this relationship, real-time measurements were made using two models of this instrument side by side with two Aethalometers for one year (1998) and for an additional six months (December 1999–May 2000) inside and outside an occupied house in Reston, VA. Four sources, two outdoors and two indoors, were investigated. The outdoor sources included automobile traffic and woodburning; the indoor sources included cooking and candle burning. Correlations between the Aethalometer and both models of PAS instruments for three of the four sources ranged from R2 = 72% to 85%. For cooking, the earlier PAS Model 1001i using mercury vapor as a UV source was correlated with the Aethalometer for broiled foods, but the later PAS Model 2000 using a krypton chloride excimer lamp showed almost no response. When all sources were combined, both the outdoor PAS 2000 and the indoor PAS 1001i correlated with the corresponding Aethalometers (R2 = 63%, N = 36,558, p < 0.0001; and R2 = 68%, N = 34,954, p < 0.0001, respectively). Although the precision of the Aethalometer and PAS 2000 was high (4.5% and 5.4%, respectively), and correlations between them fairly good for some sources, the accuracy of both instruments is essentially unknown, due in part to the lack of a standard capable of providing calibrations in the field. There is also an unexplained difference of about a factor of 10 between the PAS 1001i and PAS 2000 models used in this study. The PAS/Aethalometer ratio varies widely across studies, suggesting that both instruments have site-specific and/or source-specific responses. Nonetheless, for certain uses, such as identifying sources, determining indoor-outdoor relationships, mapping diurnal variation, identifying peaks, and measuring personal exposures, the PAS has important advantages.
INTRODUCTION
Elemental carbon (EC), or soot, is produced by incomplete combustion. Some measurement techniques employ only optical absorption, in which case they are said to measure black carbon (BC) rather than EC. BC and EC are not identical, but are highly correlated. EC is of interest as a marker of combustion sources such as diesel vehicles, woodsmoke, and cigarettes (CitationBurtscher 2005; CitationCyrys et al. 2003; CitationFromme et al. 1998; CitationPutaud et al. 2004) and as a possible major contributor (from diesel combustion, forest fires, and even biomass cooking) to climate change via its cooling or heating effects on the atmosphere (CitationVenkatamaran et al. 2005). EC, as a major byproduct of diesels, has also been studied for its possible carcinogenic effect in worker populations, although the results are equivocal due to lack of specific exposure measurements (CitationHEI 1999).
Measurement methods often depend on time-integrated collection on filters followed by laboratory procedures such as the thermo-optical method of determining EC and organic carbon (OC) composition of particles. A desirable complement to these integrated methods would be continuous or semicontinuous instruments capable of identifying diurnal variation, peak levels, and other short-term effects. One semicontinuous instrument for BC, the Aethalometer, was developed in the 1980s. The Aethalometer employs a quartz fiber filter tape to collect the aerosol, which is then illuminated by visible light and the absorption calculated. It has been used in a number of environmental studies in the past two decades (CitationHansen and McMurry 1990; CitationKittelson et al. 2002, Citation2005; CitationLaRosa, Buckley, and Wallace 2002; CitationMaciejczyk et al. 2004; CitationRuellan and Cachier 2001; CitationWatson and Chow 2001; CitationWeingartner et al. 1997, Citation2003).
A continuous instrument, the Photoelectric Aerosol Sensor (PAS), was also developed in the 1980s (CitationBurtscher, Scherrer, and Siegmann 1982). The PAS employs UV light to eject electrons from organic material on the surface of aerosols. Early studies of the PAS emphasized its response to particle-bound polyaromatic hydrocarbons (pPAH) (CitationBurtscher and Schmidt-Ott 1986), but later investigators have also championed its use as an indicator of EC (CitationBukowiecki et al. 2002; CitationBurtscher 2005; Dahmann et al. 2002; CitationMatter, Siegmann, and Burtscher 1999; CitationPrszybilla 2002), particularly in the case of diesel engine emissions in the workplace. Since EC is now regulated in some European workplaces, a real-time instrument is of interest for workplace use. A personal instrument to measure real-time EC or BC exposure at environmental levels would also be very desirable. (The Aethalometer is portable, but not personal, whereas one CitationPAS model—Model 2000ce—is easily carried or worn by an individual.)
Both the Aethalometer and the PAS provide real-time measurements on the level of seconds (for the PAS) or minutes (for the Aethalometer) and are therefore highly desirable for detecting short-term peaks in concentrations and tracking sources, such as following a diesel truck on the roadway (CitationFruin, Winer, and Rodes 2004). Such abilities are not possible for the extended sampling times required for the integrated methods.
Both the Aethalometer and the PAS appear to be site- and source-specific. For example, the range of observed coefficients relating the Aethalometer signal to BC mass spans an order of magnitude, varying between rural and urban locations (CitationAllen, Lawrence, and Koutrakis 1999; CitationBabich et al. 2000; Dahmann et al. 2002; CitationHitzenberger et al. 1999; CitationJeong et al. 2004; CitationLavanchy et al. 1999; CitationPetzold, Kopp, and Niessner 1997; CitationPetzold and Niessner 1995; CitationTen Brink et al. 2004; CitationWeingartner et al. 2003). Other studies have noted a dependence of the response on the loading of the quartz fiber tape (CitationLaRosa, Buckley, and Wallace 2002; CitationWeingartner et al. 2003). Because multiple scattering occurs from the unloaded quartz fiber filter tape itself and also from the increasing aerosol loading on the tape, it is difficult to arrive at a dependable ratio between the absorption factor and the BC mass (CitationArnott et al. 2005).
For the PAS, similar large variations have been noted in its signal compared to concurrent mass-based or optical determinations of EC or BC (Dahmann et al. 2002; CitationHüglin et al. 1997; CitationJunker et al. 2000; CitationMarr et al. 2004; CitationSaathoff et al. 2003; CitationWeingartner et al. 1995).
Although these source-specific variations for both instruments are disturbing, in view of the undoubted utility of both instruments in providing real-time data, it seems useful to continue gathering data on their response to different aerosol mixtures and different sources.
Therefore this analysis of data collected by matched Aethalometers and two types of PAS instruments has been undertaken. The data were collected as part of a larger 5-year study of exposure to ultrafine and fine particles in an occupied house. The study has been fully described in a series of papers dealing with air exchange, particle concentrations, deposition, and source emissions (LaRosa, Buckley, and Wallace 2000; CitationHoward-Reed, Wallace, and Emmerich 2003; CitationHoward-Reed, Wallace, and Ott 2002; CitationWallace 2000, Citation2005; CitationWallace and Howard-Reed 2002; CitationWallace, Emmerich, and Howard-Reed 2004a, Citationb; Wallace, Howard-Reed, and Emmerich 2002). However, this is the first paper in the series to consider PAS measurements in relation to Aethalometer measurements.
METHODS
The Aethalometer (Magee Scientific, Berkeley, California) shines white light from an incandescent lamp at a quartz fiber tape at user-selected intervals and determines the change in transmittance from the previous measurement. A reference tape in a cell isolated from ambient air is used to provide a baseline transmitted intensity for comparison. When the absorption reaches a pre-set level near saturation, the tape advances automatically and a new series of measurements begins. The output of the instrument provides the optical depth together with the calculated mass concentration of BC over the time since the last measurement. The mass concentration is calculated by the difference in the optical depth since the last measurement, using a calibration factor for the attenuation of light intensity (ATN) determined in previous studies. The manufacturer-recommended ATN factor of 19 m2/g (based on measurements in ambient air) was employed, together with a modification to account for increased loading on the tape (based on optical depth) developed in a previous study using the same instruments (CitationLaRosa, Buckley, and Wallace 2002). The detection limit of the instrument is 1.2 ng. At the flow rate and sampling time used, this corresponds to about 0.1 μg/m3 BC. All measurements exceeded this value.
The PAS shines ultraviolet light emitted by excited gas molecules at an aerosol mixture on a user-selected time interval. Depending on the emitting gas employed in a particular instrument model, the photons may have energies between 5.6 eV (krypton chloride) and 6.7 eV (mercury vapor). Compounds on the surface of the particles with ionization potentials below the incident energy may release an electron. If the electron escapes the particle without being reabsorbed, it is removed via an ion trap and the positively charged aerosol is collected on a filter connected to ground, thus creating a continuous electric current proportional to the number of ions reaching the filter per time unit. Particles larger than about 1 μm tend to reabsorb the electron, so only smaller particles contribute to the signal. However, most particles produced by combustion are smaller than 1 μm. Particle-bound PAH (PPAH) on the surface of the particle have ionization potentials generally below these energies and so contribute to the signal. CitationSaathoff et al. (2003) reported that the work function of graphite (BC) is only 4.4 eV, well below the energy per photon of any PAS instrument; therefore all PAS instruments should respond to pure BC as well as to the associated pPAH. However, other ionizable compounds can also contribute to the signal, raising the possibility of interferences. Such interferences have been observed in several studies (CitationChilders et al. 2000; CitationTang et al. 2000; CitationChetwittayachan, Shimazaki, and Yamamoto 2002; CitationHüglin et al. 1997). Therefore users of the PAS have generally warned that it needs to be calibrated using the aerosol mixture being studied before the signal can be said to be indicative of the mass concentration of pPAH. This stricture would also apply when the PAS is used as an indicator of BC.
Two types of PAS instruments were used throughout the study. PAS Model 1001i (US distributor: Ecochem Analytic, West Hills, CA) uses a mercury vapor line at 185 nm wavelength (6.7 eV). Only one 1001i instrument was available; it sampled indoor air the entire time. Two PAS Model 2000 instruments (Ecochem Analytic, West Hills, CA), were employed for simultaneous indoor-outdoor measurements. The PAS 2000 uses an excimer lamp filled with krypton chloride gas. The KrCl gas has a single line at 220 nm (5.6 eV). The excimer lamp flashes on and off, with the “off” period providing a moving reference point to allow for electronic drift. The time intervals chosen were 4 seconds on, 4 seconds off. The integrating interval chosen was one minute; results were aggregated to the 5-minute level for comparison with the Aethalometers. The PAS 1000i instrument was calibrated by the manufacturer with the suggestion that 1 fA of current corresponded to 3 ng/m3 PPAH, based on studies in a roadway tunnel in Switzerland. Two tests of the PAS 1001i on ambient air led to different results: 1 fA = 3 ng/m3 and 1 fA = 9 ng/m3 (CitationChuang and Ramamurthi 1997). The detection limit of the PAS 2000 is said by the manufacturer to be 10 fA. However, other investigators cite a limit of detection in the neighborhood of 1 fA (CitationSiegmann and Siegmann 1998). Almost all measurements exceeded 1 fA, but many fell below 10 fA.
The PAS 2000 instruments were calibrated by the manufacturer, with the suggestion that 1 fA = 1 ng/m3 pPAH nominally. However, it was at once noticed that both PAS 2000 instruments read lower than the PAS 1000 instrument by a factor close to 10, no matter what source was being studied. This observation was corroborated by other users of the PAS 2000 (W. R. Ott, N. K. Wilson, personal communication). Discussions with the American distributor did not discover the reason for this effect. A large-scale comparison of three PAS instruments manufactured in Europe did not show this effect (Dahmann et al. 2002). In the following figures, to show the two PAS instruments at comparable levels, the readings of the PAS 2000 instruments are multiplied by 10.
The instruments were operated for the entire year of 1998. From January 1 to May 14, all instruments were deployed indoors, in a recreation room and utility room in the basement. After that, one Aethalometer and one PAS 2000 were placed outside on a balcony facing a wooded area one floor above ground level. The other Aethalometer and PAS 2000, together with the PAS 2005, were operated indoors in various rooms of the house.
A second 6-month monitoring period took place from December 1999 through May 2000. One Aethalometer and one PAS 2000 were placed on the balcony. The other Aethalometer and a second PAS 2000 instrument were placed indoors in the basement (ground level) one floor below the balcony. A third PAS instrument, a PAS 1001i series, was placed in an upstairs office, one floor above the balcony. Measurements were taken every minute (PAS) or every 5 minutes (Aethalometer).
Previous studies have calculated the PAS/EC ratio for diesel sources and automotive traffic (Dahmann et al. 2002; CitationMarr et al. 2004; CitationJunker et al. 2000; CitationSaathoff et al. 2003) and for woodburning (CitationHüglin et al. 1997). The traffic and woodburning sources are also included in this study, and two indoor sources—candles and cooking—are added.
Data Analysis Approach
Woodburning
Since most woodburning in Reston occurs on cold winter weekend nights, the period from 8 PM to 5 AM on Friday–Sunday nights (and Monday morning) from December 22, 1999 through February 27, 2000 was chosen for study. Days with woodburning were marked by a buildup in the period between 8 PM and midnight followed by a decay lasting sometimes until 5 AM. The data were combined and analyzed for correlations, regression of the PAS signal on the Aethalometer measurement, and summary statistics.
Automotive Traffic
A clear signal corresponding to the morning rush hour could be seen on most weekdays. Therefore all weekdays between January 1 and May 31, 2000 were included in the analysis. The hours from 6 AM to 9 AM were selected as the rush hour period.
Citronella Candle
A Citronella candle was tested indoors. Although these candles are not designed to be burned indoors, the instructions state that the person must remain within 3 feet (1 m) of the candle to obtain desired results. Such a close distance outdoors coupled with expected lengthy exposure times may lead to exposures not dissimilar to those seen in the 400 cubic meter house where the candle was burned, particularly since the candle was normally burned for a very short period (1–3 minutes) in the basement. Besides the PAS/Aethalometer ratio, another statistic of interest was the decay rate of each component.
Cooking
The second indoor source investigated was cooking. Frying and broiling episodes (considered more likely to produce BC and PAH) were studied separately, and all other cooking types such as boiling were lumped into one category.
RESULTS
Quality Control
The two Aethalometers were run side by side indoors for 14 consecutive days, from Dec. 27, 1999 to Jan. 10, 2000. Although the average values were similar—405.5 ng/m3 (8.3 ng/m3 standard error, or SE) vs. 428.1 ng/m3 (8.9 ng/m3 SE), the precision, defined as Abs(A − B)/(A + B), averaged only 9.9% (6.5% standard deviation, or SD, N = 4020). However, without fail, the monitor with the lower loading on the quartz fiber tape read higher than the other monitor. A “jump” in the readings (often from 30–50%) could be noted each time the tape advanced and presented a fresh (unloaded) portion to the incident light source. By assuming an exponential dependence on optical depth, the problem presented by the “jump" was reduced, and the average precision of the monitors was substantially improved, from 9.9% to 4.5% (5.2% SD). The correction factor is described fully in LaRosa, Buckley, and CitationWallace (2002). This correction factor was then applied to all Aethalometer readings. This dependence of the signal on the loading of the quartz fiber tape has been noticed by other investigators, and different correction factors have been developed (CitationArnott et al. 2005).
The PAS 1001i and 2000 instruments were also run side by side for two days. For the two PAS 2000 instruments, the R2 agreement was 99.8% (N = 275) on the first day and 98.3% (N = 278) on the second, with slopes of 1.03 and 1.01, respectively, and intercepts not significantly different from zero. The average precision was 5.4% (5.6% SD, N = 553). Because of the order of magnitude difference between the 1001i and the 2000 instruments, their relative precision (including the bias) was very poor; on the other hand, the instruments correlated very well (R2 > 95%).
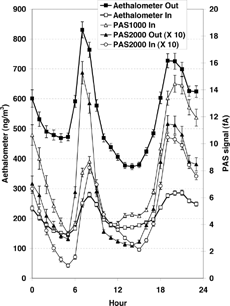
Approximately 150,000 5-minute measurements were made with each Aethalometer during the 18-month study period. Due to repairs or occasional loans to other investigators, the PAS instruments recorded between 90,000 and 115,000 5-minute averages, based on 5 times that many 1-minute measurements. An example of the diurnal behavior of the instruments is provided in for the winter quarter of 2000 (January through March). The influence of morning traffic, and a combination of evening traffic and woodburning, is apparent. The outdoor peaks occur at 7 AM and 7 PM, about an hour earlier than the indoor peaks.
FIG. 1 Diurnal variation of PAS and Aethalometer readings (January-March 2000). Relative standard errors (not shown) ranged from 2–4% for the Aethalometers and 3–11% for the PAS instruments (N = 15,523 5-minute averages).
Spearman correlations were calculated for various pairs of instruments (). For two Aethalometers and two PAS 2000 instruments in different rooms of the house, the Spearman correlation coefficients were quite high at 0.91 and 0.81, respectively. Cross- correlations between the PAS 2000 and Aethalometers in the same room were 0.69 and 0.77. Correlations in the spring and summer seasons, when the PAS values were lower, were rather low, but they improved again in the fall season, when woodburning resumed.
TABLE 1 Spearman correlations between instruments
Woodburning
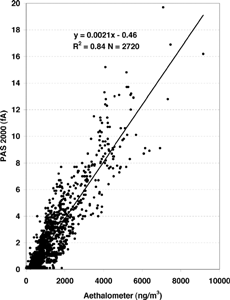
In the winter months in Reston, a number of persons burn wood in their fireplaces. The community where the house is located includes 80 townhouses, about 20 of which have fireplaces. On cold Friday, Saturday, and Sunday evenings the smell of woodsmoke is noticeable outdoors and occasionally indoors as well. Between December 22, 1999 and February 27, 2000, a total of 20 weekend days showed distinct increases in outdoor Aethalometer and PAS readings in the late evening hours, sometimes extending to the small hours of the morning. A particularly intense woodburning period takes place in the days leading up to Christmas (). At times, the agreement between the Aethalometer and PAS signal was impressive (). However, also shows that the ratio between the two can change with time, perhaps due to coagulation and condensation as the aerosol mixture ages. Overall, agreement between the Aethalometer and PAS signals during the period likely to be impacted by woodburning is good. For the 2720 measurements taken between January 1, 2000 and February 27, 2000, the R2 value was 84% ().
FIG. 2 PAS (top) and Aethalometer (bottom) around Christmas 1999, and (bottom).
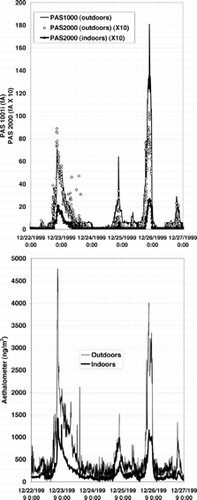
FIG. 3 Woodburning on the night of January 29, 2000 as detected by the outdoor Aethalometer and PAS 2000 instrument.
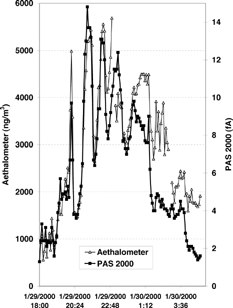
FIG. 4 Comparison of PAS signal to Aethalometer values for the “woodburning” periods (8 PM to 4 AM on Friday, Saturday, and Sunday evenings) between December 22, 1999 and February 27, 2000.
Automotive Traffic
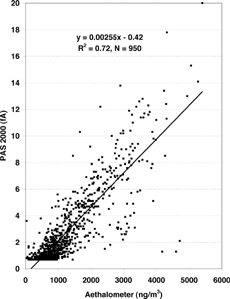
As with woodburning, automotive traffic presented a clear signal for both the PAS and Aethalometer in the rush hour period between 6 AM and 9 AM (). The traffic signal could be seen both outdoors and indoors. Note the time delay in the indoor response. Overall, agreement between the outdoor Aethalometer and PAS 2000 instruments during the rush hour was fair, with an R2 value of 72% (N = 950) ().
FIG. 5 Outdoor and indoor Aethalometer and PAS readings during morning rush hour on February 7, 2000.
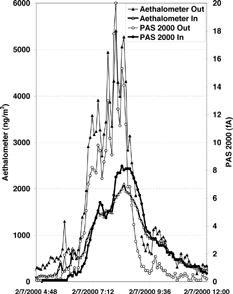
FIG. 6 Comparison of the outdoor PAS 2000 with the Aethalometer for the period January–February, 2000, during the 6–9 AM rush hour on weekdays.
Citronella Candle
The Citronella candle was a powerful source. About 15 experiments were done with the same (large) candle. As a controllable indoor source, it allowed for a more precise single-source comparison of the Aethalometer and PAS responses. At times, slight differences in the decay rate of the Aethalometer and PAS signals were noted (). The Citronella candle tests showed good correlations between the indoor Aethalometer and both indoor PAS instruments: R2 = 85% for the PAS 1000 (N = 540), 77% for the PAS 2000 (N = 485). The slope of the PAS 1000 vs. the Aethalometer was 0.029 fA/(ng/m3); for the PAS 2000, the slope was 0.0019 fA/(ng/m3).
FIG. 7 Decay rates of indoor Aethalometer and PAS readings after a 1-minute burn of a Citronella candle in the basement utility room.
Cooking
A common meal consisted of a baked potato and broiled salmon. During measurements of multiple such meals, the PAS 1000 series showed an increase in its signal that was reasonably well correlated to the increase in the Aethalometer reading (R2 of 80%, N = 231 5-minute averages), but the PAS 2000 series showed no effect (R2 of about 1%). This result has been discussed with the manufacturers with no resolution. Similar results were observed by other investigators in cooking-related experiments (M. Kaspar, personal communication). Since BC as measured by the Aethalometer shows a cooking-related increase, it seems likely that the well-correlated PAS 1000 response is more trustworthy here than the uncorrelated PAS 2000. Types of cooking other than broiling or frying resulted in no response from either instrument.
Summary
The average concentrations during the times that the four sources were active are compared to the baseline indoor and outdoor concentrations at all other times (). The concentrations with the sources active were typically 2–3 times those when the sources were not active, with the exception of the Citronella candle, which produced indoor concentrations about 40–80 times larger than background.
TABLE 2 Comparison of concentrations with and without four sources active
Finally, the PAS instruments were regressed against the Aethalometers without regard to sources. Moderate strength was shown for both the Model 1001i indoor instrument versus the indoor Aethalometer (R2 = 68%, N = 34,954, p < 0.0001, slope = 14 fA/μg/m3), and the Model 2000 outdoor instrument vs. the outdoor Aethalometer (R2 = 63%, N = 36,558, p < 0.0001, slope = 1.8 fA/ μg/m3).
DISCUSSION
Both the Aethalometer and the PAS have well-known documented problems limiting their utility. For both, there is no way to calibrate them in the field against the aerosol being measured. Very recently, the first standard for BC has been developed by the National Institute of Standards and Technology (NIST), using urban aerosol collected in Washington, DC in 1976–1977 (CitationKlouda et al. 2005). Perhaps this standard will ultimately allow field calibration for these or other instruments for measuring BC.
For the PAS, an additional problem is its sensitivity to polyaromatic hydrocarbons (PAH). For many years, the instrument was said to measure particle-bound PAH almost exclusively. A number of efforts were made to determine its response factor to PAH with widely varying results. With the more recent emphasis on its response to BC, it is now possible to see that the instrument cannot be said to be specific to any single chemical element or group of compounds. Because most combustion processes produce both BC and PAH, but in different ratios, the PAS will nearly always respond to combustion aerosols but with different response factors to different aerosol mixtures. The collinearity of PAH and BC ensures that the PAS will show moderate-to-good correlations with both, but seldom will show very high correlations with either.
The disadvantages of these instruments are offset by some real advantages. Their continuous or semicontinuous abilities allow observation of short-term peaks, diurnal variations, association of peaks with sources by using instantaneous wind direction, separation of sources (such as rush-hour traffic and woodsmoke) that occur at different times in one 24-hour period, and other useful abilities. In the case of the personal version of the PAS, additional capabilities include real-time identification of high-emitting diesels in traffic and direct measurement of personal exposures in different microenvironments throughout the day. Additionally, both instruments are very precise, with precision on the order of 4.5–5.4% and R2 values consistently in the 98–99% region. This means, for example, that indoor-outdoor comparisons using the same model instrument can be trusted to quantitatively describe indoor-outdoor ratios, time dependence of indoor concentrations on outdoor variation, and other factors even though the absolute BC concentration cannot be determined.
PAS Calibration
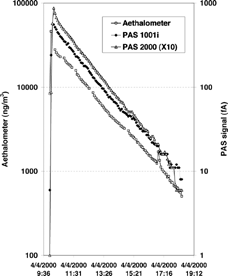
For three of our four sources, the PAS instruments appeared moderately correlated with each other and also with the Aethalometer, with R2 values ranging from 72–85%. On an absolute scale, however, the PAS 2000 instruments read lower (by about a factor of 10) than the PAS 1001i instrument. (As mentioned above, other investigators using the instruments supplied by the American distributor have noted the same factor of 10 difference.) However, an important 3-year study found good agreement between the two PAS instruments when measuring emissions from diesel engines or tunnel traffic (Dahmann et al. 2002). The difference between the European instruments and those distributed in the US remains unexplained. It cannot be due to the different types of lamp (continuous vs. excimer) or the different exciting gas (Hg vs. KrCl) because those features are common to both the European and American instruments.
PAS as a Measure of EC in Other Studies
A 3-year study of diesel engines in a workplace (Dahmann et al. 2002), as well as mixed vehicles in a tunnel, indicated that a moderate relationship, with typical R2 values on the order of 60–80%, between the PAS output and EC as measured by a number of devices (including the Aethalometer) could be obtained in most cases for all PAS instruments tested, including the Hg and KrCl instruments used in this study. Because of the importance of this long-term detailed study, we present the results and compare them to our own results in . It can be seen that the relationships varied over a factor of about 3 in the Dahmann study within each monitor, but that the average PAS/EC ratio was very similar (between 8 and 10 fA/μg/m3 EC) for all three monitors tested. In fact, the variation within the two KrCl instruments was greater than the variation between all three types of instruments. However, the subsequent studies in the table show more variability for the response of the PAS to EC.
TABLE 3 Relationships between PAS and EC (or BC) measurements in previous studies (fA/μg/m3)
One study in Mexico City of loading docks and automotive traffic found a PAS 2000/EC ratio to vary from 7 to 70 fA/μg/m3 BC (CitationMarr et al. 2004). A tunnel study of emission factors by CitationWeingartner et al. (1995) employing both an Aethalometer and a PAS instrument found a PPAH/BC value of 27 ng/m3/μg/m3, which, assuming the normal calibration of 1 fA per ng/m3, would be equivalent to a value of 27 fA/μg/m3 BC. Also shown in are results from CitationJunker et al. (2000) and CitationSaathoff et al. (2003). Although Junker's results concerned the KrBr instrument, not used in our study, it is interesting to see the variation with Dahmann's results for the same instrument. (Note that Saathoff's ratio is to Total Carbon (TC) rather than EC, but he notes that the fraction of EC in the diesel soot used in his study was 95%.)
CONCLUSION
The PAS readings are correlated (72–85%) with Aethalometer values for three sources (autos, candles, woodburning) investigated in this study. They were nearly as well correlated (63–68%) even when all sources were lumped together. However, for each instrument, the relationships to absolute BC concentrations vary widely across several studies. In addition, the PAS has been shown to respond not only to BC but also to other aerosols, such as particle-bound PAH. Therefore, neither instrument can be considered an accurate or quantitative monitor of absolute BC concentrations. However, if only relative or semiquantitative relationships are considered, either instrument can be profitably used to identify short-term peaks, diurnal variations, indoor-outdoor relationships, personal exposures, real-time high-emitting diesel vehicles, and other phenomena of interest.
Acknowledgments
I thank H. C. Siegmann, K. Siegmann, E. Chikliwallah, and W.R. Ott for providing data, references, and stimulating discussion. An anonymous reviewer read the first two versions of this article carefully and improved its focus.
Notes
a Uncertain which PAS model was used.
b Ratio is to total carbon (EC + OC).
Related Research Data
REFERENCES
- Allen , G. A. , Lawrence , J. and Koutrakis , P. 1999 . Field Validation of a Semi-Continuous Method for Aerosol Black Carbon (Aethalometer) and Temporal Patterns of Summertime Hourly Black Carbon Measurements in Southwestern PA . Atmos. Environ. , 33 : 817 – 823 . [CSA]
- Arnott , W. P. , Hamasha , K. , Moosmuller , H. , Sheridan , P. J. and Ogren , J. A. 2005 . Towards Aerosol Light-Absorption Measurements with a 7-Wavelength Aethalometer: Evaluation with a Photoacoustic Instrument and 3-Wavelength Nephelometer . Aer. Sci. Technol. , 39 ( 1 ) : 17 – 29 . [CROSSREF] [CSA]
- Babich , P. , Davey , M. , Allen , G. and Koutrakis , P. 2000 . Method Comparisons for Particulate Nitrate, Elemental Carbon, and PM2.5 Mass in Seven US Cities . J. Air and Waste Manage. Assoc. , 50 : 1095 – 1105 . [CSA]
- Bukowiecki , N. , Kittelson , D. B. , Watts , W. F. , Burtscher , H. , Weingartner , E. and Baltensperger , U. 2002 . Real-Time Characterization of Ultrafine and Accumulation Mode Particles in Ambient Combustion Aerosols . J. Aerosol Sci. , 33 : 1139 – 1154 . [CROSSREF] [CSA]
- Burtscher , H. 2005 . Physical Characterization of Particulate Emissions from Diesel Engines: A Review . Journal of Aerosol Science , on-line at www.sciencedirect.comaccessed on March 15, 2005[CSA]
- Burtscher , H. , Scherrer , L. and Siegmann , H. C. 1982 . Probing Aerosols by Photoelectric Charging . J. Applied Physics , 53 ( 5 ) [CROSSREF] [CSA]
- Burtscher , H. and Schmidt-Ott . 1986 . In Situ Measurement of Adsorption and Condensation of a Polyaromatic Hydrocarbon on Ultrafine C Particles by Means of Photoemission . J. Aerosol Sci. , 17 : 699 – 703 . [CROSSREF] [CSA]
- Chetwittayachan , T. , Shimazaki , D. and Yamamoto , K. 2002 . A Comparison of Temporal Variation of Particle-Bound Polycyclic Aromatic Hydrocarbons (pPAHs) Concentration in Different Urban Environments: Tokyo, Japan and Bangkok, Thailand . Atmos. Environ. , 36 : 2027 – 2037 . [CROSSREF] [CSA]
- Childers , J. W. , Witherspoon , C. L. , Smith , L. B. and Pleil , J. D. 2000 . Real-Time and Integrated Measurement of Potential Human Exposure to Particle-Bound Polycyclic Aromatic Hydrocarbons (PAH) from Aircraft Exhaust . Environ. Health Persp. , 108 : 853 – 862 . [CSA]
- Chuang , J. C. and Ramamurthi , M. 1997 . Evaluation of a Gossen, GmbH, Model, PAS 1001i Photoelectric Aerosol Sensor for Real-time PAH Monitoring , Research Triangle Park, NC : Project Summary, US Environmental Protection Agency . EPA/600/SR-97/035
- Cyrys , J. , Heinrich , J. Hoek , G. 2003 . Comparison Between Different Traffic-Related Particle Indicators: Elemental Carbon (EC), PM2.5 Mass and Absorbance . J. Exposure Analysis and Environ. Epidemiol. , 13 : 134 – 143 . [CROSSREF] [CSA]
- Dahmann , D. , Hartfiel , G. D. , Jackisch , J. , Matter , U. and Mosimann , T. 2000 . DME-Monitor-Projekt: Validierung and Felderprobung eines direktanzeigenden Messgerates zur DME-Messung an Arbeistplatzen. Hauptverban der geweblichen Berufsgenossenschaften (HVBG) Sankt Augustin, Deutschland
- Fromme , H. , Oddoy , A. , Piloty , M. , Krause , M. and Lahrz , T. 1998 . Polycyclic Aromatic Hydrocarbons (PAH) and Diesel Engine Emission (Elemental Carbon) Inside a Car and a Subway Train . Sci. Total Environ. , 217 : 165 – 173 . [PUBMED] [INFOTRIEVE] [CROSSREF] [CSA]
- Fruin , S. A. , Winer , A. M. and Rodes , C. E. 2004 . Black Carbon Concentrations in California Vehicles and Estimation of In-Vehicle Diesel Exhaust Particulate Matter Exposures . Atmos. Environ. , 38 : 4123 – 4133 . [CROSSREF] [CSA]
- Hansen , A. D. A. and McMurry , P. H. 1990 . An Intercomparison of Measurements of Aerosol Elemental Carbon During the 1986 Carbonaceous Species Method Comparison Study . J. Air & Waste Management Assoc. , 40 : 894 – 895 . [CSA]
- HEI . 1999 . Diesel Emissions and Lung Cancer: Epidemiology and Quantitative Risk Assessment , Boston : Health Effects Institute .
- Hitzenberger , R. , Jennings , S. G. , Larson , S. M. , Dillner , A. , Cachier , H. , Galambos , Z. , Rouc , A. and Spain , T. G. 1999 . Intercomparison of Measurement Methods for Black Carbon Aerosols . Atmos. Environ. , 33 : 2823 – 2833 . [CROSSREF] [CSA]
- Howard-Reed , C. , Wallace , L. A. and Emmerich , S. J. 2003 . Effect of Ventilation Systems and Air Filters on Decay Rates of Particles Produced by Indoor Sources in an Occupied Townhouse . Atmos Environ. , 37 ( 38 ) : 5295 – 5306 . [CROSSREF] [CSA]
- Howard-Reed , C. H. , Wallace , L. A. and Ott , W. R. 2002 . The Effect of Opening Windows on Air Change Rates in Two Homes . J. Air & Waste Management Assoc. , 52 : 147 – 159 . [CSA]
- Hüglin , Ch , Gaegauf , C. H. , Künzel and Burtscher , H. 1997 . Characterization of Wood Combustion Particles: Morphology, Mobility, and Photoelectric Activity . Environ. Sci. Technolo. , 31 : 3439 – 3447 . [CROSSREF] [CSA]
- Jeong , C.-H. , Hopke , P. K. , Kim , E. and Lee , D.-W. 2004 . The Comparison Between Thermal-Optical Transmittance Elemental Carbon and Aethalometer Black Carbon Measured at Multiple Monitoring Sites . Atmos. Environ. , 38 : 5193 – 5204 . [CROSSREF] [CSA]
- Junker , M. , Kasper , M. , Roosli , M. , Camenzind , M. , Kunzli , N. , Monn , Ch , Theis , G. and Braun-Fahrlander , C. 2000 . Airborne Particle Number Profiles, Particle Mass Distributions and Particle-Bound PAH Concentrations Within the City Environment of Basel: An Assessment as Part of the BRISKA Project . Atmos. Environ. , 34 : 3171 – 3181 . [CROSSREF] [CSA]
- Kittelson , D. B. , Watts , W. F. , Savstrom , J. C. and Johnson , J. P. 2005 . Influence of a Catalytic Stripper on the Response of Real Time Aerosol Instruments to Diesel Exhaust Aerosol . J. Aerosol Sci. , 36 ( 9 ) : 1089 – 1107 . [CROSSREF] [CSA]
- Kittelson , D. B. , Watts , W. , Ramachandran , G. , Paulsen , D. and Krieger , C. 2002 . Research Directions to Improve Estimates of Human Exposure and Risk from Diesel Exhaust. , Boston : Health Effects Institute .
- Klouda , G. A. , Filliben , J. J. , Parish , H. J. , Chow , J. C. , Watson , J. G. and Cary , R. A. 2005 . Reference Material 8785: Air Particulate Matter on Filter Media . Aerosol Sci. Technol. , 39 : 173 – 183 . [CROSSREF] [CSA]
- LaRosa , L. E. , Buckley , T. J. and Wallace , L. A. 2002 . Real-Time Indoor and Outdoor Measurements of Black Carbon in an Occupied House: An Examination of Sources . J. Air & Waste Management Assoc. , 52 : 174 – 185 . [CSA]
- Lavanchy , V. M. H. , Gaggeler , H. W. , Nyeki , S. and Baltensperger , U. 1999 . Elemental Carbon (EC) and Black Carbon (BC) Measurements with a Thermal Method and an Aethalometer at the High-Alpine Research Station Jungfraujoch . Atmos. Environ. , 33 ( 17 ) : 2759 – 2769 . [CROSSREF] [CSA]
- Maciejczyk , P. B. , Offenberg , J. H. , Clemente , J. , Blaustein , M. , Thurston , G. D. and Chen , L. C. 2004 . Ambient Pollutant Concentrations Measured by a Mobile Laboratory in South Bronx, NY . Atmos. Environ. , 38 : 5283 – 5294 . [CROSSREF] [CSA]
- Marr , L. C. , Grogan , L. A. , Wohrnschimmel , H. , Molina , L. T. , Molina , M. J. , Smith , T. J. and Garshick , E. 2004 . Vehicle Traffic as a Source of Particulate Polycyclic Aromatic Hydrocarbon Exposure in the Mexico City Metropolitan Area . Environ. Sci. Technol. , 38 ( 9 ) : 2584 – 2592 . [PUBMED] [INFOTRIEVE] [CROSSREF] [CSA]
- Matter , D. , Siegmann , H. C. and Burtscher , H. 1999 . Dynamic Field Measurements of Submicron Particles from Diesel Engines . Environ. Sci. Technol. , 33 : 1946 – 952 . [CROSSREF] [CSA]
- Petzold , A. and Niessner , R. 1995 . Intercomparison Study on Soot-Selective Methods: Field Study Results from Several Polluted Areas in Germany . J. Aerosol Sci. , 26 ( Suppl. 1 ) : S393 – S394 . [CROSSREF] [CSA]
- Petzold , A. , Kopp , C. and Niessner , R. 1997 . The Dependence of the Specific Attenuation Cross-Section on Black Carbon Mass Fraction and Particle Size . Atmos. Environ. , 31 ( 5 ) : 661 – 672 . [CROSSREF] [CSA]
- Prszybilla , K. 2002 . Investigation of Particles from Combustion with Special Consideration of Elemental Carbon. , Zurich, , Switzerland : Swiss Federal Institute of Technology . Ph.D. thesis
- Putaud , J.-P. , Raes , F. Van Dingenen , R. V. 2004 . A European Aerosol Phenomenology—2: Chemical Characteristics of Particulate Matter at Kerbside, Urban, Rural and Background Sites in Europe . Atmos. Environ. , 38 : 2579 – 2595 . [CROSSREF] [CSA]
- Ruellan , S. and Cachier , H. 2001 . Characterisation of Fresh Particulate Vehicular Exhausts Near a Paris High Flow Road . Atmos. Environ. , 35 : 453 – 468 . [CROSSREF] [CSA]
- Saathoff , H. , Naumann , K.-H. , Schnaiter , M. , Schock , W. , Weingartner , E. , Baltensperger , U. , Kramer , L. , Bozoki , Z. , Pöschl , U. , Niessner , R. and Schurath , U. 2003 . Carbon Mass Determinations During the AIDA Soot Aerosol Campaign 1999 . J. Aerosol Sci. , 34 : 1399 – 1420 . [CROSSREF] [CSA]
- Siegmann , K. and Siegmann , H. C. 1998 . “ Molecular Precursor of Soot and Quantification of the Associated Health Riskz ” . In Current Problems in Condensed Matter. , Edited by: Moran-Lopez . New York : Plenum Press .
- Tang , S. , Johnson , R. , Lanni , T. and Webster , W. 2000 . Monitoring of PM-Bound Polycyclic Aromatic Hydrocarbons from Diesel Vehicles by Photoelectric Aerosol Sensor (PAS) , Society of Automotive Engineers, Inc. . Paper No. 2001-01-3578
- Ten Brink , H. , Maenhaut , W. Hitzenberger , R. 2004 . INTERCOMP2000: The Comparability of Methods in Use in Europe for Measuring the Carbon Content of Aerosol . Atmos. Environ. , 38 : 6507 – 6519 . [CROSSREF] [CSA]
- Venkataraman , C. , Habib , G. , Eiguren-Fernandez , A. , Miguel , A. H. and Friedlander , S. K. 2005 . Residential Biofuels in South Asia: Carbonaceous Aerosol Emissions and Climate Impacts . Science , 307 : 1454 – 1456 . [PUBMED] [INFOTRIEVE] [CROSSREF] [CSA]
- Wallace , L. A. 2005 . Ultrafine Particles from a Vented Gas Clothes Dryer . Atmos. Environ. , 39 ( 32 ) : 5777 – 5786 . [CROSSREF] [CSA]
- Wallace , L. A. 2000 . Real-Time Monitoring of Particles, PAH, and CO in an Occupied Townhouse . Appl. Occup. Environ. Hygiene , 15 ( 1 ) : 39 – 47 . [CROSSREF] [CSA]
- Wallace , L. A. and Howard-Reed , C. H. 2002 . Continuous Monitoring of Ultrafine, Fine, and Coarse Particles in a Residence for 18 Months in 1999–2000 . J. Air & Waste Management Assoc. , 52 ( 7 ) : 828 – 844 . [CSA]
- Wallace , L. A. , Emmerich , S. J. and Howard-Reed , C. 2004a . Source Strengths of Ultrafine and Fine Particles Due to Cooking with a Gas Stove . Environ. Sci. Technol. , 38 ( 8 ) 23-0-2311[CROSSREF] [CSA]
- Wallace , L. A. , Emmerich , S. J. and Howard-Reed , C. 2004b . Effect of Central Fans and In-Duct Filters on Deposition Rates of Ultrafine and Fine Particles in an Occupied Townhouse . Atmos. Environ. , 38 ( 4 ) : 405 – 413 . [CROSSREF] [CSA]
- Wallace , L. A. , Howard-Reed , C. H. and Emmerich , S. J. 2002 . Continuous Measurements of Air Change Rates in an Occupied House for One Year: The Effect of Temperature, Wind, Fans, and Windows . J. Exposure Anal. Environ. Epidemiol. , 12 : 296 – 306 . [CROSSREF] [CSA]
- Watson , J. G. and Chow , J. C. 2001 . Estimating Middle-, Neighborhood-, and Urban-Scale Contributions to Elemental Carbon in Mexico City with a Rapid Response Aethalometer . J. Air & Waste Manage Assoc. , 51 : 1522 – 1528 . [CSA]
- Weingartner , E. , Keller , C. , Sahel , W. A. , Baltensperger , U. and Burtscher , H. 1995 . Field study of Vehicle Emission Factors in a Road Tunnel . J. Aerosol Sci. , 26 ( Suppl. 1 ) : S669 – S670 . [CROSSREF] [CSA]
- Weingartner , E. , Keller , C. , Stahel , W. A. , Burtscher , H. and Baltensperger , U. 1997 . Aerosol Emission in a Road Tunnel . Atmos. Environ. , 31 : 451 – 462 . [CROSSREF] [CSA]
- Weingartner , E. , Saathoff , H. , Schnaiter , M. , Streit , N. , Bitnar , B. and Baltensperger , U. 2003 . Absorption of Light by Soot Particles: Determination of the Absorption Coefficient by Means of Aethalometers . J. Aerosol Sci. , 34 : 1445 – 1463 . [CROSSREF] [CSA]