We describe a system designed to measure the size, composition, and density of individual spherical particles in real time. It uses a Differential Mobility Analyzer (DMA) to select a monodisperse particle population and the single particle mass spectrometer to measure individual particle aerodynamic diameter. Together the mobility and aerodynamic diameters yield particle density. The mass spectrometer aerodynamic sizing resolution d ν a /Δ d ν a is ∼ 50 and > 100 for 200 nm and 800 nm particles respectively and together with the DMA the overall system resolution is 20. We demonstrate that the line shape of the aerodynamic size distribution can be used to identify asphericity. We present results from two operational schemes: one suitable for most applications, yielding particle density with a precision of ± 2.5%, and a high precision variant, that uses an internal calibrant to remove any of the systematic errors and significantly improves the measurement quality. The high precision scheme is most suitable for laboratory studies, making it possible to follow slight changes in particle density. An application of the system to measure the density of hygroscopic particles in deep metastable phases near zero relative humidity is presented. The density data presented here are consistent with conclusions reached in a number of other studies, namely, that some particle systems, once deliquesced, persist as droplets down to near zero relative humidity.
INTRODUCTION
Recent advances in aerosol research produced tools that make it possible to simultaneously measure a number of attributes for individual particles in real time. Single particle mass spectrometers routinely measure size and composition of individual particles. The capabilities of some of these mass spectrometers have been extended to make possible measurements of hygroscopicity and density in addition to size and composition (CitationBuzorius et al. 2002; CitationKatrib et al. 2004; CitationMurphy et al. 2004; CitationSlowik et al. 2004). Developing technologies that make possible measurements which quantify the relationships between size, composition, density, hygroscopicity, optical properties, and aerosol CCN activity are key to advance our understanding of atmospheric aerosols and their lifecycle.
Density is an important physical property of aerosol particles. It is needed to convert measured size distributions to mass loading and it is often correlated to particle optical properties (CitationTang and Munkelwitz 1994). Given that both density and hygroscopicity are functions of composition, it is not surprising that hygroscopicity of particles belonging to the same chemical class was found to be related to their density (CitationZelenyuk et al. 2003). Monitoring changes in particle densities can also be used to track aerosol chemical transformations (CitationKatrib et al. 2004).
The relationship between particle density and composition was traditionally used to deduce the aerosol density (CitationHasan and Dzubay 1983), but direct methods for measuring density are much more reliable. Most commonly particle bulk density was derived by separately measuring aerosol mass and aerosol volume (CitationHänel and Thudium 1977; CitationMorawska et al. 1999; CitationPitz et al. 2003). A recently developed method for measuring the size resolved particle density uses a tandem DMA to select a narrow size distribution of particles and an Aerosol Particle Mass analyzer (APM) to measure the mass of the monodisperse aerosol (CitationMcMurry et al. 2002).
Most recently CitationMurphy et al. (2004) presented a method that combines the measurement of individual particle optical diameter with its aerodynamic diameter that together yield individual particle density. Since the measurements were carried out in their modified single particle mass spectrometer they were able to show that the derived densities were consistent with the composition obtained from the mass spectra.
The most common approach to measuring particle density is based on the combined measurement of mobility and aerodynamic diameters and the relationship between the two to derive particle density. CitationKelly and McMurry (1992), CitationStein et al. (1994), CitationHering and Stolzenburg (1995), CitationSchleicher et al. (1995), and CitationVirtanen et al. (2004) have all relied on coupling a DMA with an impactor to obtain the size resolved aerosol density. CitationHand and Kreidenweis (2002) have shown that it is possible to derive an average aerosol density by measuring in parallel mobility and aerodynamic size distributions using a DMA and aerodynamic particle sizer, respectively.
Finally it is noteworthy to mention the studies by CitationKatrib et al. (2004), in which the mobility diameter of laboratory generated particles was measured in parallel with the measurements of particle mass and aerodynamic diameter to derive the density by two independent methods using the Aerosol Mass Spectrometer (AMS).
It is important to note that the combined measurement of mobility and aerodynamic diameters yields particle density only if the particles are spherical. For nonspherical particles the tendency has been to define an effective density instead (CitationKelly and McMurry 1992; CitationStein et al. 1994; CitationJimenez et al. 2003). In the present study we focus on spherical particles only. The effect of shape on the relationship between mobility and aerodynamic diameters is discussed in a separate publication (CitationZelenyuk et al. 2005). A recent review of methods to characterize particle morphology and measure density by combining mobility and aerodynamic diameter measurements is presented by CitationDeCarlo et al. (2004).
The developments presented here are in part of an overall goal of advancing our Single Particle Laser Ablation Time-of-flight mass spectrometer (SPLAT) (CitationZelenyuk and Imre 2005) to facilitate aerosol multidimensional characterization. The measurements presented here involve combining SPLAT with a DMA to measure simultaneously the size, composition and density, or effective density of individual particles. The addition of measured density, or effective density to the mass spectrum of each particle should greatly improve the accuracy of the classification process of the mass spectral data. For example, sulfate particles mixed with organic are very common atmospheric particles. In these particles the relative amounts of organic to sulfate determine the particle properties. Yet, single particle mass spectrometers lack the quantitative capability to provide such information on a single particle basis. Adding to the mass spectrum high resolution measurements of particle effective density should significantly improve the system. It is important to note that the aim here is to develop a method that makes it possible to gain information on each and every individual particle, which requires both high accuracy and high precision.
This article describes the combined SPLAT/DMA system for high precision density measurements of individual spherical particles. We report the results from two measurement schemes: a standard SPLAT/DMA system that yields a precision of ± 2.5%, which is suitable for most applications, and a variant, that uses an internal calibrant, that can improve the precision to ± 0.5%.
We also demonstrate that the SPLAT/DMA system has the capacity to identify particle deviations from sphericity on the basis of width of the aerodynamic size distributions.
An application of the high precision density measurement to hygroscopic particle systems in highly metastable phases near zero relative humidity (RH) is presented. The thermodynamically stable phase of hygroscopic salts at low RH is crystalline, and at higher RH, above the deliquescence point, the stable phase is solution droplet. Hence, hygroscopic particles subjected to increasing relative humidity undergo phase transformation when the RH reaches their deliquescence point and further increase in RH results in droplet growth. In small particles this process is not reversible. One characteristic attribute of small hygroscopic particles, which is a consequence of their ultra purity, is their tendency to form metastable phases. What is found most commonly is that once deliquesced, solution droplets persist as metastable supersaturated solution to RH which can be significantly lower than the deliquescence point before the barrier to homogeneous nucleation is overcome and crystallization takes place. Some substances that are commonly found in atmospheric particles, when pure never form the thermodynamically stable crystalline phase. Quantifying the properties of hygroscopic systems in these highly metastable states is of special interest.
EXPERIMENT
Apparatus and Measurement Principles
The density measurements rely on the relationship between mobility and aerodynamic diameters. The aerodynamic diameter d a for particles of arbitrary shape at any pressure is given by CitationHinds (1999):
Equation Equation1 can be greatly simplified by taking into account the specifics of the present study, namely, that it is limited to spherical particles for which χ = 1, and d ve is equal to the mobility diameter d b (CitationDeCarlo et al. 2004). Also, since the aerodynamic diameter is measured at low pressure we can use the free molecular regime approximation for the Cunningham slip correction factor,C c (d) ≅2λ/d (α + β), where λ is the mean free path and α and β are constants. Substituting into Equation Equation1 we obtain the simplified expression relating particle density to the ratio of the two measured diameters d va and d b .
A schematic representation of the high precision version of the experimental setup is shown in . The specific setup shown in is for the case where particles of unknown density (1) are hygroscopic and the calibrant (2) is an oil of known density. Hygroscopic particles are generated by aerosolizing a water solution with an atomizer (TSI Inc., Model 3076), dried by two diffusion dryers (TSI Inc., Model 3062) in series, and then diluted and further dried by mixing with dry compressed air at ∼ 50:1 ratio. We estimate a final RH for the aerosol flow to be less than 0.1% RH. The second atomizer is used to generate the calibrant particles by aerosolizing the neat oil, our internal calibrant. Neat solution is used to avoid solvent effects. The two aerosol flows are mixed in the mixing and dilution chamber. Dried and mixed aerosol flow is sent to the DMA (TSI Inc., Model 3081) to generate monodisperse aerosol. The majority of the DMA output is sent to the CPC (TSI Inc., Model 3025A) for monitoring purposes, and a small fraction is drawn into SPLAT for aerodynamic sizing.
FIG. 1 A schematic representation of the SPLAT/DMA system for measuring particle density. The specific setup is designed to make high precision measurements of the density of hygroscopic particles with oil as the calibrant. Atomizer 1 is used to aerosolize a water solution of the substance of interest. The aerosol flow is dried using two diffusion dryers, and by dilution with dry air. The calibrant is aerosolized from a neat solution and mixed with the unknown flow in the dilution and mixing chamber. The externally mixed polydisperse aerosol is passed through the DMA to generate a monodisperse aerosol, the aerodynamic diameter of which is measured by SPLAT.
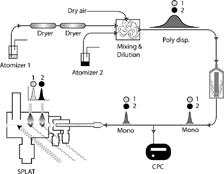
SPLAT is described in detail in a separate publication (CitationZelenyuk and Imre 2005); here we give a brief description only. Particles enter the instrument through a 100 micron orifice into an aerodynamic lens that forms a very narrow low divergence particle beam and transmits the particles into the vacuum chamber with high efficiency. As the particles pass through the lens they acquire velocities that are a function of their aerodynamic diameter. From the lens particles enter the main chamber through two differentially pumped stages. The main chamber is equipped with two optical detection stages positioned 16 cm apart. Each optical detection stage is composed of a green laser for light scattering, ellipsoidal reflector for light collection and a photomultiplier for light detection and signal processing. When a particle passes through the laser beams it scatters light, which is collected by the ellipsoidal reflectors and imaged onto the PMTs. Each particle is detected twice, once at each stage, and the time of flight between the two optical detection stages is recorded. Measuring the time of flight of polystyrene latex (PSL) particles (Duke Scientific, density 1.05 g cm− 3) of known diameter and density derives the time of flight to aerodynamic diameter calibration. Once detected and sized, particle composition is obtained by IR laser heating followed by UV laser ionization and time-of-flight mass spectroscopy. In the experiments described here the mass spectrometer is not used.
RESULTS AND DISCUSSIONS
SPLAT, Measurements of Vacuum Aerodynamic Diameter
In SPLAT the aerodynamic diameter is obtained by converting measured particle time of flight between the two optical detection stages to aerodynamic diameter using an empirically derived calibration curve, which is generated using NIST certified PSL beads. PSL particles are suspended in water and aerosolized from a dilute solution by atomizing; the aerosol flow is dried with two diffusion dryers connected in series to be sampled by SPLAT. An example of a calibration run is presented in . shows a plot of particle time of flight for a number of PSL sizes and is the plot of time of flight vs. the PSL known vacuum aerodynamic diameter for the same data. The solid line in is the best fit to the data. Empirically we find that a linear fit of a log-log plot of time of flight vs. aerodynamic diameter fits the data extremely well. Because the calibration is sensitive to changes in gas density, orifice size and clogging, and pressure and temperature in the lens, it is carried out often.
FIG. 2 a) Measured time of flights between the two optical detection stages for PSL particles of the sizes specified in the figure. b) A log/log plot of the observed particle time of flights shown in a) versus the PSL particle known vacuum aerodynamic diameters. The linear fit is the empirically derived calibration. c) and d) Expanded views of the observed vacuum aerodynamic size distributions for 199 nm and 799 nm PSL particles showing the instruments sizing resolution.
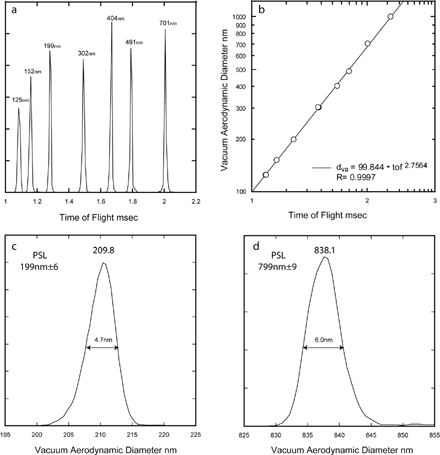
An estimate of SPLAT's ultimate sizing resolution can be obtained by examining the distribution of observed vacuum aerodynamic sizes of the 199 ± 6 nm and 799 ± 9 nm PSL particles for which the manufacturer specifies spreads of 1.7% and 1% (FWHM). and provide expanded views of the measured aerodynamic diameters for these particles, showing observed vacuum aerodynamic diameters of 209.8 nm and 838.1 nm, to be compared to 199*1.05 = 208.95 nm and 799*1.05 = 838.9 nm. Most notably, the measured spreads are 4.7 nm and 6 nm or 2.5% and 0.7% (FWHM) which can be translated to a conservatively estimated SPLAT sizing resolution (defined as d ν a /Δ d ν a ) of ∼50 and > 100 for 200 nm and 800 nm particles respectively.
The Relationship between Line Shape and Particle Shape
As we point out in the previous section the application of Equation Equation2 to extract particle density from the ratio of d ν a and d b is limited to spherical particles, it is therefore important to be able to identify deviations from sphericity. In a separate publication (CitationZelenyuk et al. 2005) we present a detailed study of the relationship between vacuum aerodynamic diameter and particle shape. An important conclusion that emerged from this work is that there is a robust and reproducible relationship between the line shape of the vacuum aerodynamic size distribution and particle shape. In the present article we use this fact to establish particle sphericity.
This section is intended to provide some of the underlying experimental evidence that we used to establish the fact that the line shape of the measured vacuum aerodynamic diameter provides a sensitive way to distinguish between particles on the basis of their sphericity.
We begin with an examination of PSL particles specified by the manufacturer and NIST certified to be spherical. A recent study by CitationKatrib et al. (2004) demonstrated, through the measurement of particle beam divergence, that deviations from sphericity may become an issue when PSL particles are generated by aerosolizing concentrated suspensions. In we show a series of measured d ν a for 302 nm PSL beads obtained by aerosolizing suspensions of successively more concentrated solutions numbered (1) through (4). The lowest concentration distribution (1) has a width of 3% (FWHM) in accord with the manufacturer specified size distribution for these particles. But as the PSL solution concentration is increased, a shoulder appears on the larger diameter side and at the higher concentrations additional peaks corresponding to agglomerates also appear (not shown). A comparison of the curves obtained from the least and most concentrated solutions, (1) and (4), shows that the latter can be deconvoluted into a sum of two distributions: a narrow distribution, identical to (1), and the asymmetric gray shaded area, exhibiting a width of 8% (FWHM).
FIG. 3 Measured vacuum aerodynamic diameter distributions for 302 nm PSL particles aerosolized from suspensions of successively increasing concentrations labeled (1) through (4). The asymmetrically shaded area was obtained by subtracting from curve (4) curve (1)*0.4. The shaded curve is assigned to aspherical PSL particles with nodules containing impurities. The microscopic image to the left is of a spherical PSL particle, while the one on the right shows the presence of two impurity nodules. (The microscopic images are of 240 nm PSL particles).
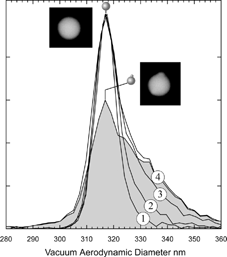
The data presented in provide strong evidence that at higher concentrations new type of particles forms. Indeed examination of the PSL particles under the microscope reveals that at the higher concentrations a significant number of particles were found to be composed of the original PSL with an “attached” nodule or nodules, which contain the additives included in PSL suspension by the manufacturer. A photograph of one such particle is shown in the . Also shown is a photograph of a spherical particle for comparison. Note that while the presence of these small nodules results in no change to the peak position, it markedly affects the line shape.
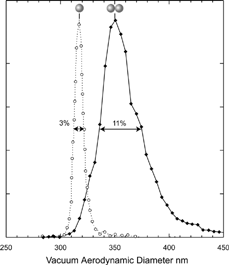
When PSL particles are aerosolized, even from dilute suspensions, a small fraction of the particles are doublets, i.e., two PSL particles stuck together. A study of the line shape of the vacuum aerodynamic size distribution of such PSL doublets, presented in , provides a convenient test case for the effect of shape on the shape of the size distribution. For the present system of 302 nm PSL particles the spread in volume equivalent diameter for the doublets can be calculated to be 4.25%. Yet, as shown in , the observed width of the vacuum aerodynamic diameter for the doublets is 11%, significantly larger, providing clear evidence for a shape induced broadening.
FIG. 4 Measured vacuum aerodynamic diameter for singlets and doublets of 302 nm PSL particles (dashed and solid lines, respectively). The singlets line width is 3% (FWHM), while the line shape corresponding to the doublets is asymmetric and is 11% (FWHM) wide.
The PSL data demonstrate that deviation from sphericity gives rise to broader aerodynamic size distributions. However, PSL particle systems present a special case of monodisperse aerosol manufactured with extremely narrow size distribution. In this study the monodisperse aerosol is generated by the DMA with a distribution that depends on the operational parameters of the DMA. It is therefore important to examine whether under these conditions the SPLAT/DMA system retains the proper sensitivity to identify deviations from sphericity on the basis of line shape.
In we present a comparison between measured vacuum aerodynamic size distributions of Fomblin and ammonium sulfate particles with 200 nm mobility diameters. The DMA generated monodisperse spherical Fomblin oil droplets exhibit an aerodynamic size distributions with a 5% spread, while the width of the distribution corresponding to the solid ammonium sulfate particles is 10%, providing further evidence for a shape induced line broadening. Ammonium sulfate was chosen to provide a stringent test case because it is well known to be nearly spherical. The measured dynamic shape factor in the free molecular regime for the ammonium sulfate particles in this case is 1.035, in agreement with the microscope images of nearly spherical ammonium sulfate particles shown in the inset.
FIG. 5 Measured vacuum aerodynamic diameter for 200 nm mobility diameter Fomblin oil and ammonium sulfate particles. The observed spreads in vacuum aerodynamic diameters are 5% and 10% (FWHM) for Fomblin and ammonium sulfate respectively. The micrographs on the left are of the same size ammonium sulfate particles.
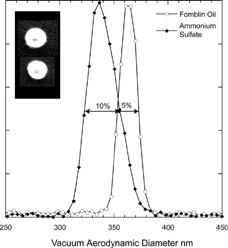
We conclude that when PSL particles are aerosolized from concentrated solutions significant fraction of particles may be aspherical. It is for that reason that we always use these solutions in the most dilute form possible. Moreover, the measured line shape provides a convenient indicator for the presence of contaminants. The observed line shape for the PSL doublets clearly demonstrates the broadening effect of asphericity on aerodynamic size distributions. Extending these observations to DMA produced monodisperse ammonium sulfate particles shows that the SPLAT/DMA system has the requisite resolution to spot even mild asphericity as is the case here.
Measuring the Density of Stable Spherical Particles
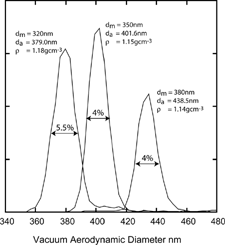
Polymethyl methacrylate (PMMA) particles are similar to the PSL particles used for calibration and therefore a convenient first test case. The PMMA particles used here are spherical with an average diameter of ∼ 350 nm and a wide size distribution (40 nm FWHM). To measure the density of these particles we first select a narrow size distribution using the DMA and send it to SPLAT. shows a measurement of the vacuum aerodynamic diameters of 320 nm, 350 nm, and 380 nm mobility diameters PMMA particles. The observed average vacuum aerodynamic diameters for these three sizes are 379.0 nm, 401.6 nm, and 438.5 nm yielding densities of 1.18 g cm− 3, 1.15 g cm− 3, and 1.14 g cm− 3, respectively. Averaging over all PMMA measurements gives a density of 1.158 g cm− 3 as compared with the known density of 1.19 g cm− 3, or 2.7% too low. Note that the observed line widths of 4% (FWHM) and 5.5% (FWHM) for the combined SPLAT/DMA system are consistent with spherical particles.
FIG. 6 Measured vacuum aerodynamic diameters of 320 nm, 350 nm, and 380 nm mobility diameters PMMA particles. The line widths illustrate the SPLAT/DMA overall sizing resolution.
Measuring the density of a variety of spherical particles with densities from 0.865 g cm− 3 to 1.9 g cm− 3 using the SPLAT/DMA system generates a test of the overall scheme. A summary of these measurements is given in , and a plot of observed versus known densities with a linear fit to the data is shown in . These data are a product of over 400 measurements of 10 different substances with sizes ranging from 150 nm to 700 nm. Note that the slope of the fitted line is 0.99987 and the intercept is −0.0034. The average spread in measured densities is ± 2.1% and the average error is 1.2%, where the average error is defined as 100% * |ρ lit − ρ obs |/ρ lit , ρ lit is the reported density and ρ obs is our measured density.
FIG. 7 Comparison of measured and known densities for the substances listed in . The solid line is a fit to the data.
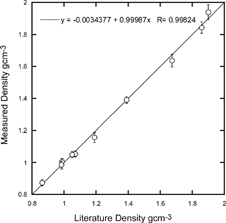
TABLE 1 Measured particle densities, bulk densities, and uncertainties and errors
We conclude that the attainable precision and accuracy with the standard SPLAT/DMA system are clearly sufficient for most applications. In the present study, however, the goal here is to explore the ultimate limits of this system.
High Precision Density Measurements
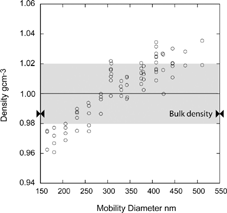
Before we proceed to describe the high precision density measurement approach we developed it is instructive to examine magnitudes of spreads, errors and their sources. First we note that the inherent line width of the SPLAT/DMA system is 5% (FWHM), most of which is due to the size distribution of the DMA selected monodisperse aerosol. If this was the only source of error we would expect that repeating the very same experiment would yield a spread in average densities on the order of ± 0.5%. Yet, the spread in measured densities listed in is more than a factor of 4 higher. These values, however, are based on the statistics of measurements carried out over a wide particle size range and not on repeating the very same experiments. An example of one of the datasets that is included in is presented in , where the measured densities of 160 nm to 500 nm DOP particles are plotted as a function of particle size. An analysis of the data in shows that the spread of observed densities for a given size, as expected, is small, between 0.5% and 0.8%, even though SPLAT has been realigned and recalibrated over the measurement period. The overall data, however, exhibit a clear pattern of a size dependent density, revealing a systematic error.
FIG. 8 Measured densities for DOP particles as a function of particle size. A total of 83 measurements yield an average density of 1.003 g/cc and a spread of ± 2.02% (shaded area).
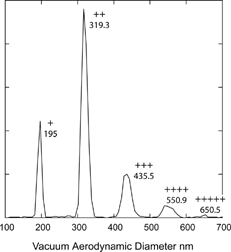
To measure the density of particles of various sizes we rely either on changing the DMA setting to select particles of different mobility diameter, or on the fact that DMA simultaneously selects particles of several diameters and charges. An example of the latter case is presented in , showing the measured vacuum aerodynamic diameters of 200 nm mobility diameter DOP particles. shows 5 different particle sizes with charges denoted in the figure by “+,” “++,” etc.
FIG. 9 Measured vacuum aerodynamic diameter of 200 nm mobility diameter DOP particles. The symbols “+, ++, …” denote particle charge.
The data in include two types of measurements, those generated by changing DMA settings and others derived from multiply charged particles in which a number of sizes are simultaneously measured. Yet all data points exhibit the same size dependence, indicating that the root of this trend must be caused by a slight mismatch of the relative calibrations of SPLAT and the DMA.
It might be possible to eliminate the systematic trend observed in by repetitive and modified calibration procedures. There is, however, a more robust approach that removes most of the calibration effect and the impact of the inevitable fluctuations in flows and temperatures. Inclusion of a calibrant aerosol whose density is known with the aerosol to be measured effectively provides a continuous calibration for the entire SPLAT/DMA system, circumventing the need for repetitive calibrations.
When two spherical particles with different densities are selected by the DMA simultaneously, their mobility diameters are equal leading to the following relationship:
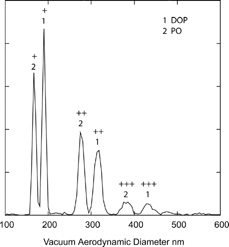
A test of this scheme was carried out using DOP as a calibrant and PO and Fomblin oil as unknowns. These measurements use two atomizers to aerosolize neat solutions, one for DOP and the other for the unknown. The mixed aerosol flow is diluted in the mixing and dilution chamber with dry air and size selected by the DMA. An example of a density measurement in this mode is presented in , where the DMA is set to select particles of 200 nm mobility diameter. Here DOP is used as the internal calibrant and PO is the unknown. A series of pairs of peaks is clearly visible, corresponding to the multiply charged DOP and PO particles. The DOP and PO peaks are easily resolved despite the fact that their densities are only 14% apart. Similar measurements were carried out on DOP and Fomblin for particles with sizes ranging from 160 nm to 538 nm.
FIG. 10 Measured vacuum aerodynamic diameters of 200 nm mobility diameter DOP and Pump Oil particles. The symbols “+, ++, …” denote particle charge.
Averaged over all sizes the PO and Fomblin measured densities by this scheme are 0.867 g cm− 3 and 1.871 g cm− 3 respectively, both within the uncertainty of the known bulk densities. The spread in measured densities have been reduced to 0.6% and 0.4% for PO and Fomblin respectively, which are close to the instrumental line width limit. The data are summarized in .
Table 2 High precision measurements of oil droplets densities
In the following section we describe an application of the SPLAT/DMA system to measure the density of spherical hygroscopic particles in metastable phases near zero relative humidity. Because the densities of these phases are expected to be within less than 10% of the crystal densities high precision is essential. Where available we compare our observed densities to predictions.
Density of Hygroscopic Particles in Metastable Phases near Zero Relative Humidity Background
Many atmospheric aerosol particles of significance are hygroscopic; consequently their interaction with the atmospheric water vapor determines many of their atmospheric properties. Particle size, phase, and optical properties are all functions of the atmospheric RH. Knowledge of the dynamic relationship between RH and particle size, phase, and optical properties is critical to our ability to properly represent aerosol radiative effects in global climate models, predict processes of heterogeneous atmospheric chemistry, and model the transport of aerosols in the lung.
Thermodynamically, hygroscopic substances are expected to be crystalline at RH below the deliquescence point and solution droplets at RH above the deliquescence point. However, what is found is that in particle-form departure from equilibrium thermodynamics is the norm and metastability is commonplace. In bulk solutions crystallization occurs on ever-present impurity particles. In contrast, by virtue of their small size micro and nanoparticles are ultra-pure. Absent heterogeneous nucleation sites crystal formation in small particles must proceed via homogeneous nucleation, the rate of which is a steep function of the supersaturation. How deep the supersaturation needs to be for crystallization to occur within reasonable time depends on particle size and on the system. is meant as a helpful guide to most commonly observed behavior of single component hygroscopic particles as a function of RH.
FIG. 11 A schematic of hydration and dehydration cycles for single component hygroscopic substances in small particle form. See text for detailed description of the three depicted cases.
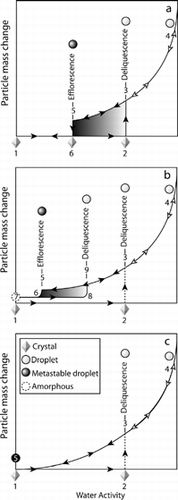
a) Supersaturation Induced Homogeneous Crystallization
The simplest and most common case is shown in . At low RH (1) the particle is crystalline, as the RH is increased no change in particle size or composition occurs until the deliquescence point (2), where a phase transition takes place and a droplet (3), whose concentration equals that of the saturated solution, forms. Further increase of RH results in particle growth, as the droplet absorbs water, forming a dilute solution (4). When the process is reversed and RH is reduced the droplet size decreases following along a reversible path to the point where the RH equals the deliquescence point (3). Further reduction in RH does not result in crystal formation; instead the solution droplet persists, forming a supersaturated solution up to the efflorescence point (5). At this point the supersaturation is sufficient to overcome the barrier to homogeneous nucleation, a critical step in crystal formation in the impurity free environment of small particles. The most common atmospheric system that fits this case is ammonium sulfate for which the RH at deliquesce is 80%, while efflorescence takes place at RH between 35% and 40% (CitationTang and Munkelwitz 1994).
b) Supersaturation Induced Phase Transition to Form Metastable Phases
shows a hydration-dehydration cycles observed in divalent nitrate salt particles such as Ca(NO3)2 (adopted from CitationTang and Fung, 1997). Starting with the anhydrous crystalline phase the path 1-2-3-4-3-5 follows that in . However, here the efflorescence transition (5–6) results in the formation of a metastable amorphous phase (7) that contains a small amount of water. This amorphous phase persists for days even in vacuum. When reversing the process by increasing the RH the amorphous phase does not absorb significant water until a new deliquescence RH (8) is reached, where it transforms into a solution droplet (9), and the hysteresis cycle 7-8-9-5-6-7 is reproducible. Note that despite the fact that the ∼ 0% RH phase is amorphous and contains significant amount of water, the phase transitions 8–9 and 5–6, even if not very sharp, are clear indicators that this phase is distinct from the solution droplet phase that exists along the line 4-3-9-5. In cases belonging to this class it is common for particles to never form the thermodynamically stable solid phases. Below we will discuss the specific case of Ca(NO3)2.
c) Inhibited Phase Transition and the Formation of a Permanent Solution Droplet
The case presented in is the most extreme. Assuming for the moment that we begin the hydration-dehydration cycle with the crystalline phase then the hydration follows the path 1-2-3-4 as it did in cases a) and b). The dehydration path and the final state of the system is, however, very different. It is found that systems belonging to this class never effloresce once the solution droplet (3) forms. The system remains on the reversible path 4-3-5-3-4 and solution droplets are stable for days even under vacuum conditions. Quantifiable properties such as Mie spectra, index of refraction and solute concentration are continuous along the reversible path 4-3-5 indicating that no phase transformations occur, despite the fact that the solute mass fraction reaches nearly 100%. A number of systems of atmospheric significance belong to this class among them are ammonium bisulfate (CitationCziczo et al. 1997), ammonium nitrate (CitationLightstone et al. 2000; CitationCziczo and Abbatt 2000; CitationDougle et al. 1998; CitationTang 1980; CitationRichardson and Hightower 1987), sodium bisulfate (CitationTang and Munkelwitz 1994), and sodium nitrate (CitationHoffman et al. 2004). We note, however, that impurities, which are present under most uncontrolled settings, can serve as nucleation sites and prevent deep metastability from being reached.
Results
Ca(NO 3 ) 2
Calcium nitrate can be formed in the atmosphere through the reaction of nitric acid with CaCO3, commercially it is sold as Ca(NO3)2· 4H2O, which is the thermodynamically stable phase between 12% and 50% RH. A study of the hydration behavior of suspended Ca(NO3)2 single microparticles was presented by CitationTang and Fung (1997). Based on the Mie scattering pattern, the Raman spectra and the electric micro-balance measurement they concluded that when calcium nitrate droplets are dried to ∼ 0% RH they form spheres composed of calcium nitrate in the amorphous phase containing slightly more than 1 water molecule per Ca(NO3)2. CitationTang and Fung (1997) showed that when the RH is increased to ∼ 13% RH the amorphous phase deliquesces, forming a homogeneous droplet. Once deliquesced, solution droplets persist upon dehydration down to ∼ 0% RH, where the solution concentration is 27 molal. A phase transformation described by CitationTang and Fung (1997) as a “freezing over” takes place as the droplet “sheds off” approximately half of its water content, forming the amorphous phase in the process. No information on the density of the supersaturated solution or the amorphous phase is given. The Ca(NO3)2 hysteresis loop, a schematic of which is shown in the inset in , is a classic example of a system belonging to case described above.
FIG. 12 Measured vacuum aerodynamic diameters of 300 nm mobility diameter Ca(NO3)2 and Fomblin particles. The inset shows a schematic, based on CitationTang and Fung (1997), of the hydration and dehydration hysteresis loop for the amorphous Ca(NO3)2 particles.
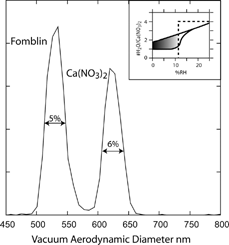
The known physical properties of bulk Ca(NO3)2 indicate that the density of the anhydrous form is 2.54 g cm− 3, and there are two different crystalline phases of Ca(NO3)2· 4H2O: α and β with densities of 1.896 g cm− 3 and 1.82 g cm− 3, respectively. Here we measure the density of Ca(NO3)2 particles in the 200 nm to 400 nm size range in the amorphous metastable phase. Passing Ca(NO3)2 particles through two diffusion dryers and diluting the aerosol flow by a factor of 50 with dry air as shown in , dries the particles to a final RH that we estimate to be less than 0.1% RH. The dilution chamber also serves to mix the internal calibrant and Ca(NO3)2 aerosol flows. The mixed aerosol is size selected by the DMA and aerodynamically sized by SPLAT. Here we chose to use Fomblin as the internal calibrant because its density of 1.86 g cm− 3 is close to the densities of the hygroscopic substances under study. Choosing a calibrant whose density is close to that of the unknown minimizes the effects of calibration drift.
The vacuum aerodynamic diameter spectrum for 300 nm mobility diameter Fomblin and Ca(NO3)2 particles is shown in . The observed line width and density are in agreement with the conclusions reached by CitationTang and Fung (1997) on the basis of their single suspended particle measurements. The narrow line width (6% FWHM) is indicative of spherical particles and the measured density of 2.16 ± 0.02 g cm− 3 is in between that of the tetrahydrate and the anhydrous calcium nitrate, consistent with the formula Ca(NO3)2· nH2O, with n being between 1 and 2. The data are summarized in .
TABLE 3 Extrapolated and observed densities for metastable phases and bulk crystal densities
NH 4 NO 3
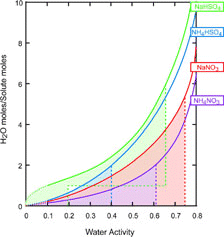
Ammonium nitrate is a very common constituent of atmospheric aerosols. It is a highly hygroscopic salt with a deliquescence point of 61.8% RH (CitationLightstone et al. 2000). A study of the interaction of water vapor with ammonium nitrate particles in a levitation cell is complicated by the fact that the electrolyte itself has a rather high vapor pressure; consequently single suspended particle studies must take into account the fact that the solute is not preserved throughout the experiment. CitationLightstone et al. (2000) have developed a procedure that made it possible to measure the relationship between particle composition and water activity. Their data were found to be in good agreement with the CitationClegg et al. (1998) model, the output from which is shown in .
FIG. 14 A plot of solution concentration as a function of water activity for the systems under study. The plot is based on the CitationClegg et al. (1998) model, which is reliable only down to water activity of 0.1. The dotted lines are extrapolations of the model. The dashed lines indicate deliquescence points and in the case of sodium bisulfate the anhydrous to monohydrate transition as well. The shaded areas indicate regions of metastablility.
A number of investigators have reported a wide range of efflorescence points for ammonium nitrate (CitationChan et al. 1992; CitationTang 1996), while others concluded that ammonium nitrate particles do not effloresce (CitationLightstone et al. 2000; CitationCziczo and Abbatt 2000; CitationDougle et al. 1998; CitationTang 1980; CitationRichardson and Hightower 1987).
CitationLightstone et al. (2000) have carefully investigated the efflorescence behavior of ammonium nitrate particles levitated in a trap. They observed that some particles never effloresced, while others did. The particles that did crystallize did so at a reproducible efflorescence point, but the efflorescence point varied significantly from particle to particle. On the basis of these observations they concluded that in the ∼ 10 micron particles, they were studying, efflorescence was heterogeneously driven by a very small number of active impurity seeds. CitationLightstone et al. (2000) were even able to determine that the source of these impurities was the water that was used to generate the particles. Crystalline particles generated from purge and trap methanol solution, when taken through the deliquescence point by increasing RH, never efflorescence, instead when the pressure in the particle trap was reduced to 10− 6 torr the particles formed an “anhydrous” liquid phase droplet that evaporates rather rapidly as was evident by the Mie spectra and the microbalance data. Based on the fact that no discontinuities were observed in the Mie spectra and that increasing RH reversibly hydrated the solution droplet they concluded that pure ammonium nitrate/water solution droplets do not undergo any phase transitions over the entire RH range.
By conducting the density measurements on particles 200 nm to 1 micron in diameter we have eliminated the possibility of heterogeneously induced crystallization. However, because anhydrous ammonium droplets evaporate rapidly great care must be taken to limit the time these particles spend between the DMA and SPLAT. We have observed unequivocal evidence of particle evaporation when the DMA was over 200 cm from the SPLAT inlet. To assure that evaporative losses do not significantly effect the measurement, the distance between the entrance to SPLAT and the DMA was decreased in steps as particle aerodynamic diameter was monitored. As the distance shortened the aerodynamic diameter increased. The process was repeated until no further changes were detectable. We ended up placing the DMA column with its output 1 cm away from the inlet to the mass spectrometer; a distance shorter than what was determined to be sufficient. Since the single suspended particle studies by CitationLightstone et al. (2000) showed that the presence of even minute amounts of ammonia significantly suppressed evaporation we have chosen as a second precautionary measure to saturate the lines and the aerodynamic lens with ammonia prior to running the experiment.
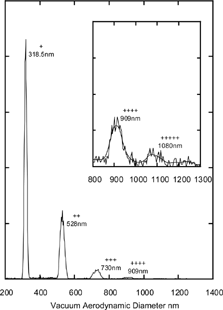
shows one of the runs in which a number of particle sizes were simultaneously measured, again illustrating the advantage gained from the fact that the DMA selects particles on the basis of their size and charge. The measured density for anhydrous ammonium nitrate is 1.57 ± 0.025 g cm− 3, which is 8% lower than the density of the anhydrous crystal. The error bars for this measurement are slightly larger because no internal calibrant was used; however, both DMA and SPLAT were calibrated using PSL particles before and after each run.
FIG. 13 Measured vacuum aerodynamic diameters of 209 nm mobility diameter NH4NO3 particles. The inset shows an expanded scale of the larger size particles.
Ammonium nitrate solution droplet composition as a function of water activity as calculated on the basis of the CitationClegg et al. (1998) model is shown in .
NaNO3
Like calcium nitrate, sodium nitrate isformed in the atmosphere as a result of the reaction of nitric acid with aerosols, most often with sea-salt aerosols. CitationTang and Munkelwitz (1994) have studied the hydration and dehydration behavior of this system in the single particle levitation cell. They derived relationships between solution concentration and droplet density over a wide range of RH and the deliquescence point was found to be 74.5% RH, all in good agreement with the CitationClegg et al. (1998) model the output from which is shown in .
In the CitationTang and Munkelwitz (1994) studies most of the NaNO3 particles crystallized between 20% RH and 30% RH but some persisted down to 10% RH to form solution droplets with concentrations as high as 300 molal or 98 Wt%. In a recent study CitationHoffman et al. (2004) found that submicron NaNO3 particles do not crystallize even under vacuum environment, while larger ones do. The CitationTang and Munkelwitz (1994) experiments typically used particles, which are 8–12 microns in diameter. Taken together the wide range of crystallization RH for the larger particles and absence of crystallization in smaller particles suggest that like ammonium nitrate NaNO3 is sensitive to presence of a few impurity seeds and that absent impurities no crystallization occurs.
CitationTang and Munkelwitz (1994) derived the density vs. solution concentration relationship valid up to 98 Wt% solute concentration, which we extrapolate to 100 Wt% to calculate a density of 2.09 g cm− 3 for the “anhydrous” solution droplet. The calculated “anhydrous” droplet density is in excellent agreement with our observed density for this system of 2.10 ± 0.01 g cm− 3, significantly lower than the density of the anhydrous crystal phase of 2.26 g cm− 3. The good agreement with the CitationTang and Munkelwitz (1994) extrapolated density relationship suggests that in sodium nitrate submicron particles no phase transition occurs providing support for the conclusion reached by CitationHoffman et al. (2004). The data are summarized in .
NH 4 HSO 4
Ammonium bisulfate, a subject of a large number of investigations (CitationColberg et al. 2004; CitationCziczo et al. 1997; CitationTang and Munkelwitz 1994), is a very common atmospheric constituent. It is a highly hygroscopic substance with a deliquescence point of 40% RH. The single particle levitation studies of NH4HSO4 by CitationTang and Munkelwitz (1994) were used to derive relationships between solution concentration and water activity and density.
CitationTang and Munkelwitz (1994) reported that in the electrodynamic trap some ammonium bisulfate particles effloresced at RH as high as 22% RH, while others remain in the liquid form at 10− 6 torr for days, while CitationCziczo et al. (1997) reported that no efflorescence was observed in submicron particles. These observations are again consistent with impurity driven heterogeneous nucleation in 8–10 microns particles and the absence of such impurities in submicron particles.
In the present experiments we study 200 nm to 400 nm ammonium bisulfate particles, which by volume are three orders of magnitude smaller and therefore less likely to contain impurities. Ammonia contamination is also less of an issue for a flow of many particles as is the case here. Nevertheless we have taken great care to minimize ammonia contamination by flowing NH4HSO4 particles through the system for 12 hours prior to the experiment.
Similar to the NaNO3 case of above, we extrapolate the Tang et al. density vs. composition relationship, which is valid to 97 Wt%, to calculate a density of 1.74 g cm− 3 for the anhydrous NH4HSO4 droplets as a reference. Our measured value of 1.77 ± 0.02 g cm− 3 is in reasonably good agreement with the extrapolated value. Because the density of NH4HSO4 and the calibrant are less than 5% apart, and hence too close to be cleanly resolved we run the two separately but successively, which may accounts for the slightly larger error bars for this system. NH4HSO4 data are summarized in , and a plot of water activity and droplet concentration based on the CitationClegg et al. (1998) model is shown in .
NaHSO 4
Sodium bisulfate is also highly hygroscopic electrolyte for which CitationTang and Munkelwitz (1994) derived the only available thermodynamic solution data. In these experiments they were unable to produce solid particles under any conditions. The solution droplets persisted for days despite being at 10−6 torr. They have even tried to induce crystallization by adding an impurity but to no avail. NaHSO4 clearly belongs to case c) of which some members like NaNO3, NH4NO3 and, NH4HSO4 are sensitive to impurities, while others like NaHSO4 do not effloresce until the right impurities are present.
Based on the microbalance data and the Mie scattering spectra CitationTang and Munkelwitz (1994) derived the relationship between solution concentration and water activity and solution density over a wide range of RH. Calculated on the basis of the CitationClegg et al. (1998) model water activity curve and predicted phase transitions for sodium bisulfate are shown in . The model predicts two stable solid phases at 298 K, an anhydrous phase from 0 to 19.7% RH and a monohydrate with deliquescence point at 65% RH. Since the NaHSO4 particles do not effloresce, experimental data on the solid-solid, and solid-solution phases transitions are not available. A comparison of the CitationTang and Munkelwitz (1994) derived solution droplet water activity and that calculated from the CitationClegg et al. (1998) model reveals significant differences at RH below 20%.
Our observed density for sodium bisulfate is 2.19 ± 0.02 g cm− 3. It is possible to extrapolate the CitationTang and Munkelwitz (1994) density vs. composition relationship to calculate the concentration of the solution with that density to yield 99%Wt; the same relationship yields a density 2.22 g cm− 3 for the anhydrous droplet. Note that our observed density is in between 2.43 g cm− 3 and 2.10 g cm− 3, the densities of the anhydrous and monohydrate crystalline phases respectively. The data are summarized in , and a plot of water activity and droplet concentration based on the CitationClegg et al. (1998) model is shown in .
CONCLUSION
We presented our system combining SPLAT with a DMA that is designed to simultaneously measure the size, composition, and density or effective density of individual particles in real time. The ultimate goal is to use these measurements to improve the data classification process. For this scheme to work we must demonstrate overall high sensitivity, and high accuracy and precision of density or effective density determination. The question of high sensitivity is a consequence of the fact that the DMA significantly reduces the particle concentrations. We have already demonstrated the capability to make measurements of DMA size-selected ambient particles with a sufficient frequency to generate statistically meaningful data. The present study is an exploration of the accuracy and precision aspect of the SPLAT/DMA system.
We have shown here that the SPLAT/DMA system has an accuracy of about ± 2.5% and a precision of similar magnitude, which can be compared to a practical scale of reference. Consider one of the most common types of atmospheric aerosols: internally mixed organics and sulfate particles, the density of which could range between ∼ 1.75 g cm− 3 to ∼ 1 g cm− 3 as their composition varies from pure sulfate to mostly organic. The individual particle sulfate/organic ratios can determine particle behavior, especially their interactions with the atmospheric water vapor; yet, individual particle mass spectra are insufficiently quantitative to yield a measure of the sulfate/organic ratios. Adding the measurement of individual particle effective density to its mass spectrum has the potential to overcome this shortcoming of single particle mass spectroscopy. However, for the scheme to be successful on a single particle basis the measurements of individual particle effective densities must be meaningful, which brings us back to the requirement for high precision. We have shown that the present SPLAT/DMA system can easily resolve the relevant range of densities (∼ 1 g cm− 3 to ∼ 1.75 g cm− 3) into more than 10 meaningful classes thereby demonstrating the ability to meet the above requirements.
We have demonstrated that in the SPLAT/DMA system the line shape of the vacuum aerodynamic size distribution provides a simple and direct means to spot deviation from sphericity. The simple rule that we have been able to establish empirically is that asphericity results in line broadening. We showed that the system has the sensitivity to identify even mildly aspherical particles like ammonium sulfate with a dynamic shape factor of 1.035.
The present study focused on spherical particles only. We understand that before we apply this system to the classification of ambient atmospheric particles the effect of particle shape must be carefully examined. We are in the process of creating a library of mass spectra and “effective densities” on the basis of empirical observations. This library will then serve to guide the classification process.
We also presented a variant scheme for measuring particle densities that uses an internal calibrant to improve the measurement accuracy and precision. We were able to demonstrate the capability to measure the density of particles over a wide range of sizes with accuracies that are within the known bulk densities. Moreover, we showed that the spread in measured average densities can be reduced to ± 0.5%. The high precision scheme is not intended for field application, but is very useful for laboratory studies in which small changes in particle density need to be monitored.
Finally, we described an application of the SPLAT/DMA system to measure the densities of hygroscopic particles in highly metastable phases. In these studies the need was to distinguish between the densities of metastable phases and those of the bulk crystals that differ by less than 10%, which implies that this specific application of the SPLAT/DMA system was critically dependent on its high precision.
The densities we measured for the anhydrous droplet phases are 7–10% lower than the crystal densities, with the exception of ammonium bisulfate for which the two phases differ by only 1%. Where possible we compared our observed densities to those calculated on the basis of experimentally derived relationships which we extrapolated to our experimental regime. Good agreements between calculated and observed densities were found. We concluded that in a number of hygroscopic submicron particle systems, when in pure form, no phase transformations occur over the entire relative humidity range, and the hydration-dehydration curves for these systems behave like those for sulfuric acid above its melting point.
Acknowledgments
We thank Alexander Laskin for his help with the Scanning Electron Microscope. We also thank Susan Oatis, Tim Onasch, and Fred Brechtel for help in setting the experiments at Brookhaven National Laboratory. Part of this research was performed in the Environmental Molecular Sciences Laboratory, a national scientific user facility sponsored by the Department of Energy's Office of Biological and Environmental Research at Pacific Northwest National Laboratory (PNNL). PNNL is operated by the U.S. Department of Energy by Battelle Memorial Institute under contract No. DE-AC06-76RL0 1830.
This work was supported by the U.S. Department of Energy Office of Basic Energy Sciences, Chemical Sciences Division.
Notes
a Edwards Ultragrade 19 Pump Oil
b Inland Vacuum Industries
c DiOctyl Phthalate, Sigma-Aldrich
d Duke Scientific
e Polymethyl methacrylate, Bangs Laboratories, Inc
f CPS Instruments Inc.
g Magnetic Beads, Bangs Laboratories, Inc
h Perfluropolyethers, Ausimont
i Perfluroalkylpolyethers, DuPont.
*Extrapolated for 100 Wt% solution droplets.
**%Δ = 100 (Crystal-Observed)/Crystal.
Related Research Data
REFERENCES
- Allen , M. D. and Raabe , O. G. 1982 . Re-Evaluation of Millikan Oil Drop Data for the Motion of Small Particles in Air . J. Aerosol Sci. , 13 ( 6 ) : 537 – 547 . [CSA]
- Allen , M. D. and Raabe , O. G. 1985 . Slip Correction Measurements of Spherical Solid Aerosol-Particles in an Improved Millikan Apparatus . Aerosol Sci. Technol. , 4 ( 3 ) : 269 – 286 . [CSA]
- Buzorius , G. , Zelenyuk , A. , Brechtel , F. and Imre , D. 2002 . Simultaneous Determination of Individual Ambient Particle Size, Hygroscopicity and Composition . Geophys. Res. Lett. , 29 ( 20 ) : 1974 – tion . [CROSSREF] [CSA]
- Chan , C. K. , Flagan , R. C. and Seinfeld , J. H. 1992 . Water Activities of NH4NO3/(NH4)2SO4 Solutions . Atmos. Environ. , 26A : 1661 – 1673 . [CSA]
- Clegg , S. L. , Brimblecombe , P. and Wexler , A. S. 1998 . A Thermodynamic Model of the System H-NH4-Na-SO4-NO3-Cl-H2O at 298.15 K . J. Phys. Chem. , 102A : 2155 – 2171 . Online model URL: http://mae.ucdavis.edu/wexler/aim [CSA]
- Colberg , C. A. , Krieger , U. K. and Peter , T. 2004 . Morphological Investigations of Single Levitated H2SO4/NH3/H2O Aerosol Particles during Deliquescence/Efflorescence Experiments . J. Phys. Chem. A , 108 ( 14 ) : 2700 – 2709 . [CROSSREF] [CSA]
- Cziczo , D. J. , Nowak , J. B. , Hu , J. H. and Abbatt , J. P. D. 1997 . Infrared spectroscopy of model tropospheric aerosols as a function of relative humidity: Observation of deliquescence and crystallization . J. Geophys. Res. , 102 ( D15 ) : 18843 – 18850 . [CROSSREF] [CSA]
- Cziczo , D. J. and Abbatt , J. P. D. J. 2000 . Infrared Observations of the Response of NaCl, MgCl2, NH4HSO4, and NH4NO3 Aerosols to Changes in Relative Humidity from 298 to 238 K . Phys. Chem. A , 104 ( 10 ) : 2038 – 2047 . [CROSSREF] [CSA]
- DeCarlo , P. , Slowik , J. G. , Worsnop , D. R. , Davidovits , P. and Jimenez , J. L. 2004 . Particle Morphology and Density Characterization by Combined Mobility and Aerodynamic Diameter Measurements. Part 1: Theory . Aerosol Sci. Technol. , 38 : 1185 – 1205 . [CROSSREF] [CSA]
- Dougle , P. G. , Veerkind , J. P. and Ten Brink , H. M. 1998 . Crystallisation of Mixtures of Ammonium Nitrate, Ammonium Sulphate and Soot . J. Aerosol Sci. , 29 ( 3 ) : 375 – 386 . [CROSSREF] [CSA]
- Hand , J. L. and Kreidenweis , S. M. 2002 . A New Method for Retrieving Particle Refractive Index and Effective Density from Aerosol Size Distribution Data . Aerosol Sci. Technol. , 36 : 1012 – 1026 . [CROSSREF] [CSA]
- Hanel , G. and Thudium , J. 1977 . Mean Bulk Densities of Samples of Dry Atmospheric Aerosol Particles, A Summary of Measured Data . Pageoph. , 115 : 799 – 803 . [CROSSREF] [CSA]
- Hasan , H. and Dzubay , T. G. 1983 . Apportioning Light Extinction Coefficients to Chemical Species in Atmospheric Aerosol . Atmos. Environ. , 17 ( 8 ) : 1573 – 1581 . [CROSSREF] [CSA]
- Hering , S. V. and Stolzenburg , M. R. 1995 . On-Line Determination of Particle Size and Density in the Nanometer Size Range . Aerosol Sci. Technol. , 23 : 155 – 173 . [CSA]
- Hinds , W. C. 1999 . Aerosol Technology: Properties, Behavior, and Measurement of Airborne Particles. , New York : Wiley .
- Hoffman , R. C. , Laskin , A. and Finlayson-Pitts , B. J. 2004 . Sodium Nitrate Particles: Physical and Chemical Properties during Hydration and Dehydration, and Implications for Aged Sea Salt Aerosols . J. Aerosol Sci. , 35 ( 7 ) : 869 – 887 . [CROSSREF] [CSA]
- Jayne , J. T. , Leard , D. C. , Zhang , X. F. , Davidovits , P. , Smith , K. A. , Kolb , C. E. and Worsnop , D. R. 2000 . Development of an Aerosol Mass Spectrometer for Size and Composition Analysis of Submicron Particles . Aerosol Sci. Technol. , 33 ( 1–2 ) : 49 – 70 . [CSA]
- Jimenez , J. L. , Bahreini , R. , Cocker , D. R. , Zhuang , H. , Varutbangkul , V. , Flagan , R. C. , Seinfeld , J. H. , O'Dowd , C. D. and Hoffmann , T. 2003 . New Particle Formation from Photooxidation of Diiodomethane (CH2I2) . J. Geophys. Res.—Atmos. , 108 ( D10 ) : 4318 [CROSSREF] [CSA]
- Katrib , Y. , Martin , S. T. , Rudich , Y. , Davidovits , P. , Jayne , J. T. and Worsnop , D. R. 2004 . Density Changes of Aerosol Particles as a Result of Chemical Reaction . Atmos. Chem. Phys. Discuss. , 4 : 6431 – 6472 . [CSA]
- Kelly , W. P. and McMurry , P. H. 1992 . Measurement of Particle Density by Inertial Classification of Differential Mobility Analyzer Generated Monodisperse Aerosols . Aerosol Sci. Technol. , 17 ( 3 ) : 199 – 212 . [CSA]
- Lightstone , J. M. , Onasch , T. B. , Imre , D. and Oatis , S. 2000 . Deliquescence, Efflorescence, and Water Activity in Ammonium Nitrate and Mixed Ammonium Nitrate/Succinic Acid Microparticles . J. Phys. Chem. A , 104 ( 41 ) : 9337 – 9346 . [CROSSREF] [CSA]
- McMurry , P. H. , Wang , X. , Park , K. and Ehara , K. 2002 . The Relationship Between Mass and Mobility for Atmospheric Particles: A New Technique for Measuring Particle Density . Aerosol Sci. Technol. , 36 ( 2 ) : 227 – 238 . [CROSSREF] [CSA]
- Morawska , L. , Johnson , G. , Ristovski , Z. D. and Agranovski , V. 1999 . Relation Between Particle Mass and Number for Submicrometer Airborne Particles . Atmos. Environ. , 33 ( 13 ) : 1983 – 1990 . [CROSSREF] [CSA]
- Murphy , D. M. , Cziczo , D. J. , Hudson , P. K. , Schein , M. E. and Thomson , D. S. 2004 . Particle Density Inferred from Simultaneous Optical and Aerodynamic Diameters Sorted by Composition . J. Aerosol Sci. , 35 ( 1 ) : 135 – 139 . [CROSSREF] [CSA]
- Pitz , M. , Cyrys , J. , Karg , E. , Wiedensohler , A. , Wichmann , H. E. and Heinrich , J. 2003 . Variability of Apparent Particle Density of an Urban Aerosol . Environ. Sci. Technol. , 37 ( 19 ) : 4336 – 4342 . [PUBMED] [INFOTRIEVE] [CROSSREF] [CSA]
- Richardson , C. B. and Hightower , R. L. 1987 . Evaporation of Ammonium-Nitrate Particles . Atmos. Environ. , 21 ( 4 ) : 971 – 975 . [CROSSREF] [CSA]
- Rader , D. J. 1990 . Momentum Slip Correction Factor for Small Particles in 9 Common Gases . J. Aerosol Sci. , 21 ( 2 ) : 161 – 168 . [CROSSREF] [CSA]
- Schleicher , B. , Kunzel , S. and Burtscher , H. 1995 . In-Situ Measurement of Size and Density of Submicron Aerosol-Particles . J. Appl. Phy. , 78 ( 7 ) : 4416 – 4422 . [CROSSREF] [CSA]
- Slowik , J. G. , Stainken , K. , Davidovits , P. , Williams , L. R. , Jayne , J. T. , Kolb , C. E. , Worsnop , D. R. , Rudich , Y. , DeCarlo , P. and Jimenez , J. L. 2004 . Particle Morphology and Density Characterization by Combined Mobility and Aerodynamic Diameter Measurements. Part 2: Application to Combustion Generated Soot Particles as a Function of Fuel Equivalence Ratio . Aerosol Sci. Technol. , 38 : 1206 – 1222 . [CROSSREF] [CSA]
- Stein , S. W. , Turpin , B. J. , Cai , X. P. , Huang , C. P. F. and McMurry , P. H. 1994 . Measurements of Relative Humidity-Dependent Bounce and Density for Atmospheric Particles Using the DMA-Impactor Technique . Atmos. Environ. , 28 ( 10 ) : 1739 – 1746 . [CROSSREF] [CSA]
- Tang , I. N. and Fung , K. H. 1997 . Hydration and Raman Scattering Studies of Levitated Microparticles: Ba(MO3)2, Sr(NO3)2, and Ca(NO3)2 . J. Chem. Phys. , 106 ( 5 ) : 1653 – 1660 . [CROSSREF] [CSA]
- Tang , I. N. and Munkelwitz , H. R. 1994 . Water Activities, Densities, and Refractive-Indexes of Aqueous Sulfates and Sodium-Nitrate Droplets of Atmospheric Importance . J. Geophys. Res.—Atmos. , 99 ( D9 ) : 18801 – 18808 . [CROSSREF] [CSA]
- Tang , I. N. 1980 . “ Deliquescence Properties and Particle Size Change of Hygroscopic Aerosols ” . In Generation of Aerosols and Facilities for Exposure Experiments , Edited by: Willeke , K. pp. 153 – 165 . Ann Arbor, MI : Ann Arbor Science Pub. Inc. .
- Tang , I. N. 1996 . Chemical and Size Effects of Hygroscopic Aerosols on Light Scattering Coefficients . J. Geophys. Res. , 101 ( D14 ) : 19,245 – 19,250 . [CROSSREF] [CSA]
- Virtanen , A. , Ristimaki , J. and Keskinen , J. 2004 . Method for Measuring Effective Density and Fractal Dimension of Aerosol Agglomerates . Aerosol Sci. Technol. , 38 ( 5 ) : 437 – 446 . [CROSSREF] [CSA]
- Zelenyuk , A. and Imre , D. 2005 . Single Particle Laser Ablation Time of flight Mass Spectrometer: An Introduction to SPLAT . Aerosol Sci. Technol. , 39 ( 6 ) : 554 – 568 . [CSA]
- Zelenyuk , A. , Cai , Y. and Imre , D. 2005 . From Agglomerates of Spheres to Irregularly Shaped Particles: Determination of Dynamic Shape Factors from Measurements of Mobility and Vacuum Aerodynamic Diameters . Aerosol Sci. Technol. , Submitted[CSA]
- Zelenyuk , A. , Imre , D. , Han , J.-H. and Oatis , S. 2003 . Simultaneous Measurement of Size, Composition, Hygroscopicity, and Density of Single Ambient Particles . Eos Trans. AGU , 84 ( 46 ) Fall Meet. Suppl., Abstract A12B-0087[CSA]