New automated instrumentation for the rapid acquisition of aerosol sampler aspiration efficiency data has been applied to an investigation of a range of personal aerosol samplers of the type developed during the 1980s at the Institute of Occupational Medicine (IOM) in Edinburgh, Scotland, U.K. The experimental research was carried out in a small wind tunnel, and the relation of the results for IOM-like samplers to full-scale life-size personal aerosol sampling scenarios—like those encountered in occupational aerosol exposure assessment—was investigated by reference to the scaling laws that have been developed based on familiar aerosol mechanics as they apply to the physics of aerosol sampling. In the small-scale experimental study, the IOM-like sampler was mounted centrally on a rectangular bluff body, simulating the wearing of the sampler on the body (e.g., as by a worker in an industrial setting). Scaling with respect to the corresponding, more-realistic full-scale system for a corresponding full-scale windspeed of 1.0 m/s was achieved by varying the inlet diameter, the windspeed and the sampling flowrate. The results for windspeeds in the scaled experiments of 1.5 m/s and lower were found to differ significantly from those for windspeeds of 2.0 m/s and higher. In particular, the measured aspiration efficiency values for the lower windspeeds were markedly higher than—and clearly not consistent with—the higher windspeed group of results. It is considered likely that such divergence may be associated with a characteristic of the small wind tunnel in which the experiments were conducted. However, the scaling laws developed were found to work well for windspeeds in the scaled experiments of 1.5 m/s and higher. The results confirm that the performance of the IOM personal inhalable aerosol sampler is in quite good general agreement with the inhalability criterion.
†Current affiliation: Alion Science & Technology, P.O. Box 12313, Research Triangle Park, NC 27709, USA.
1. INTRODUCTION
Aerosol samplers are important tools in the field of environmental and occupational health for the assessment of human exposure to aerosols. The scientific basis of exposure assessment is important in that it provides the basis for the setting of appropriate criteria for health-based aerosol standards. Aerosol sampling relates to the technical means by which a person's exposure to airborne particulates may be quantified, and involves extraction of a known volume of air and particles into a device so that the particles can be subsequently quantified by weighing, use of a direct-reading instrument, or some other means.
There has been much progress made in the last 20 years towards setting scientifically-based criteria for the measurement of exposure to aerosols by, for example, the International Standards Organisation (ISO), the American Conference of Governmental Industrial Hygienists (ACGIH), and the Comité Européen de Normalisation (CEN), as well as other national and international organizations. These organizations have recently moved towards international standardization of particle size-selective criteria for health-related aerosol sampling. They focus on the need for sampling to reflect the true nature of human exposure. First, they identify the inhalability of the human head (i.e., the inhalable fraction) as a function of particle size. This is the efficiency with which particles enter through the nose and/or mouth of exposed people during breathing. The thoracic and respirable fractions represent progressive penetration of particles down into the respiratory tract. All such fractions are important because they provide quantitative performance targets for aerosol samplers to be used for exposure assessment within the framework of exposure regulation. The coarser inhalable fraction is the one that is relevant to the present research. It is of special interest because it contains both the thoracic and respirable fractions (as subfractions), and also because it will apply to most standards relating to what has previously been referred to as “total aerosol” (which, as is now widely acknowledged, relates poorly to human exposure). However, the inhalable fraction is the most difficult to simulate because it is largely influenced by fluid and aerosol mechanical factors outside of the sampling body, most of which are uncontrollable and, in many cases, unknown.
Personal aerosol samplers, worn by individual aerosol-exposed individuals, provide the means to estimate the actual exposure of those individuals, provided of course that the sampler is chosen to accurately provide the particle size fraction of interest. Until recently, the only acceptable method for characterizing personal inhalable aerosol samplers has involved experiments in wind tunnels large enough to accommodate full-scale mannequins on which the samplers were mounted (e.g., CitationOgden and Birkett 1977; CitationOgden et al. 1977; CitationArmbruster and Breuer 1982; CitationVincent and Mark 1982; CitationKenny et al. 1997; CitationHinds and Kuo 1995). Typically, narrowly graded, nearly monodisperse aerosols were delivered to the working section of the tunnel and collected by the aerosol samplers of interest. But there are very few wind tunnels in existence that are properly equipped to carry out such experiments. Further, such experiments were very difficult to execute and time-consuming. Such factors have made the cost of full-scale aerosol sampler characterization very high, leading to the conclusion that—in the longer run—it is impractical for routine use in sampler development and testing. Instead, there is a need for an alternative approach that is less labor-intensive and time-consuming. Interest in this is reflected in the research that has been funded in recent years in both the European Community and the United States.
In the present work, we began from the position that, by performing such experiments in small wind tunnels, with due reference to appropriate physical scaling laws, not only would costs be greatly reduced but many more laboratories would be able to set up appropriately-equipped facilities. Even so, gravimetric tests with monodisperse test aerosols along the lines described are still time-consuming. This points, therefore, to the incorporation of a direct-reading instrument which counts and sizes sampled particles to allow for data to be collected simultaneously for many particle sizes and stored and analyzed digitally. Initial progress towards the development of a method of this type was first reported by CitationRamachandran et al. (1998). This paper describes further developments towards a practical method for carrying out such tests.
2. BACKGROUND
People are exposed to particles by inhalation when the particles are drawn into the nose and/or mouth by aspiration. This process is strongly influenced by the way in which airborne particles are carried by air in the vicinity of the individual. So the concentration of aerosol inhaled (or aspirated) may not be the same as that originally in the inhaled air volume. As already mentioned, occupational hygienists have long recognized that the only way to obtain a truly representative measure of an individual worker's aerosol exposure is to place a small sampling device very close to the ‘breathing zone’ of the worker (CitationWalton and Vincent 1998). In this way, the sampler—provided it exhibits the appropriate health-based particle size-selection characteristics—collects the same aerosol concentration as that experienced by the worker.
The inhalable aerosol fraction, expressing the probability that particles of a given size will enter through the nose and/or mouth during breathing, is expressed quantitatively by an empirical equation which relates inhalability (I) to particle aerodynamic diameter (d ae ), thus (CitationVincent 1999)
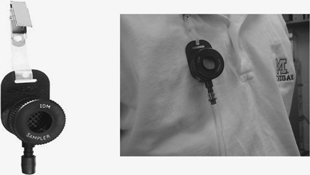
The Institute of Occupational Medicine (IOM) personal inhalable aerosol sampler (available commercially from SKC, Inc., Eighty-Four, PA) was the first personal sampler developed specifically to collect the inhalable fraction (see ). It comprises a removable filter cassette that has a 15-mm diameter sampling orifice which sits inside a 45-mm diameter sampling body. The required sampling flow rate is 2 L/min. This sampler is unique in that, in practical use, the entire cassette is evaluated in order to quantify all the aerosol that has passed through the sampler entry. This is in contrast to most other samplers where only the filter is assessed. Subsequent laboratory and field studies have confirmed that the IOM is indeed an effective inhalable aerosol sampler (CitationVaughan et al. 1990; CitationKenny et al. 1997; CitationBartley 1998).
FIG. 1 The IOM inhalable aerosol sampler.
In general, the aspiration efficiency of an aerosol sampler may be defined as A = c s < eqid7 > c 0, where c s is the concentration of particles passing directly through the plane of the sampling orifice and c 0 is that in the ambient air. This is the relevant index of performance for aerosol samplers, like the IOM sampler, for which the entire amount of aerosol that enters the plane of the sampling orifice is assessed. The challenge for aerosol scientists is to design a sampler so that, under conditions of practical use, A ≡ I as defined by Equation Equation1.
The same aerosol mechanics that govern the inhalation of particles also govern the entry of particles into sampling devices. Aspiration efficiency may generally be described as a function of several different dimensionless parameters relating to the movement of air and particles in the vicinity of the sampler, thus
Strict application of Equation (Equation2) severely constrains the practicability of scaling aerosol samplers along the lines described in the present research. But the removal of the need to scale with respect to Re f and Re p , as well as some of the other suggested dimensionless parameters, is very helpful. Importantly, for the full range of conditions pertaining to our experiments (i.e., U from 0.73 to 4.6 m/s and δ = 11 mm), Fr ranged from 4.9 to 200, indicating clearly that gravity was not a significant factor in our experiments. Now, therefore, for our experiments it is reasonable to assume that the problem may be reduced to
3. EXPERIMENTAL
The Method
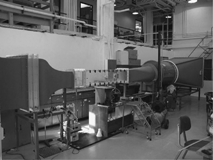
The experimental apparatus for the research described in this paper is essentially the same as that outlined in our earlier paper (CitationBrixey et al. 2002), and so will be summarized only briefly here. The primary equipment is the small open-loop wind tunnel shown in . It features a working cross-section of 0.30 m × 0.30 m, air movement driven by a tubular centrifugal fan located downstream of the working section, air entering the working section from an inlet plenum containing a HEPA filter bank, passage through a honeycomb screen and a contraction and, after passage through the working section, discharge through a diffuser and another HEPA filter bank. Test aerosols were generated from powdered materials using a mechanical aerosol generator (Topas GmbH, Dresden, Germany), and injected into the airflow just upwind of the working section, with dispersal aided by a 0.15 m × 0.15 m mixing plate and a square-lattice turbulence grid. The latter also served to establish consistent turbulence in the test section. The compressed air supply to the aerosol generator (1.2 bar) was sufficient to provide an agglomerate-free aerosol. As a further measure to aid dispersion, the test powders were stored in a heated oven prior to use and, during the experiments themselves, a 250 W spot lamp was used to gently heat the powder reservoir of the generator. Prior to beginning the experiments, aerosol samples were collected on glass slides placed in the working section of the wind tunnel during aerosol generation and inspected under a microscope to ensure that no agglomerates were present, as was indeed the case for all conditions studied. For most of the experiments described in this paper, the aerosols generated in this way were not neutralized. But a small number of experiments were carried out for aerosols reduced to close to Boltzmann equilibrium by passage through a Kr85 neutralizer (Model 3012, TSI Inc., St. Paul, MN).
FIG. 2 Photograph of the wind tunnel used for the research.
The central component of the system described by Brixey et al. was the direct-reading particle sizing and counting instrument that, for polydisperse test aerosols, allowed the acquisition of data simultaneously for a wide range of particle sizes within a single experimental run. For this purpose, we employed the Aerodynamic Particle Sizer (APS) (Models 3320/3321, TSI, Inc., St. Paul, MN). Initially, the earlier Model 3320 was used, but later experiments were conducted using the improved Model 3321, after it had been revealed that there were particle counting artifacts leading to some inaccuracies in the use of the Model 3320 for larger particle sizes (CitationArmendariz and Leith 2002; CitationStein et al. 2002) (see below). Data from the earlier runs which were obtained for conditions known to be associated with the artifacts in question were excised from what is presented in this paper. The raw particle counts from the APS were collected using Aerosol Instrument Manager software (Version 5.2, TSI, Inc., St. Paul, MN) on a laptop computer, with sample collection controlled automatically through the software.
For most of the experiments, polydisperse test aerosols were generated from powders of glass beads in which 80% of the mass comprised particles of diameter between 13 and 44 μ m (325 mesh, Class IV GL-0191, MO-SCI Corp., Rolla, MO). Using the Topas generator, the concentration of the delivered aerosol was constant over time to within ± 10%. The actual delivery rate was adjusted to provide aerosol concentration in the working section high enough to provide sufficient particle counts across the range of particle sizes of interest yet not so high as to cause coincidence counts in the APS. With this in mind, the overall particle count concentration at the APS was maintained within the desired range from 50 to 400 particles/cm3.
The experiments were based on the technical system described by Brixey et al., requiring measurement of the counts of particles of given aerodynamic diameter reaching the APS in each of two sampling lines, the first containing the reference sampler where the aspiration characteristics are known and the second containing the actual sampling system of interest where the aspiration characteristics are not known. The air volumetric flowrate was the same in each line. By repeated counts in each line, by switching backwards and forwards from one to the other, comparison of the counts obtained for each line provided information from which—ultimately—to determine the aspiration efficiency of the sampler of interest.
The practical implementation of the approach described was complicated by particle losses at the entries of both the reference and the test samplers associated with the coupling between the external wind tunnel flow and the internal flow inside the sampling line (e.g., as previously studied by CitationHangal and Willeke 1990; Sreenath et al. 2002). In any given experiment, the performance of the test sampler of interest would be bound up with those losses, along with particle losses elsewhere in the two sampling lines. These may be articulated by reference to . Here we may define E as the overall transmission efficiency of particles for passage from the wind tunnel test section, through the sampler, and to the APS, where they are measured. For this scenario
FIG. 3 Schematic representation of the sampling system to illustrate the basis of the determination of sampler aspiration efficiency; the sampler to the left is the reference sampler, the sampler to the right is the test sampler (i.e., the IOM sampler).
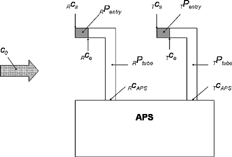
Aspiration efficiency for the test sampler may be determined from the measured T c APS and R c APS using Equation Equation7 if R A and the various penetrations are known. For the thin-walled reference probe, R A may be calculated for any set of conditions, isokinetic or anisokinetic from the model proposed by CitationPaik and Vincent (2002b). T P tube and R P tube may cancel if the practical realization of the system shown in pays due attention to the design to ensure exact symmetry between the two sampling lines. That leaves just T P entry and R P entry . This was resolved by the insertion of cylindrical plugs of porous plastic foam media into the entries of both the test and reference samplers. In principle, for such inserts, each of the penetrations could be calculated—if desired—using an empirical model that has been shown to be reliable for such purposes (Vincent et al. 2003). However, for the experiments reported in this paper, matters were simplified by designing the reference sampler to have the same entry dimensions and flowrate as the test sampler. Then the porous foam inserts could be made identical for each such that, in turn, the two penetration terms in Equation Equation7 should cancel. The porous plastic foam media used for this purpose were obtained commercially in 5-mm thick sheets with nominal 20 pores per inch (ppi) porosity (Foam Engineers Ltd., Buckinghamshire, UK). Cylindrical plugs were carefully cut from this sheet with diameter sufficient to ensure a snug fit in each of the sampler inlets. Prior to use, the foam plugs for both the reference and test samplers were immersed in a 10% mixture of petroleum jelly in xylene and dried to leave a uniform greased surface that would minimize any reentrainment of deposited particles. Preliminary experiments confirmed that greasing the foams in this way did indeed prevent such reentrainment. Following the procedure described in our earlier paper (CitationBrixey et al. 2002), each result presented in this paper is the average of 50 individual A-values derived from 10 replicate experimental runs in which each run produced five A-values. The porous foam plugs were replaced before each run. While a certain amount of variability might have been expected in the penetration efficiency of individual foam plugs, no significant bias was observed in the experimental results that might be associated with the specific properties of the individual foam plug samples used or with individual grease layers.
The Test Sampler Set-Up
The purpose of the experiments described in this paper was to examine whether a scaled version of the IOM sampler could be tested in our small wind tunnel and exhibit performance (in terms of aspiration efficiency) that matched that of the full-scale version tested under life-sized conditions (from the previously published results of CitationMark and Vincent 1986 and CitationKenny et al. 1997). Based on the preceding discussion about scaling laws, shows the experimental conditions for the full-scale experimental studies (subsets from the Mark and Vincent and the Kenny et al. data) alongside the corresponding scaled-down conditions that were applied in the experiments described here. Here, for scaling purposes, the width of the sampler body (D) was taken to be the width of the bluff body on which the sampler itself was mounted. So for the full-scale version D was the width of the body of the mannequin (approximately 300 mm), while for the small-scale version it was the width of a rectangular bluff body on which the sampler was mounted. For all the experiments involving the use of the rapid data acquisition system, the sampling set-up comprised an inlet of diameter δ = 11 mm centrally located on a bluff body of diameter D = 88 mm. In this system, the inlet took the form of a tube that projected out about 3 mm from the bluff body in order to reduce the possibility of secondary entry of particles after blow-off from external surfaces (CitationMark et al. 1982). For the experiments where the aspiration efficiency of the sampler was measured using more conventional gravimetric methods, a full-size IOM sampler (with δ = 15 mm) was placed on a bluff body with D = 120 mm (see ). As shown in , all experiments were scaled to correspond to the same dynamic conditions.
FIG. 4 Photograph of the experimental sampling system as set up for the gravimetric tests.
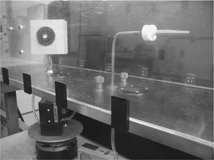
TABLE 1 Summary of experimental conditions for scaled IOM sampler experiments, in which δ = orifice diameter, D = bluff body width, U = freestream wind velocity, Q = sampling flow rate, k dae = scaling factor for particle size, k δ = scaling factor for inlet diameter, and k U = scaling factor for windspeed
In both the full-scale experiments of Mark and Vincent and of Kenny et al. the test sampler systems were rotated incrementally about the vertical axis in order to achieve orientation averaging. For the small-scale experiments described here, the test sampler system was rotated slowly and steadily at about 2 rpm. The only difference between the full-scale and small-scale experiments was the shape of the bluff body (where the size itself was also scaled). For all the earlier Mark and Vincent experiments, the sampler had been mounted on the lapel of a life-like mannequin; for the Kenny et al. data, some results had been obtained for the sampler mounted centrally on the torso of the mannequin. Since this is directly similar to the symmetrical configuration in our new scaled experiments, it is this subset that will be used here for comparison purposes.
Preliminary Experiments
Preliminary experiments were conducted to establish aspects of the experimental system where there were lingering questions of interest not only to the present study but also to aerosol scientists working in this field. One concerned the possible effect of particle charge on sampler aspiration efficiency, the other the possible effects of APS-related artifacts like those that have been reported by others. For the sake of economy, brief details only are given here; fuller information is available in CitationBrixey (2003).
Neutralization of the Test Aerosol
Experiments were conducted in which the primary difference was the use of the Kr85 neutralizer for conditioning the test aerosol. These involved measurements of the aspiration efficiency of the IOM sampler at two windspeeds, 2.9 and 4.6 m/s, both with and without using the neutralizer. The results showed that there was very little difference between the results for neutralized and non-neutralized aerosol respectively. Any differences were small and well within the variability we have come to expect for this type of experiment. It was concluded that neutralization of the test aerosol was not required for experiments of the type envisioned for this research. So the neutralizer was not used for the bulk of the experiments reported in this paper.
Comparison of Results Obtained with APS Models 3320 and 3321
Experiments were conducted for a limited set of conditions to compare aspiration efficiency results for experiments performed with the prototype test system using two different APS Models, the earlier 3320 and the more recent 3321. Two sets of experiments were performed in which the only difference was the model number of the APS employed, both involving the IOM sampler. Aspiration efficiency results, plotted in the form of A versus St, showed good agreement between the results for the two APS models for St up to about 0.4 (corresponding to d ae < 15 μ m). Beyond this range the data sets diverged, with measured aspiration efficiency for the Model 3320 clearly increasing while those for the Model 3321 tended to level out. The results for the older Model 3320 were consistent with the artifacts that have been reported by the others cited earlier. On this basis, all the results presented in this paper obtained using the Model 3320 exclude all those for the range of conditions where the artifacts were apparent.
4. RESULTS AND DISCUSSION
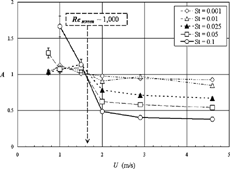
Results from the IOM sampler experiments using the prototype new, automated testing system are shown in . They represent individual full sets for conditions all scaled to be equivalent to a full-scale windspeed of 1 m/s, but for six actual windspeeds in the range from 0.73 to 4.6 m/s. The conditions for scaling between these sets of conditions are summarized in . The results for aspiration efficiency (A) are plotted against St, consistent with how the sampler scaling laws are expressed. From the earlier considerations of those scaling laws, it was expected that all six data sets presented in would follow the same trend and scale well together. But it is seen that there are two very distinct trends. For the three lower windspeeds, 0.73, 1 and 1.5 m/s, aspiration efficiency is seen to be close to unity for St up to about 0.03, from which point it increases beyond unity. But for the three higher windspeeds, 2, 2.9, and 4.6 m/s, aspiration efficiency shows a decreasing trend starting at about St = 0.01. This latter trend was as expected based on other published experimental data (CitationMark and Vincent 1986; CitationKenny et al. 1997). The higher-windspeed data therefore provide strong support for the scaling laws that have been proposed. But the lower-windspeed results were surprising, and so were explored further. With this in mind, the data were re-plotted in the form of aspiration efficiency (A) versus freestream windspeed (U) for a range of St (see ). Plotted in this way, a clear transition is seen for U in the range below about 1.5 m/s. We have therefore identified a range of experimental conditions in our system for which Equation Equation3 does not hold. Therefore, we return to Equation Equation2 to consider what may have been left out of the initial analysis. Gravitational settling is the first suspect since this clearly would come into effect at lower windspeeds. However the Fr-values calculated for the range of experimental conditions studied appear to rule out this possibility. Other candidates may be associated with what fluid dynamicists refer to as “Reynolds number effects.” In particular the possibility may be considered that the observed transition may be related to a transition in the characteristics of the flow outside the sampler, as represented by Re f . Re f -values relevant to the flow around the sampler bluff body for the freestream windspeeds studied ranged between approximately 4,600 and 28,500, compared to an equivalent Re f for full-scale experiments—for a sampler mounted on a 300 mm-wide mannequin—of 21,200. The observed transition in our new experimental results is seen to occur for U between about 1.5 and 2 m/s, corresponding to a Reynolds' number somewhere in the range from 9,400 and 12,700. This would appear to be high compared to that for relevant flow transitions (i.e., laminar to turbulent) noted elsewhere in experimental fluid mechanics (e.g., CitationSchlichting, 1979). Perhaps therefore the observed transition may have been associated with some other property of the flow in our experiments, perhaps the role of the freestream turbulence associated with the upstream turbulence screen. Here, for flow through the square-lattice grid, with its bar width of 8.5 mm, the appropriate Re-value for U in the range from 1.5 to 2 m/s lay between 890 and 1,200. This possibility seems more plausible. However, smoke tracer flow visualization studies of the flow through the screen failed to reveal any qualitative changes in the flow through the screen as the windspeed increased.
FIG. 5 Aspiration efficiency (A) of the IOM sampler as a function of Stokes number (St) for a range of windspeeds.
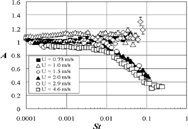
FIG. 6 Data from re-plotted in the form of A versus windspeed (U) for a range of Stokes numbers.
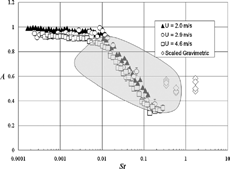
As already noted, the results for the higher freestream windspeeds of 2, 2.9, and 4.6 m/s, all scaled to simulate a full-size IOM sampler at a full-scale windspeed of 1 m/s, agree very well with one another. The data are also well-behaved, in that aspiration efficiency is close to unity for small St and then decreases with increasing St, leveling off at approximately 0.35 for St greater than about 0.1. shows the previously-published results for the full-scale version of the IOM sampler by CitationMark and Vincent (1986) and CitationKenny et al. (1997) based on gravimetric methods and for conditions equivalent (before scaling) to those shown in . The shaded area representing the envelope of these earlier experimental data is superimposed on the new data from the present work in . Here it is seen that agreement between the two families of data is generally quite good.
FIG. 7 Previously published experimental results for the aspiration efficiency (A) of the IOM sampler as a function of Stokes' number (St) for conditions equivalent to those (after scaling) studied in the present work; adapted from CitationMark and Vincent (1986) (+) and CitationKenny et al. (1997) (x).
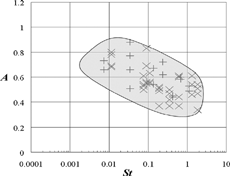
FIG. 8 Aspiration efficiency (A) of the IOM sampler as a function of Stokes number (St) for a range of windspeeds, from , shown alongside the envelope of the previously published data of CitationMark and Vincent (1986) and CitationKenny et al. (1997) (shaded area, taken from ); also shown are gravimetric data obtained using the set-up shown in for corresponding sets of conditions.
By careful application of the scaling laws, we were able to push the range of St up to about 0.2. But an ultimate limiting factor for application of our new rapid data acquisition system comes from the restricted accurate particle size range of the APS. To further extend the range of St for which aspiration efficiency could be measured, would have required experiments with ever-increasing windspeeds and sampling flow rates. But this was eventually limited due to the progressively smaller particle penetration efficiency for the porous foam media placed in the sampler inlets. Therefore, to assess the aspiration efficiency of the IOM sampler for larger St, we decided to extend the effective particle size range by performing additional experiments.
A supplementary set of tests was therefore performed using the gravimetric method that has been widely used by others and in our laboratory in other work (e.g., recently by CitationPaik and Vincent 2002a and b). In such work, nearly monodisperse test aerosols are collected by the sampler of interest and the reference sampler, and the collected particulate material is assessed by weighing. Again, the full details are widely available elsewhere. Aerosols were generated from narrowly-graded powders of fused alumina (“Duralum,” Washington Mills Electrominerals, Manchester, England). Using the same aerosol generator as for the rapid measurement experiments, test aerosols were produced of well defined mass median particle aerodynamic diameter and which could be considered to be essentially monodisperse (geometric standard deviation < 1.3) (CitationMark et al. 1985). A limited set of conditions was investigated, where the original full-scale IOM sampler was used (mounted on a bluff body with D = 120 mm), with scaling carried out only with respect to windspeed and sampling flowrate (see ). shows the results from this part of the experimental study, alongside the new data obtained using our rapid measurement system from . It is seen right away that the gravimetric studies allowed the range of St to be extended considerably. The results, where they overlap, are in very good agreement with those obtained at full scale by Mark and Vincent and by Kenny et al. They are in fair agreement with the trend exhibited by the ones obtained using our new prototype automated measurement system. However, in general, there is a rather obvious tendency for the data from the automated system to dip below the trend shown by the gravimetric results.
The latter tendency deserves additional comment. In other recent work (Brixey et al. 2004), we studied the aspiration efficiency of a thin-walled cylindrical sampling probe placed so that the plane of its inlet is at right angles to the freestream. In that work, an unexpected dependency was found on the ratio of the freestream air velocity to that in the plane of the sampling orifice. The observed trend was consistent with an explanation based on the fact that, for orientations away from the forward-facing and due to inertia of the air flow itself, the distribution of the air velocity across the plane of the sampler entry was not uniform. Rather, it was biased towards the downstream side of the inlet. This in turn was interpreted as a reduction in the effective area of the sampling inlet—or, conversely, an increase in the velocity at the entry. Such effects may be expected to be significant for samplers operated in their conventional modes, but would not be completely eliminated by the insertion of the porous plastic foam plugs (as was done also for the samplers studied in the present work). In relation to the present work this means that, in comparing samplers with and without the foam plugs (as in the experiments with the rapid data acquisition system and the gravimetric studies respectively), we are not quite comparing like with like. In particular, the higher effective velocity at the inlet, and hence through the foam plug, is expected to lead to increased particle collection in the foam media. In turn, in Equation Equation7, it is to be expected that T P entryT < R P entryR and not T P entryT = R P entryR as had originally been assumed. The result is that the measured aspiration efficiency of the test sampler will have been underestimated, especially for the larger particles. This indeed was what was observed. This explanation is physically plausible but, based on current knowledge, cannot be either verified or quantified. Nonetheless, it is a helpful contribution to interpreting the implications of the new knowledge gained in this work (see below).
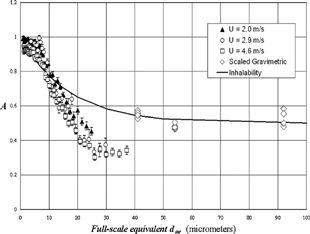
Finally, all the new IOM aspiration efficiency data are shown alongside the inhalability criterion in . This time, A is plotted directly as a function of equivalent full-scale particle aerodynamic diameter, consistent with the way in which the inhalability criterion is defined for standards-setting purposes (e.g., CitationVincent 1999). The latter was calculated by multiplying the actual particle aerodynamic diameter reported by the APS by the scaling factor, k dae , for each scaling scenario (see ). The overall conclusion is that the performance of the IOM sampler exhibits a quite good match with the inhalable aerosol fraction, especially for the gravimetric results, thus supporting the conclusions from the other work cited.
FIG. 9 Experimental data for aspiration efficiency (A) of the IOM personal sampler as a function of particle aerodynamic diameter (d ae ), shown alongside the inhalability curve (CitationVincent 1999).
5. CONCLUSIONS AND IMPLICATIONS
This research has applied new automated instrumentation for the rapid acquisition of aerosol sampler aspiration efficiency data to an extensive investigation of a range of IOM-like inhalable aerosol samplers. The study was carried out in a small wind tunnel, and the relation of the results to full-scale life-size personal aerosol sampling scenarios—like those encountered in occupational aerosol exposure assessment—was investigated by reference to the scaling laws that have been proposed based on familiar aerosol mechanics. In the small-scale experimental study, the IOM-like sampler was mounted centrally on a rectangular bluff body, and scaling with respect to the corresponding, more-realistic full-scale system was achieved by varying the inlet diameter, the windspeed and the sampling flowrate. In general, the scaling laws were found to work very well indeed across a wide range of conditions, provided that the windspeed in the wind tunnel used exceeded about 1.5 m/s. Based on these results, it is appropriate, in future applications of this particular experimental system, to ensure that experimental windspeeds exceed this value and to relate the results to full-scale systems for different windspeeds by appropriate application of the scaling laws by the adjustment of other variables.
Although the new data acquisition system provides results that are very consistent and confirm the general validity of the aerosol sampler scaling laws (within the constraints identified above), the actual data appear to fall progressively with increasing particle size below those from the more conventional gravimetric methods, as reported by other workers and also by ourselves as part of the present research. This suggests that, in each use of the new method, a small number of supplementary experiments should also be carried out using the gravimetric method. In addition to helping to identify the noted bias, this approach would also extend the range of simulated conditions to cover the full range of interest, especially with respect to particle size. This is exactly what was done in this work. Such an approach represents a considerable advance, in terms of potential savings of time and cost, over previous methods.
In summary, a new, more-economical method for the assessment of aerosol sampler performance has been described. By the means described, it is confirmed that the performance of the IOM personal inhalable aerosol sampler is in good agreement with the inhalability criterion.
Acknowledgments
The authors wish to thank the U.S. National Institute for Occupational Safety and Health for its support of this research through grant number RO1-OH02984-06.
Notes
†Current affiliation: Alion Science & Technology, P.O. Box 12313, Research Triangle Park, NC 27709, USA.
REFERENCES
- Armendariz , A. J. and Leith , D. 2002 . Concentration Measurement and Counting Efficiency for the Aerodynamic Particle Sizer 3320 . J. Aerosol Sci. , 33 : 133 – 148 . [CSA]
- Armbruster , L. and Breuer , H. 1982 . “ Investigations into Defining Inhalable Dust ” . In Inhaled Particles V , 21 – 31 . Oxford : Pergamon Press .
- Bartley , D. L. 1998 . Inhalable Aerosol Samplers . Applied Occupational and Environmental Hygiene , 13 : 274 – 278 . [CSA]
- Brixey , L. A. 2003 . The Development of a Rapid Testing Method for Personal Aerosol Samplers , Ph.D. Dissertation Ann Arbor, Michigan : University of Michigan .
- Brixey , L. A. , Paik , S. , Evans , D. E. and Vincent , J. H. 2002 . Experimental Studies to Develop New Aerosol Samplers and Methods for Their Evaluation . J. Environ. Monitoring , 4 : 633 – 641 . [CROSSREF] [CSA]
- Hangal , S. and Willeke , K. 1990 . Overall Efficiency of Tubular Inlets Sampling at 0-90 Degrees from Horizontal Aerosol Flows . Atmos. Environ. , 24A : 205 – 215 . [CSA]
- Hinds , W. C. and Kuo , T. -L. 1995 . A Low Velocity Wind Tunnel to Evaluate Inhalability and Sampler Performance for Large Dust Particles . Appl. Occupat. Environ. Hygiene , 10 : 549 – 556 . [CSA]
- Kenny , L. C. , Aitken , R. J. , Chalmers , C. , Fabries , J. F. , Gonzalez Fernandez , E. , Kromhout , H. , Liden , G. , Mark , D. , Riediger , G. and Prodi , V. 1997 . A Collaborative European Study of Personal Inhalable Aerosol Sampler Performance . Ann. Occupat. Hyg. , 41 : 135 – 153 . [CROSSREF] [CSA]
- Kenny , L. C. , Beaumont , G. , Gudmunssen , A. and Koch , W. 2000 . Small-Scale Aerosol Sampler Testing Systems . J. Aerosol Sci. , 31 : S406 – S407 . Suppl. 1[CROSSREF] [CSA]
- Mark , D. and Vincent , J. H. 1986 . A New Personal Sampler for Airborne Total Dust in Workplaces . Ann. Occupat. Hyg. , 30 : 89 – 102 . [CSA]
- Mark , D. , Vincent , J. H. and Witherspoon , W. A. 1982 . Particle Blow-Off: A Source of Error in Blunt Dust Samplers . Aerosol Sci. Technol. , 1 : 463 – 469 . [CSA]
- Mark , D. , Vincent , J. H. , Gibson , H. and Witherspoon , W. A. 1985 . Applications of Closely Graded Powders of Fused Alumina As Test Dusts for Aerosol Studies . J. Aerosol Sci. , 16 : 125 – 131 . [CROSSREF] [CSA]
- Ogden , T. L. and Birkett , J. L. 1977 . “ The Human Head As a Dust Sampler ” . In Inhaled Particles IV , 93 – 105 . Oxford : Pergamon Press .
- Ogden , T. L. , Birkett , J. L. and Gibson , H. 1977 . Imporvements to dust measurement techniques , IOM Report No. TM/77/11 Edinburgh, U.K. : Institute of Occupational Medicine .
- Paik , S. Y. and Vincent , J. H. 2002a . Aspiration efficiencies of disc-shaped blunt nozzles facing the wind, for coarse particles and high velocity ratios . J. Aerosol Sci. , 33 : 1509 – 1523 . [CROSSREF] [CSA]
- Paik , S. Y. and Vincent , J. H. 2002b . Aspiration Efficiency for Thin-Walled Nozzles Facing the Wind and for Very High Velocity Ratios . J. Aerosol Sci. , 33 : 705 – 720 . [CROSSREF] [CSA]
- Ramachandran , G. , Sreenath , A. and Vincent , J. H. 1998 . Towards a New Method for Experimental Determination of Aerosol Sampler Aspiration Efficiency in Small Wind Tunnels . J. Aerosol Sci. , 29 : 875 – 891 . [CROSSREF] [CSA]
- Schlichting , H. 1979 . Boundary Layer Theory, , 7th Edition , Berlin : Springer .
- Sreenath , A. , Ramachandran , G. and Vincent , J. H. 2001 . Experimental Study of Particle Losses Close to the Entry of Thin-Walled Sampling Probes at Varying Angles to the Wind . Aerosol Sci. Technol. , 35 : 767 – 778 . [CROSSREF] [CSA]
- Stein , S. W. , Gabrio , B. J. , Oberreit , D. , Hairston , P. , Myrdal , P. B. and Beck , T. J. 2002 . An Evaluation of Mass-Weighted Size Distribution Measurements with the Model 3320 Aerodynamic Particle Sizer . Aerosol Sci. and Technol. , 36 : 845 – 854 . [CROSSREF] [CSA]
- Tufto , P. A. and Willeke , K. 1982 . Dependence of Particulate Sampling Efficiency on Inlet Orientation and Flow Velocities . AIHA J. , 43 : 436 – 443 . [CROSSREF] [CSA]
- Vaughan , N. P. , Chalmers , C. P. and Botham , R. A. 1990 . Field Comparison of Personal Samplers for Inhalable Dust . Ann. Occupat. Hyg. , 34 : 553 – 573 . [CSA]
- Vincent , J. H. , ed. 1999 . Particle Size-Selective Sampling for Particulate Air Contaminants , Cincinnati, OH : ACGIH .
- Vincent , J. H. and Mark , D. 1982 . “ Applications of Blunt Sampler Theory to the Definition and Measurement of Inhalable Dust ” . In Inhaled Particles V , 3 – 19 . Oxford : Pergamon Press .
- Vincent , J. H. , Emmett , P. C. and Mark , D. 1985 . The Effects of Turbulence on the Entry of Airborne Particles into a Blunt Dust Sampler . Aerosol Sci. Technol. , 4 : 17 – 29 . [CSA]
- Vincent , J. H. , Aitken , R. J. and Mark , D. 1993 . Porous Plastic Foam Filtration Media: Penetration Characteristics and Applications in Particle Size-Selective Sampling . Journal of Aerosol Science , 24 : 929 – 944 . [CROSSREF] [CSA]
- Vincent , J. H. , Ramachandran , G. , Pui , D. Y. H. , Gomes , M. S. P. , Sato , S. and Sreenath , A. 1997 . “ Experimental Studies of Particle Transport in Air Flows Near Bluff Bodies With and Without Aspiration ” . In Proceedings of the 1997 ASME Fluids Engineering Division Summer Meeting (FESM'97) , American Society of Mechanical Engineers . Paper 3634 (CD-ROM)
- Walton , W. H. and Vincent , J. H. 1998 . Aerosol Instrumentation in Occupational Hygiene: An Historical Perspective . Aerosol Science and Technology , 28 : 417 – 438 . [CSA]