Daily mass concentrations of PM 1.0 (particles less than 1.0 μm in diameter), PM 2.5 (particles less than 2.5 μm in diameter), organic carbon (OC), and elemental carbon (EC) were measured from January through May 2004 at a heavily trafficked sampling site in Hong Kong (PU). The average concentrations for PM 1.0 and PM 2.5 were 35.9 ± 12.4 μ g cm − 3 and 52.3 ± 18.3 μ g cm − 3 . Carbonaceous aerosols were the dominant species in fine particles, accounting for ∼ 45.7% of PM 1.0 and ∼ 44.4% of PM 2.5 . During the study period, seven fine-particle episodes occurred, due to the influence of long-range transport of air masses from mainland China. PM 1.0 and PM 2.5 responded in similar ways; i.e., with elevated mass and OC concentrations in those episode days. During the sampling period, PM 1.0 OC and EC generally behaved similarly to the carbonaceous aerosols in PM 2.5 , regardless of seasonal variations and influence by regional pollutions. The low and relatively constant OC/EC ratios in PM 1.0 and PM 2.5 indicated that vehicular emissions were major sources of carbonaceous aerosols. PM 1.0 and PM 2.5 had the same dominant sources of vehicular emissions in winter, while in spring PM 2.5 was more influenced by PM 1 − 2.5 (particles 1–2.5 μ m in diameter) that did not form from vehicle exhausts. Therefore, PM 1.0 was a better indicator for vehicular emissions at the Roadside Station.
INTRODUCTION
In recent years, the problem of fine particles in urban areas has attracted increased concern, since the evidence from epidemiology and toxicology studies (CitationDockery et al. 1993; CitationSchwartz et al. 1996; CitationKatsouyanni et al. 2001) has suggested statistically significant association between morbidity and ambient fine-particle concentrations. Aerosol samples taken in urban areas show that motor vehicular emissions, especially diesel exhausts, usually constitute the most significant source of ultrafine (particle's aerodynamic diameter less than 0.1 μ m) and fine particles (PM2.5) in urban environments (CitationZhu et al. 2002; CitationShi et al. 2001; CitationCharron and Harrison 2003).
At present, Hong Kong Environmental Protection Department (HKEPD) recognizes that local, street-level pollution and the persistent regional smog problem are the most important air pollution issues for Hong Kong (http://www.epd.gov.hk/). Diesel vehicles are the main sources of street-level pollution. Smog, however, is caused by a combination of pollutants from motor vehicles, industry (e.g., power plants), vegetative burning and cooking, in both Hong Kong and the upwind area, the Pearl River Delta (PRD) regions.
Some consideration has been given in the United States to proposing that PM1.0 be an ambient standard. The advantage of a PM1.0 standard is not clear compared to the current PM2.5 standard, but proposing it as a standard raises the question of whether PM1.0 might provide better human health information than PM2.5. The answer is still controversial. Three different studies explored the relationship between PM1.0 and PM2.5 using MOUDI samplers in urban atmosphere in: Australia (CitationKeywood et al. 1999); Helsinki, Finland (CitationVallius et al. 2000); and the Pittsburgh Supersite, USA (CitationCabada et al. 2004). All three studies concluded that the majority of PM1.0 originated from the same sources as PM2.5, and measurement of PM1.0 did not yield significant new information to add to that obtained from the PM2.5 method. However, CitationLundgren et al. (1996), who conducted the sampling with a trichotomous sampler in Phoenix, Arizona, USA, claimed that PM1.0 was a better indicator for a roadside microenvironment than PM2.5, because, compared with PM2.5 and PM10, it minimized interference from natural sources.
Past studies of PM10 (particle's aerodynamic diameter less than 10 μ m) (CitationYu et al. 2004; CitationQin et al. 1997) and PM2.5 (CitationCao et al. 2003; CitationHo et al. 2003; CitationLouie et al. 2004; CitationLouie et al. 2005) have provided limited detailed information on the roadside and/or regional pollution in Hong Kong. Few studies have investigated PM1.0 in Hong Kong, which is the dominant proportion of particulate matter in vehicular exhausts and transported air masses. In this study, daily 24-hour measurements of PM1.0 and PM2.5 were determined near a major road from January 21 to May 31, 2004 with two-collocated Partisol-Plus Model 2025 sequential air samplers (Rupprecht and Patashnick Co. Inc., Albany, NY). The sampling period was divided up into winter (January 21–February 29) and spring (March 1–May 31). Study objectives were to: (1) determine the levels of fine particles (PM1.0 and PM2.5) and carbonaceous aerosols in a roadside microenvironment; and (2) explore the relationship of PM1.0 and PM2.5 in a roadside microenvironment in various conditions, such as different seasons, regional pollution episodes and non-regional pollution days. The results are presented in this paper as mean value ± standard deviation.
METHODOLOGY
Sampling Site
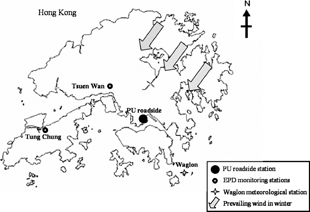
PM1.0 and PM2.5 samples were collected at the PU Roadside Station air-quality monitoring site on the campus of the Hong Kong Polytechnic University (PU) (), which is located near Victoria Harbor. PU Roadside Station is in a residential and commercial area about 1–2 meters from the curb along Hong Chong Road, which leads to the Cross Harbor Tunnel. With four lanes in each direction, Hong Chong Road is one of the busiest cross-harbor roads in Hong Kong. Traffic flow is extremely high, with about 120,974 cars per day in both directions during sampling period (source: 2004 Annual Traffic Census in Hong Kong).
FIG. 1 Sampling locations for the Hong Kong Polytechnic University (PU) vehicle emissions dominated roadside station, two monitoring stations of Environmental Protection Department (EPD), and one meteorological station.
Sample Collection
Daily PM1.0 and PM2.5 samples were acquired with two-collocated Partisol-Plus Model 2025 Sequential Air Sampler operated at 16.7 l min−1. The particles were collected on 47 mm quartz fiber filters (QMA, Whatman International Ltd., Maidstone, England). They were weighed twice before and after sampling, using a Microbalance (Model MC5, Sartorius AG, Goettingen, Germany) with the sensitivity of ± 1 μ g in the 0–250 mg range. Before weighing, the samples were equilibrated in a desiccator at 20–30°C and a relative humidity of 30–40% for 24 hours. Field blank filters were collected to reduce gravimetric bias due to filter handling during and/or after sampling. CitationLouie et al. (2005) reported a 1:1 relationship based on a gravimetric analysis of collocated Teflon-membrane and quartz-fiber filters performed during a year-long sampling study in Hong Kong with the same instruments with this study. Similar results were also found for a study done in South Africa by CitationEngelbrecht et al. (2001). However, large uncertainties were found to associate with the weighing of quartz-fiber filters by other studies. For example, CitationHitzenberger et al. (2004) reported ∼ 38% higher concentrations with quartz fiber filters than the average of other methods. Therefore the mass concentrations in the present study maybe have uncertainty although the filters were handled very carefully during the study.
Before sampling, quartz fiber filters were preheated in an electric furnace at 900°C for at least three hours in order to remove carbonaceous contaminants. The filters were handled only with tweezers cleaned with dry KimWipes (Kimberly-Clark Corporation, USA) to reduce the possibility of contamination. After weighing, samples were stored in a refrigerator at about 4°C before chemical analysis to prevent the evaporation of volatile components.
Analysis of Organic and Elemental Carbon
The samples were analyzed for OC and EC using a Desert Research Institute (DRI) Model 2001 Thermal/Optical Carbon Analyzer (AtmAA Inc, Calabasas, CA, USA) with the IMPROVE thermal/optical reflectance (TOR) protocol (CitationChow et al. 1993). The DRI Model 2001 carbon analyzer (CitationChow et al. 2004) is based on the preferential oxidation of OC and EC compounds at different temperatures. It relies on the fact that OC is volatilized from the sample deposit in a helium (He) atmosphere at low temperatures, while EC is not consumed. The TOR protocol heats the sample (0.526 cm2 per punch) stepwise at temperatures of 120°C (OC1), 250°C (OC2), 450°C (OC3), and 550°C (OC4) in a non-oxidizing He atmosphere, and 550°C (EC1), 700°C (EC2), and 800°C (EC3) in an oxidizing atmosphere with 2% oxygen (O2) in He. The evolved carbon is oxidized into carbon oxide (CO2) and then reduced to methane (CH4) for quantification with a flame ionization detector (FID). The pyrolysis of OC is continuously monitored by a Helium-neon (He-Ne) laser at a wavelength of 632.8 nm. OC is defined as the portion of carbon evolved before the temperature at which the filter reflectance resumes the initial level. The carbon evolved beyond this temperature is defined as EC. The minimum detection limit (MDL) of carbon combustion methods is 0.82 μ g C cm−2 for OC, 0.19 μ g C cm−2 for EC, and 0.93 μ g C cm−2 for total carbon (TC, sum of OC and EC). All samples in this study have concentrations higher than MDL. Replicated analyses were performed for ∼ 10% of all samples. Also, field blank filters were collected to provide information about contaminants that may be introduced during sample collection, storage, and transport.
The sampling with quartz filters is prone to positive and negative artifacts that result in erroneous measurements of particulate organic carbon (CitationTurpin et al. 1994; CitationKim et al. 2001; CitationWatson and Chow 2002; CitationSubramanian et al. 2004). The OC artifacts are not determined in the present study since the instrument is not suitable for this measurement. Positive 24-hour OC artifacts were estimated at the same sampling location using one URG sampler (URG-3000ABC, Chapel Hill, USA) in winter (December 2004–January 2005) and summer (July 2005–September 2005). The URG sampler is able to collect PM1.0 and PM2.5 simultaneously. The positive OC artifacts were estimated with a backup quartz filter placed behind the main quartz filter because the quartz behind quartz (QBQ) approach provides a reasonable estimate of the positive artifacts on the bare quartz filter for the 24-hour samples (CitationSubramanian et al. 2004). The positive OC artifacts (QBQ) in winter were found to be almost consistent for PM1.0 and PM2.5, 1.8 ± 0.5 μ g C m−3 and 1.9 ± 0.5 μ g C m−3, respectively. In summer, the OC artifacts were 1.5 ± 0.3 μ g C m− 3 for PM1.0 and 1.6 ± 0.4 μ g C m−3 for PM2.5. Negative artifacts due to volatilization of particle-phase organics from the particle sample were not quantified, because of limited resources.
EPD PM2.5 Monitoring Station
Tsuen Wan and Tung Chung are typical urban, ambient monitoring stations () operated by HKEPD. PM2.5 data measured at these two stations were used to evaluate the relationship of fine particles among different locations, such as ambient and roadside site. Equipment at these sampling sites had adequate exposure, with monitoring probes placed 17 and 21 m above ground level, located on rooftops of buildings. Road dust from nearby streets does not contribute appreciably at this elevation (CitationLouie et al. 2002).
Hourly PM2.5 mass at Tsuen Wan and Tung Chung stations was measured with the Series 1400a PM2.5 Tapered Element Oscillating Microbalance monitor (TEOM, Rupprecht & Patashnick Co., Inc., Albany, NY, USA), which is a true “gravimetric” instrument that continuously weighs the Teflon-coated borosilicate glass filter, and calculates near real-time PM2.5 mass concentrations. The sample stream is preheated to 50°C before entering the mass transducer to eliminate the necessity for humidity equilibration for the hydrophobic filter.
Meteorological Parameters during Sampling Periods
Hong Kong's climate is sub-tropical with four seasons and influenced by the Asian monsoon. In summer, the prevailing wind is southerly, bringing to Hong Kong clean marine air masses. In winter, continental emissions from interior Asia intrude into Hong Kong and the South China Sea, accompanying a prevailing northeasterly wind. Therefore, Hong Kong's air quality during winter is influenced by local and regional sources. Spring and autumn are transit seasons.
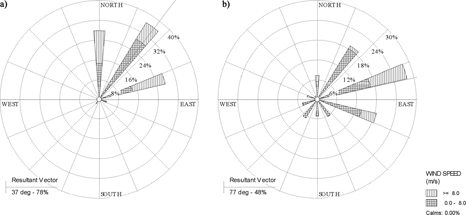
Throughout the sampling periods, the mean air pressure, temperature, and relative humidity did not vary significantly. During wintertime, the prevailing surface wind direction was northeasterly with ∼ 82% of hourly winds from the resultant vector of 38°, as shown in a. This means that nearly all winter winds traveled over China's continental land mass before reaching Hong Kong. During springtime, however, the mean directions of hourly surface winds varied in all vectors, as displayed in b. The resultant vector is 77°, accounting for ∼ 48% of wind distribution. Wind from the south (90°–270°) was ∼ 38% of distribution. Wind-rose analysis suggests that the air masses arriving at Hong Kong in spring were not only from the continent, but sometimes also from the South China Sea. The above weather parameters were measured at Waglon Meteorological Station (22.18°N, 114.30°E) of Hong Kong Observation, which is located on Waglon Island in an open landscape ().
FIG. 2 Frequency distribution of surface wind in winter (a) and in spring (b).
DISCUSSION
Concentrations of Mass, Organic Carbon, and Elemental Carbon
summarizes the PM2.5 mass and carbon concentrations. On average, the mass concentrations of PM1.0 and particulate at PU Roadside Station for all 132 sampling days were 35.9 ± 12.4 μ g m−3 and 52.3 ± 18.3 μ g m−3, respectively. The range of particle concentrations varied significantly, from 17.5 μ g m−3 to 85.0 μg m−3 for PM1.0 and from 24.3 μ g m−3to 111.4 μ g m−3 for PM2.5, respectively. Overall PM1.0 consisted of ∼ 19.4% of OC and ∼ 26.4% of EC, and for PM2.5, ∼ 21.1% of OC and ∼ 23.4% of EC. The average OC/EC ratio was 0.8 and 1.0 for PM1.0 and PM2.5, respectively.
TABLE 1 Seasonal average of PM1.0 and PM2.5 mass and carbonaceous aerosols at PU Roadside Station
lists OC and EC levels from several past studies. Since there is no international uniform analysis method, different thermal methods were used in some studies, which might result in large variations in OC and EC measurements. CitationLi and Lin (2002) measured the carbon concentrations in PM1.0 via a combustion technique in Taipei, Taiwan during October of 1999. The average OC/EC ratio of 1 at that traffic site in Taipei was similar to averages in this study, but generally, average OC/EC ratio in urban ambient atmospheres in Taipei is higher than roadside ratios in Taipei and in this study. For PM2.5, EC measured at the PU Roadside site exceeded the average PM2.5 EC concentration found in a previous study (CitationCao et al. 2003) by a factor of ∼ 1.0. This is due to the different distances the sampler was placed from the road in each study, about 1–2 meters for this study and more than 30 meters for the study of CitationCao et al. (2003). CitationZhu et al. (2002) observed a dramatic decrease in concentrations of ultrafine particles and BC near the 710 freeway in Los Angeles, California, USA when the sampler was moved from 4 meters to 17 meters away from curbside. This suggests that the increased EC levels in this study were mainly attributed to the sampler being much closer to road. also shows the PM2.5 OC/EC results for other sites where the TOR method was used to conduct OC/EC analyses. Generally, the carbonaceous aerosols (TC) in PRD region, including Guangzhou (GZ), Shenzhen (SZ), Zhuhai (ZH) (CitationCao et al. 2003) and Hong Kong (CitationLouie et al. 2004), were higher than Chongju, Korea (CitationLee et al. 2001). High OC concentrations, observed in the urban atmosphere of GZ, SZ, and ZH in China, formed potential contamination sources for Hong Kong during the prevailing Asian monsoon (winter). In Hong Kong, the rural OC/EC ratio was similar to other cities in the PRD region (CitationCao et al. 2003), followed by urban and roadside ratios.
TABLE 2 Levels of carbonaceous aerosols in urban atmosphere in Asia
OC concentrations in PM1.0 and PM2.5 at PU Roadside Station showed a clear, seasonal pattern (p-value < 0.05 for both of PM1.0 and PM2.5, two-tailed t-test) with ∼ 30% higher concentrations in winter than spring (). Regional or long-range transport of continental aerosols was believed to be the dominating factor leading to higher OC levels in Hong Kong during winter because vehicles emissions would not have significant day-to-day variations due to the consistent traffic flow in each day (2004 Annual Traffic Census). Several pollutants in the Hong Kong atmosphere have been affected by long-range transport of continental aerosols, which lead to higher pollution levels in winter; more than other seasons (CitationPathak et al. 2003; CitationLouie et al. 2005; CitationYu et al. 2004). Most of these pollutants are secondary aerosols, such as OC (CitationLouie et al. 2005; CitationYu et al. 2004), and sulphate and ammonium (CitationPathak et al. 2003), that were thought to be produced by gas-to-particle conversion, or chemical reaction, during transport. In a study done by CitationPathak et al. (2003), continental long-range transport of aerosols was found to increase sulfate and ammonium concentrations in Hong Kong's air by 49% to 383%, and 33% to 302%, in 2000–2001.
EC originates from relatively simple sources and does not form in atmosphere due to its nearly inert property (CitationOgren and Charlson 1983). It mainly originates from incomplete combustion of carbon-containing material (CitationOgren and Charlson 1983). In this study, EC seems controlled by local sources, such as vehicular exhausts, that continuously emit EC into the atmosphere. This results in weak seasonal variations, as seen in . Besides vehicular emissions, CitationYu et al. (2004) found that ship emissions at Hong Kong's container port were also important contributors to EC loadings. In this study, the PU roadside station was upwind of the nearby port (Victoria Harbor) in winter, so the effects from ship emissions were limited. In spring, however, according to CitationYu et al. (2004), the PU Roadside might have received the plume from ship emissions when the wind direction was from the south. CitationYu et al. (2004) claimed that EC seasonality in Hong Kong was more dependent upon the distance from, and relative location to, the city's container port.
Regional Pollution Episodes
As showed in , time series of PM1.0 exhibited seven episode days, January 30, February 14–15, February 23, February 26, April 19–20, respectively, during which PM1.0 exceeded the average concentration by a factor of two. It was found that the PM occurring during episode days differed statistically from non-episode days (p-values < 0.05, t-test). Concurrent peaks for PM2.5 were also found at PU Roadside Station and urban ambient monitoring stations (Tung Chung and Tsuen Wan). For instance, the average PM2.5 loading during the episodes at Tsuen Wan exceeded the average level throughout the study period by a factor of 2.4.
FIG. 3 Daily 24-h PM1.0, PM2.5, PM1.0 OC, PM1.0 EC concentrations, and OC/mass, EC/mass, OC/EC ratios in PM1.0 at PU roadside during January to May 2004.
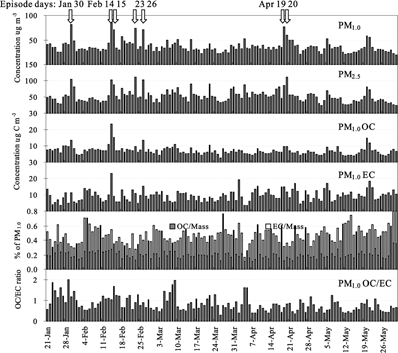
Five-day back trajectories were conducted for those episode days using a HYSPLIT model (CitationDraxler and Hess 1997). All of the air masses during episode days originated from north China, traveling across southeastern China along the coastline before reaching Hong Kong and bringing aged, polluted aerosols. Similar pollution episodes have been found in prior studies (CitationYu et al. 2004; CitationLouie et al. 2005).
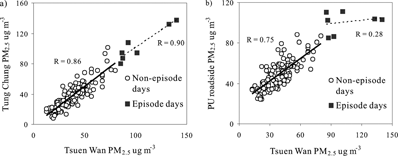
Regression analysis in a shows that PM2.5 collected at Tsuen Wan and Tung Chung generally had good relationship with a correlation coefficient (R) equal to 0.86 in non-episode days, and 0.90 during episode days. This indicates that they are controlled by similar urban- and regional-scale sources, including remote sources. The particulate spatial distribution tended to be more even in the ambient atmosphere, due to the effects of remote sources. As seen in b, PU Roadside PM2.5 moderately correlated with PM2.5 at Tsuen Wan in non-episode days (R = 0.75), implying that vehicular emissions, as an urban plume, had contributed to urban ambient PM2.5 during non-episode days. Poor relationship (R = 0.28) was found during episode days, which suggests that particles at PU Roadside were comprised from sources that do not contribute much to urban atmosphere. Most likely, nearby vehicular emissions were those sources.
FIG. 4 Correlations of PM2.5 mass between Tsuen Wan and Tung Chung (a) as well as Tsuen Wan and PU Roadside Station (b) during January to May 2004.
Occurrence of episodes in Hong Kong during winter was found to associate with a mesoscale subsiding airstream with a moderate to stagnant easterly transport (CitationLouie et al. 2005). In this study, the average mixing height during episode days was 666 m, much lower than average mixing height during the non-episode periods (936 m). This indicated poor dispersion conditions when the episodes occurred. Thus, the elevated concentrations of pollutants observed at PU during episode days were attributed to the combination of stagnant vehicular emissions from the nearby road, and subsiding continental aerosols from long-range transport.
shows concentrations of carbonaceous aerosols for each episode day. Carbonaceous aerosols on 14 February were found to be much higher than on other episode days (), comprised of ∼ 67.4% of PM1.0 and ∼ 54.3% of PM2.5. The sample may have been contaminated from a heavy-duty truck that occasionally idled near the sampling location during sampling period. Therefore, the calculation of average values for episode days excludes the data from 14 February.
TABLE 3 Summary statistics for the concentrations of PM, carbonaceous aerosols, and ratios during episode days in 2004
On episode days, the average OC concentration in PM1.0 and PM2.5 increased ∼ 70% and ∼ 100%, respectively, compared to average values. EC showed only a 20–30% increase. The fact that higher concentrations of OC occurred during episode days confirmed our previous assumption that the seasonal pattern of high concentration in winter and low concentration in spring was attributed to the long-range transport of continental aerosols. During episode days, total carbonaceous aerosols (TC = OC + EC) accounted for ∼ 33.4% and ∼ 37.3% of PM1.0 and PM2.5, respectively (), which were lower than average contributions in sampling period, ∼ 45.7% and ∼ 44.4% of TC in PM1.0 and PM2.5, respectively. All of this shows that particles at PU Roadside were influenced by remote sources that had chemical compositions other than those from primary vehicle emissions. Further study should be conducted on the chemical characterization on episode days in the future in order to evaluate the influence of long-range transport of continental aerosols on Hong Kong.
Relationships between PM1.0 and PM2.5
Particles with different size fractions possibly differ not only in size and morphology, but also in: formation mechanisms; sources; and, chemical and physical properties. In this study, regression analysis was used to evaluate the relationships between PM1.0 and PM2.5 (), which is the most common method used in earlier studies (CitationKeywood et al. 1999; CitationVallius et al. 2000; CitationCabada et al. 2004). The data derived on episode days was highlighted to differentiate from non-episode days ( and ).
FIG. 5 Correlations between PM1.0 and PM2.5 for mass (a), OC (b), and EC (c) (Standard error is in the bracket).
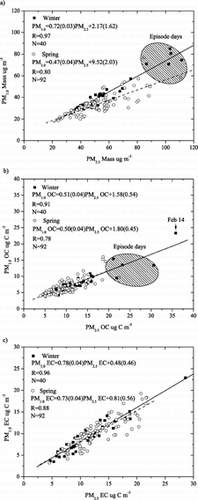
As shown in and , the behavior of carbonaceous aerosols (OC and EC) in PM1.0 generally followed those in PM2.5 whether it was winter or spring. Meanwhile, the OC/EC ratios were low and relatively constant for both PM1.0 and PM2.5, averaging 0.8 ± 0.4 for PM1.0 and 1.0 ± 0.4 for PM2.5. This suggests that nearby vehicular emissions were the major sources for carbonaceous aerosols.
As illustrated in a, PM1.0 and PM2.5 were highly correlated in winter regardless of episodes, with a correlation coefficient of 0.97 indicating they were controlled by similar sources; most likely vehicular emissions, in this case. In contrast, the trend of regression fitting curve in spring did not follow that in winter. The contribution of PM1 −2.5 to PM2.5 seemed to have increased, especially for high concentrations. The correlation coefficient between PM1−2.5 and PM2.5 also increased from 0.85 in winter to 0.91 in spring. Furthermore, the difference resulted mainly from non-carbonaceous aerosols, indicating the contribution of non-vehicular emissions. Thus PM1.0 seems to be a better indicator for vehicular emissions at the PU Roadside microenvironment than PM2.5, because, compared PM2.5, it was not as greatly influenced by non-vehicle sources.
CONCLUSION
Aerosol fine-particle samples (PM1.0 and PM2.5) were collected daily during winter and spring along the heavily trafficked Chong Hong Road in Hong Kong (PU Roadside Station), for nearly five months. An integrated data set, including aerosol mass and concentrations of carbonaceous aerosols associated with episode and non-episode days, has been obtained. The information obtained is especially important for helping to enhance the current understanding of two important air pollution problems confronting Hong Kong—local street pollution and regional smog pollution.
PM1.0 and PM2.5 measurements at PU Roadside showed that carbonaceous aerosols were major components in fine particles, constituting ∼ 45.7% of PM1.0 and ∼ 44.4% of PM2.5. Particle mass and OC showed higher concentrations in winter than spring, due to the contribution of continental aerosol pollutants brought in by long-range transport.
Seven fine particle episodes occurred during the study period. At PU Roadside Station, PM1.0 and PM2.5 responded in similar ways during these episode days, with elevated mass and OC concentrations. The contribution of carbonaceous aerosols to particulate mass was lower during episode days than non-episode days.
Regression analysis shows that PM1.0 OC and EC generally behaved similarly to PM2.5. Vehicular emissions were a major source of both, although OC concentration increased during winter due to influences from remote sources. During winter, PM1.0 and PM2.5 originated from the same major sources (vehicular emissions) regardless of episodes, while PM2.5 was more influenced by PM1−2.5 that obviously did not form from vehicular emissions. PM1.0, therefore, was a better indicator for vehicular emissions at PU Roadside Station.
Acknowledgments
Received 16 March 2005; accepted 28 November 2005. This project is supported by the Research Grants Council of Hong Kong (PolyU5145/03E), G-T 216, and Area of Strategic Development on Atmospheric and Urban Air Pollution (A516) funded by the Hong Kong Polytechnic University. The authors are grateful to Hong Kong Environmental Protection Department (HKEPD) for provision of the data sets and permission for publication. The content of this paper does not necessarily reflect the views and policies of the HKSAR Government, nor does mention of trade names or commercial products constitute endorsement or recommendation of use.
Notes
a 1–2 m away from the major road
b more than 30 m away from the major road.
a The sample might be contaminated.
Related Research Data
REFERENCES
- Cabada , J. C. , Rees , S. , Takahama , S. , Khlystov , A. , Pandis , S. N. , Davidson , C. I. and Robinson , A. L. 2004 . Mass Size Distributions and Size Resolved Chemical Composition of Fine Particulate Matter at the Pittsburgh Supersite . Atmos. Env. , 38 : 3127 – 3141 . [CSA]
- Cao , J. J. , Lee , S. C. , Ho , K. F. , Zhang , X. Y. , Zou , S. C. , Fung , K. , Chow , J. C. and Watson , J. G. 2003 . Characteristics of Carbonaceous Aerosol in the Pearl River Delta Region, China during 2001 Winter Period . Atmos. Env. , 37 : 1451 – 1460 . [CROSSREF] [CSA]
- Charron , A. and Harrison , R. M. 2003 . Primary Particle Formation from Vehicle Emissions during Exhaust Dilution in the Roadside Atmosphere . Atmos. Env. , 37 ( 29 ) : 4109 – 4119 . [CROSSREF] [CSA]
- Chow , J. C. , Watson , J. G. , Chen , L. W. A. , Arnott , W. P. , Moosmüller , H. and Fung , K. 2004 . Equivalence of Elemental Carbon by Thermal/Optical Reflectance and Transmittance with Different Temperature Protocols . Environ. Sci. and Technol. , 38 ( 16 ) : 4414 – 4422 . [CROSSREF] [CSA]
- Chow , J. C. , Watson , J. G. , Pritchett , L. C. , Pierson , W. R. , Frazier , C. A. and Purcell , R. G. 1993 . The DRI Thermal/Optical Reflectance Carbon Analysis System: Description, Evaluation and Applications in U.S. Air Quality Studies . Atmos. Env. , 27A ( 8 ) : 1185 – 1201 . [CSA]
- Dockery , D. W. , Arden , P. C. , Xu , X. P. , Spengler , J. D. , Ware , J. H. , Fay , M. E. , Ferris , B. G. and Speizer , F. E. 1993 . An Association between Air Pollution and Mortality in Six U.S. Cities . N. Engl. J. Med. , 329 ( 24 ) : 1753 – 1759 . [INFOTRIEVE] [CROSSREF] [CSA]
- Draxler , R. R. and Hess , G. D. 1997 . “ Description of the HYSPLIT_4 Modeling System ” . In Report No. NOAA Technical Memorandum ERL ARL-224 , Silver Spring, MD : National Oceanic and Atmospheric Administration, Air Resources Laboratory . http://www.arl.noaa.gov/data/models/hysplit4/win95/arl-224.phf
- Engelbrecht , J. P. , Swanepoel , L. , Chow , J. C. , Watson , J. G. and Egami , R. T. 2001 . PM2.5 and PM10 Concentrations from the Qalabotjha Low-Smoke Fuels Macro-Scale Experiment in South Africa . Environmental Monitoring and Assessment , 69 ( 1 ) : 1 – 15 . [INFOTRIEVE] [CROSSREF] [CSA]
- Hitzenberger , R. , Berner , A. , Galambos , Z. , Maenhaut , W. , Cafmeyer , J. , Schwarz , J. , Muller , K. , Spindler , G. , Wieprecht , W. , Acker , K. , Hillamo , R. and Makela , T. 2004 . Intercomparison of Methods to Measure the Mass Concentration of the Atmospheric Aerosol During INTERCOMP2000—Influence of Instrumentation and Size Cuts. . Atmos. Env. , 38 : 6467 – 6476 . [CROSSREF] [CSA]
- Ho , K. F. , Lee , S. C. , Chan , C. K. , Yu , J. C. , Chow , J. C. and Yao , X. H. 2003 . Characterization of Chemical Species in PM2.5 and PM 10 Aerosols in Hong Kong . Atmos. Env. , 37 : 31 – 39 . [CROSSREF] [CSA]
- Katsouyanni , K. , Touloumi , G. , Samoli , E. , Gryparis , A. , Le Tertre , A. , Monopolis , Y. , Rossi , G. , Zmirou , D. , Ballester , F. , Boumghar , A. , Anderson , H. R. , Wojtyniak , B. , Paldy , A. , Braunstein , R. , Pekkanen , J. , Schindler , C. and Schwartz , J. 2001 . Confounding and Effect Modification in the Short-Term Effects of Ambient Particles on Total Mortality: Results from 29 European Cities within the APHEA2 Project . Epidemiology , 12 ( 5 ) : 521 – 531 . [INFOTRIEVE] [CROSSREF] [CSA]
- Keywood , M. D. , Ayers , G. P. , Gras , J. L. , Gillett , R. W. and Cohen , D. D. 1999 . Relationships between Size Segregated Mass Concentration Data and Ultrafine Particle Number Concentrations in Urban Areas . Atmos. Env. , 33 : 2907 – 2913 . [CROSSREF] [CSA]
- Kim , B. M. , Cassmassi , J. , Hogo , H. and Zeldin , M. D. 2001 . Positive Organic Carbon Artifacts on Filter Medium during PM2.5 Sampling in the South Coast Air Basin . Aerosol Sci. Technol. , 34 ( 1 ) : 35 – 41 . [CSA]
- Lee , H. S. and Kang , B. W. 2001 . Chemical Characteristics of Principal PM2.5 Species in Chongju, South Korea . Atmos. Env. , 35 : 739 – 746 . [CROSSREF] [CSA]
- Li , C. S. and Lin , C. H. 2002 . PM1/PM2.5/PM10 Characteristics in the Urban Atmosphere of Taipei . Aerosol Sci. Technol. , 36 ( 4 ) : 469 – 473 . [CROSSREF] [CSA]
- Louie , P. K. K. , Leung , G. S. P. , Yeung , B. T. W. , Sin , D. W. M. , Yu , J. Z. , Lau , A. , Bergin , M. , Zheng , M. , Chow , J. C. and Watson , J. G. 2002 . Twelve-month Particulate Matter Study in Hong Kong: Final Report to Hong Kong Environmental Protection Department
- Louie , P. K. K. , Watson , J. G. , Chow , J. C. , Chen , A. , Sin , D. W. M. and Lau , A. K. H. 2005 . Seasonal Characteristics and Regional Transport of PM2.5 in Hong Kong . Atmos. Env. , 39 ( 9 ) : 1695 – 1710 . [CSA]
- Louie , P. K. K. , Chow , J. C. , Chen , L.-W. A. , Watson , J. G. , Leung , G. and Sin , D. W. M. 2004 . PM2.5 Chemical Composition in Hong Kong: Urban and Regional Variations . Sci. Total Environ. , 338 ( 3 ) : 267 – 281 . [CSA]
- Lundgren , D. A. , Hlaing , D. N. , Rich , T. A. and Marple , V. A. 1996 . PM10/PM2.5/PM1 Data from a Trichotomous Sampler . Aerosol Sci. Technol. , 25 : 353 – 357 . [CSA]
- Ogren , J. A. and Charlson , R. J. 1983 . Elemental Carbon in the Atmosphere: Cycle and Lifetime . Tellus , 35B : 241 – 254 . [CSA]
- Pathak , R. K. , Yao , X. H. , Lau , A. K. H. and Chan , C. K. 2003 . Acidity and Concentrations of Ionic Species of PM2.5 in Hong Kong . Atmos. Env. , 37 ( 8 ) : 1113 – 1124 . [CROSSREF] [CSA]
- Qin , Y. , Chan , C. K. and Chan , L. Y. 1997 . Characteristics of Chemical Compositions of Atmospheric Aerosols in Hong Kong: Spatial and Seasonal Distributions . Sci. Total Environ. , 206 : 25 – 37 . [CROSSREF] [CSA]
- Schwartz , J. , Dockery , D. W. and Neas , L. M. 1996 . Is Daily Mortality Associated Specifically with Fine Particles? . J. Air & Waste Manage. Assoc. , 46 : 927 – 939 . [CSA]
- Shi , J. P. , Evans , D. E. , Khan , A. A. and Harrison , R. M. 2001 . Source and Concentration of Nanoparticles (< 10 nm diameter) in the Urban Atmosphere . Atmos. Env. , 35 : 1193 – 1202 . [CROSSREF] [CSA]
- Subramanian , R. , Khlystov , A. Y. , Cabada , J. C. and Robinson , A. L. 2004 . Positive and Negative Artifacts in Particulate Organic Carbon Measurements with Denuded and Undenuded Sampler Configurations . Aerosol Sci. Technol. , 38 ( S1 ) : 27 – 48 . [CROSSREF] [CSA]
- Turpin , B. J. and Huntzicker , J. J. 1994 . Investigation of Organic Aerosol Sampling Artifacts in the Los Angeles Basin . Atmos. Env. , 28 ( 19 ) : 3061 – 3071 . [CROSSREF] [CSA]
- Vallius , M. J. , Ruuskanen , J. , Mirme , A. and Pekkanen , J. 2000 . Concentrations and Estimated Soot Content of PM1, PM2.5, and PM10 in a Subarctic Urban Atmosphere . Environ. Sci. and Technol. , 34 : 1919 – 1925 . [CROSSREF] [CSA]
- Watson , J. G. and Chow , J. C. 2002 . Comparison and Evaluation of In-Situ and Filter Carbon Measurements at the Fresno Supersite . J. Geophys. Res. , 107 ( D21 ) : ICC 3-I-ICC 3 – 15 . [CROSSREF] [CSA]
- Yu , J. Z. , Tung , J. WT. , Wu , A. WM. , Lau , A. KH. , Louie , P. KK. and Fung , J. CH. 2004 . Abundance and Seasonal Characteristics of Elemental and Organic Carbon in Hong Kong PM10 . Atmos. Env. , 38 ( 10 ) : 1511 – 1521 . [CROSSREF] [CSA]
- Zhu , Y. F. , Hinds , W. C. , Kim , S. , Shen , S. and Sioutas , C. 2002 . Study of Ultrafine Particles near a Major Highway with Heavy-Duty Diesel Traffic. . Atmos. Env. , 36 : 4323 – 4335 . [CROSSREF] [CSA]