The thermophoretic deposition of aerosol particles in mixed-convection, laminar tube flow with a cooled wall is considered. The presence of free convection alters the velocity and temperature profiles for laminar tube flow relative to the constant-properties case. Previous modeling results (Walsh, Weimer, and Hrenya, in press), show that the modified flow fields lead to changes in the cumulative deposition-efficiency profiles (i.e., deposition as a function of axial distance). In particular, deposition in vertical, downward flow is higher at short axial distances as compared to the upward counterpart, while overall deposition efficiencies (i.e., total deposition in the tube) for both cases are closer in magnitude. In this study, experimental data is obtained in an attempt to qualitatively and quantitatively validate the model predictions for the effects of free convection on cumulative deposition efficiencies. To explore the effects of free convection, two cases are considered: (1) comparison of systems with a high and low Richardson number for vertical, downward flow, and (2) comparison of upward and downward flow for the case of a high Richardson number. Experimental results for the two cases qualitatively agree with model predictions. In particular, there is higher deposition at short axial distances in downward flow than upward flow. In Walsh et al. (in press), modeling predictions showed that the initial increased deposition in downward flow is due to increased residence time. In addition, further evidence is shown of the validity of using the local Richardson number (in addition to the bulk Richardson number) as a predictor of the effects of free convection on a system.
INTRODUCTION
Thermophoresis refers to the behavior in which aerosol particles suspended in a gas migrate from high temperature regions to lower temperature regions due to collisions with the surrounding gas molecules. For a non-isothermal system in which the bounding surfaces are relatively cool, thermophoresis causes aerosol particles to move toward the surface and deposit. Two applications in which the surface deposition of particles is important are the manufacture of optical fiber preforms by the modified chemical vapor deposition process (MCVD) and the manufacture of ceramic powders, such as aluminum nitride, in aerosol flow reactors. In the MCVD process, deposition is desired to coat the interior of the tube, whereas in aerosol flow reactors, particle deposition leads to decreased yields. A common element of the two aforementioned applications is a fairly low gas velocity, and thus both free (natural) and forced convection are important. To gauge the importance of free-convection effects, the Richardson number, which is the ratio of the free convection to the forced convection, can be calculated:
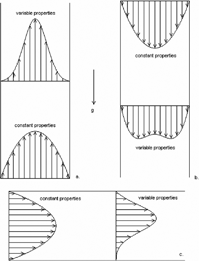
Free convection arises due to variations in the density, and alters the velocity and temperature profiles differently depending on system orientation. contains sketches of the flow fields (i.e., velocity or temperature) of the variable-properties (density, viscosity, heat capacity, thermal conductivity) cases for three tube flow configurations, along with the constant-properties (parabolic) counterpart: (1) upward, vertical flow in a (2) downward, vertical flow in b and (3) horizontal flow in c.
FIG. 1 Sketches of the effect of free convection on velocity and temperature flow fields: (a) vertical, upward flow; (b) vertical, downward flow; and (c) horizontal flow.
Since thermophoresis is a function of the velocity and temperature profiles of the system, the presence of free convection is expected to alter deposition levels along the pipe (relative to the constant-property case). In Walsh et al. (in press), a model was developed to solve the equations of continuity, momentum, and energy for the gas phase, coupled with a population balance for the particle phase that includes the effects of free convection for systems with Ri ≈ 0.25–8. Model predictions for upward, downward, and horizontal flow show visible differences in cumulative deposition-efficiency profiles (i.e., deposition as a function of axial distance) for systems with a bulk Ri ≥ 1, and a local Ri that remains non-zero over a significant axial distance. The variations in the cumulative deposition-efficiency profiles can be traced to a tradeoff between the effects of free convection on the temperature and velocity profiles. In particular, an increased residence time that arises from the flattened velocity profile in downward flows leads to increased deposition, whereas the corresponding flattened temperature profile leads to a smaller temperature gradient, thereby decreasing deposition. The predictions for cumulative deposition efficiencies indicate that the effect of the flattened downward flow velocity profile dominates over the effect of the flattened temperature profile, leading to increased deposition at short axial distances for the downward flow case. At larger axial distances, upward and downward flow displays approximately the same total particle deposition (i.e., overall deposition efficiency). Walsh et al. (in press) also found that in addition to a bulk Ri ≥ 1, an examination of the local Richardson number is also needed, since a precipitous drop in the local Richardson number appears to indicate that the effects of free convection are not important despite a bulk Ri ≥ 1. Of particular interest in this study is determining if the qualitative and quantitative nature of predictions obtained from this model can be verified experimentally.
Many previous efforts to understand thermophoresis have been undertaken, and the problem has been approached from both a theoretical and experimental viewpoint. A review of previous theoretical studies is available in Walsh et al. (in press). A summary of previous experimental efforts for determining thermophoretic deposition efficiencies is given below.
CitationMontassier et al. (1990) and CitationMontassier et al. (1991) experimentally studied the effect of particle size on cumulative deposition efficiency for vertical, upward flow by cutting the deposition tube into 5 cm sections after the experiment to determine deposition as a function of axial distance. The Ri ≈ 0.2, indicating that free convection is probably not important for these conditions. The results show that a lower flow rate leads to greater deposition, as is expected due to the increased residence time. CitationShimada et al. (1993) investigated the overall deposition efficiency (i.e., total deposition in the tube) of ultrafine particles (7–40 nm) for large temperature gradients (0°C to 900°C) in a vertical, upward-flow configuration. CitationShimada et al. (1994) found increasing wall deposition as the furnace temperature is increased. Also, CitationShimada et al. (1994) found that deposition does not depend on particle material (as long as evaporation effects are not present), but deposition can depend on the gas species, because the different physical properties of various gases lead to differences in the temperature distributions. CitationStratmann et al. (1994) experimentally looked at the overall deposition efficiency for downward, vertical flow, with a small temperature gradient (100°C or less). CitationKim (1997) performed experiments to obtain cumulative deposition efficiencies by incorporating a set of stacked “unit cells” that could be weighed before and after each experiment to determine mass deposited as a function of axial distance. A horizontal configuration was examined with Ri ≈ 5–125, indicating that free convection may be important. Comparisons of constant-properties model predictions (including the effects of forced convection, Brownian diffusion, thermophoresis, and coagulation) to experimental results indicate that the effects of free convection may be significant at low gas flow rates since the theoretical and experimental results matched well, except at low flow rates.
In summary, several studies looked at overall deposition efficiency; however, only Montassier (1990, 1991) and CitationKim (1997) looked at cumulative deposition efficiency. Of those two, only CitationKim (1997) looked at conditions where free convection might play an important role. Although CitationKim (1997) did not specifically investigate the effects of free convection, it was suggested that effects of free convection were important at low gas velocities. Previous studies have not directly addressed the effects of free convection on cumulative deposition efficiency in an experimental system, and particularly how various configurations affect the deposition. The objective of this study is to experimentally probe the effects of free convection on cumulative deposition efficiency profiles for various configurations and to validate corresponding model predictions. The potential importance of free convection on a system is gauged by calculating the bulk and local Ri of the system. Experiments have been run at conditions to compare the effects of a higher Ri (lower flow rate) versus a lower Ri (higher flow rate). These results are compared to model predictions and good qualitative agreement was found. Quantitative agreement is improved by accounting for the furnace hot zone, in addition to the cooling zone (where the particle deposition takes place). Also, for a relatively high Ri, experimental cumulative deposition efficiency is higher in downward flow at short axial distances than upward flow. This result agrees qualitatively with previous modeling predictions (Walsh et al. in press), which determined that increased deposition at short axial distances in downward flow was due to increased residence time. In addition, the local Richardson number successfully predicts the importance of free convection on the system.
THEORETICAL APPROACH
The experimental system described in the next section was designed to run under similar conditions as the ceramic powder synthesis (specifically, aluminum nitride) and optical fiber processes. The dimensionless numbers that characterize the systems are of the same order of magnitude (). The new nomenclature in this table is as follows: ρ is the density, V is the velocity, μ is the viscosity, ν is the kinematic viscosity, and α is the thermal diffusivity.
TABLE 1 Dimensionless numbers
The systems considered herein operate in the laminar flow regime with a Reynolds number (Re) on the order of 50–100. The developing nature of the velocity and temperature profiles is an important consideration since the Prandtl numbers (Pr) have an order of magnitude of 1. The Peclet number is approximately 50–100 for each system, and therefore axial conduction may be neglected. The Richardson number, a ratio of the free convection relative to the forced convection, is of order 1 and thereby indicates that free convection may be important. As outlined below, a model describing a system with the aforementioned dimensionless numbers was developed in Walsh et al. (in press).
The system under investigation involves hot nitrogen gas containing solid, suspended aerosol particles flowing through a cylindrical tube with a relatively cold wall temperature, T wall . The gas flow is assumed to be laminar and fully developed at the tube entrance, with a constant temperature, T in . Physical properties of the gas phase (density, viscosity, thermal conductivity, and heat capacity) are defined as a function of temperature using a first- to sixth-order polynomial or a power law expression. These equations are fitted based on tabulated physical property data for nitrogen (CitationIncropera and DeWitt 1996). Due to the allowed variation of density as a function of temperature, free (natural) convection effects are inherent in the model.
For purposes of simplicity, particles are assumed to be monodisperse and spherical. The particle size is set at 30.2 nm, which is consistent with the size of the carbon black used for the experiments. The effects of both thermophoresis and Brownian diffusion on the particles are included, since they are dominant forces for the small particle diameter considered herein. Thermophoresis is independent of particle size (for particles less than 1000 nm), though Brownian diffusion is a function of particle size (CitationHinds 1982). For particle concentrations less than or equal to 1 × 10¹⁰ particles/cm3 gas (approximately 2.6 × 10¹⁶ particles/kg gas), coagulation does not affect particle transport to the wall (CitationPratsinis and Kim 1989). Particle coagulation effects are not included, and therefore the model used herein is limited to systems with a relatively low particle concentration. The particle concentrations in the experimental system are ≈1.7 × 10¹⁷ particles/kg gas for 1 slpm and ≈ 9.6 × 10¹⁶ particles/kg gas for 5 slpm. Thus, the experimental particle concentration is slightly above the limit for assuming negligible particle coagulation effects. The implications of neglecting coagulation in the model will be discussed in the results and discussion section. Reactions are not considered.
The velocity and temperature profiles obtained by solving the coupled gas-phase governing equations (continuity, momentum and energy) are used as input to solve the population balance (i.e., the equations for the two phases involve one-way coupling; CitationRosner and Park 1988). Hence, the velocity profile of aerosol particles is assumed identical to that of gas phase.
The gas-phase equations are solved assuming laminar tube flow (low Re) with negligible axial conduction (high Pe). For a vertical configuration with variable physical properties, the governing equations take the following form:
TABLE 2 Model inputs for experimental conditions
The aerosol population balance, which includes the effects of convection, Brownian diffusion and thermophoresis, is solved using velocity and temperature profiles determined by solving the gas-phase equations. For a vertical flow configuration, the variable-properties form of the population balance takes the form (CitationShimada et al. 1993; CitationStratmann et al. 1994):
At the wall, the particle concentration is set to zero due to the assumption that particles colliding with the wall will stick (CitationHinds 1982). At the centerline, the boundary condition ∂ n/∂r = 0 is used. The inlet value of the particle concentration is set to a constant value that depends on the case being investigated. Solution of the aerosol population balance yields the particle concentration profiles in the system. The cumulative deposition efficiency, E, can be calculated directly from the local concentration profiles via:
The system of differential equations for the gas and particle phases is solved using the computational fluid dynamics (CFD) package FLUENT. A user-defined scalar function, written in C, is used to solve the aerosol population balance in FLUENT. The model was verified by establishing good agreement in comparisons of modeling results to various limiting cases (i.e., a constant-properties model for Brownian diffusion and thermophoresis both individually and together). For further details on the numerical method see Walsh et al. (in press) and CitationWalsh (2005).
EXPERIMENTAL APPROACH
A schematic of the experimental apparatus, consisting of a particle feeder, furnace, multi-part quartz tube, and filter, is shown in . The particles examined in this work were acetylene carbon black (Chevron Phillips Chemical Company LLC, Shawinigan Black® Acetylene Black) with an average primary particle size of 30.2 nm. Nitrogen was used as the carrier gas. The system operated at atmospheric pressure.
FIG. 2 Overall schematic of experimental apparatus.
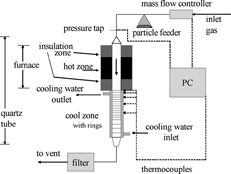
In this setup, a mass flow controller (Aera FC-D980C) regulates the flow of nitrogen into the system. From the mass flow controller the nitrogen flows into a particle feeder, which is a modified, seven-speed, Waring laboratory blender. To achieve the desired gas and particle feed rates several particle feeders were tested, including an Erlenmeyer flask feeder, a vibrating tray feeder, and a blender feeder. Feeding of the particles into the system proved challenging due to the low gas flow rate needed to achieve a system in which free convection plays an important role. The most repeatable results were achieved with the blender feeder, which was used for all of the deposition results presented herein. Instead of using the standard Waring blender jar, a 32 oz. Nalgene bottle was connected to a blade and a cloverleaf-shaped adapter so it would fit onto the Waring base. Additionally, an O-ring was placed in the Nalgene lid to ensure a gas-tight seal. Two stainless steel gas lines were placed through the lid for the inlet and outlet flow of gas. Spinning the blender blades (at speed 2) caused the carbon powder in the Nalgene bottle to be tossed up and entrained in the gas flow. With the blender off, particles sitting at the bottom of the blender container were not entrained by the flow of nitrogen through the bottle. In the initial set-up of the blender feeder, coarse adjustment of the particle feed rate was achieved by changing the blender speed, length of the gas outlet tube, and mass of particles in the blender. Once coarse adjustment yielded a desirable feed rate, the settings remained unchanged. The range of gas velocities examined in the experimental runs lead to a variation in particle feed rate.
Following entrainment in the blender, the nitrogen and carbon particles flow through stainless steel tubing into a quartz tube, which was custom made by Allen Scientific Glass Inc. (Boulder, CO USA). As seen in , the quartz tube is 1.3 m long with an inner diameter of 17 mm through the hot zone (axial length = 0.8 m) and expanding to 24 mm in the cooling zone (axial length = 0.5 m). A section of the quartz tube on the narrower end is surrounded with a vertical tube furnace (CM furnaces: Rapid Temp Model 1710VT), which creates the hot zone of the experiment. The furnace has a hot zone in the center, which is 10 inches in length, with 6-inch long insulation zones on both ends. In the hot zone, the gas and particle phases are heated to 1000 K.
FIG. 3 Schematic of quartz glassware for experimental system.
After flowing through the furnace-heated section of the quartz tube, the gas-particle flow enters the cooling-zone section of the quartz tube. In this section, the quartz tube is surrounded by a quartz-walled cooling water jacket (axial length = 0.5 m) that creates a relatively cold wall. In this section, the relatively hot particles migrate toward the cold tube wall due to thermophoresis. The water jacket was inserted into the insulation zone of the furnace so that there is a sharp boundary between the heating and cooling zones. Since thermophoresis is driven by a temperature gradient, variations in the temperature gradient will lead to variations in the deposition efficiency. In order to improve the repeatability of the temperature throughout the system, the furnace was held at the set point temperature for one hour before the particle feed was started. A peristaltic pump moves the water through the jacket from a large water reservoir (Erlenmeyer flask) surrounded by an ice bath. Inside of the cooling zone section of the quartz tube is a basket and a set of 40 stacked quartz rings (). The quartz rings have an inner diameter = 17 mm and an outer diameter = 19 mm. The 30 closest to the hot zone are 1 cm in height of and the remaining 10 are 2 cm in height. The rings are held by the basket, which is a slightly larger quartz tube (inner diameter = 20 mm and outer diameter = 22 mm), which is 0.5 m long and has a lip on one end to hold the quartz rings inside. Because the quartz rings are located on the inside of the cooling zone, particle deposition occurs on the inner surface of the rings, thereby allowing for deposition measurements as a function of axial distance.
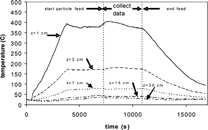
The cooling-zone temperature is measured by five bare-wire thermocouples with diameters of 0.25 mm. The thermocouples are placed at the first, third, seventh, fifteenth, and thirty-first rings (i.e., centimeters) counted from the hot zone toward the outlet (). Corresponding wires run along the outside of the basket and are inserted through holes in the basket to touch the outer wall of the rings. The inner and outer wall temperatures were calculated in FLUENT by using the thin-wall boundary condition to determine if the temperatures could be assumed equal for purposes of model predictions. The temperature on the fluid side of the wall is calculated from the measured values of T wall on the outer wall, assuming one-dimensional heat conduction (thermal resistance = wall thickness/thermal conductivity). Modeling predictions of the heat transfer through the quartz wall shows that only a small temperature difference exists between the inner and outer wall of the quartz, as is seen in . Thus, measurements of the outer wall temperature are assumed equal to the inner wall temperature for purposes of modeling. Temperature readings are recorded using Labview software. This software is also used to control the gas flow rate via the mass flow controller.
FIG. 4 Interior and exterior wall temperature of quartz rings for 1 slpm (Ri ≈ 15.0) downward flow case considering cooling zone only. The outer-wall temperature is fitted based on experimental measurements. The inner-wall temperature is based on model predictions.
An end-cap piece () was designed to hold the basket in the proper location in the cooling zone as well as transition the flow from the quartz tube back to quarter inch stainless steel tubing. Once the gas-particle flow exits the quartz tube, the mixture flows through stainless steel tubing toward the 142 mm diameter stainless steel filter, which contains filter paper with a 0.2 μ m pore size. The filtered gas flow is then released through an exhaust hood.
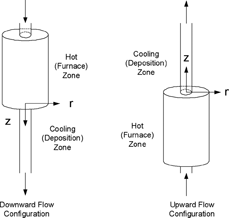
As illustrated in , the system was designed so that it can be rotated 180° in order to run in both the upward and downward flow configurations. The vertical furnace is raised and lowered on a pulley system to accommodate the length of the quartz tube in either direction. The quartz tube is inserted into the furnace with the cooling zone on the bottom (downward flow) or the top (upward flow). Note that the z-coordinate origin is at the start of the cooling zone, and always points in the direction of flow (upward for upward flow and downward for downward flow).
FIG. 5 Sketch of downward and upward flow configurations of experimental system.
The quartz rings are weighed before and after each experiment to determine the mass of carbon deposited in the system as a function of axial distance. The mass of carbon deposited on each ring ranged from 0.0185 g (at beginning of cool zone, where deposition levels were largest) to 0.00014 g (at end of cool zone, where little deposition occurred). The error of the balance is approximately +/− 0.0003 g. Hence, errors in the cumulative deposition as a function of axial distance are small. In addition, the weight of the blender container and the filter paper are measured before and after in order to ensure a mass balance of carbon in the system. The particle mass balance for the system was checked by carefully measuring the mass of carbon fed from the blender and the mass of carbon collected after the run. Typically, 90–98% of the carbon fed into the system was accounted for in the experimental runs.
The operating conditions used for the experiments are a furnace temperature of 1000 K, and gas flow rates of 1 and 5 slpm (standard liters per minute), which corresponds to Ri ≈ 15.0 and 0.60, respectively. Particles were fed into the system for an hour, which led to an inlet particle concentration of ≈ 1.7 × 10¹⁷ particles/kg gas for 1 slpm and ≈ 9.6 × 10¹⁶ particles/kg gas for 5 slpm. Visual observations indicated that the particle feed rate is fairly consistent at 1 slpm though does exhibit fluctuations at 5 slpm. However, model predictions demonstrate that the cumulative deposition efficiency, when normalized by the inlet concentration (see Equation Equation10), is essentially unaffected by the inlet concentration. This behavior was confirmed for inlet concentrations up to three orders of magnitude smaller.
RESULTS AND DISCUSSION
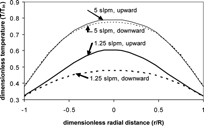
To explore the effects of free convection on cumulative deposition efficiency, experimental conditions, as listed in , were chosen to match the dimensionless parameters of the optical fiber and aluminum nitride systems (). The Ri ≈ 1, indicating that the effects of free convection may be important. A variation in the flow rate will lead to different Ri for a system which is otherwise unchanged. Two flow rates were chosen, namely 1 slpm and 5 slpm, which correspond to Ri ≈ 15.0 and 0.60, respectively. Model predictions of axial velocity and temperature at an axial distance of 0.1 m, and flow rates of 1.25 slpm (Ri ≈ 9.6) and 5 slpm (Ri ≈ 0.60) indicate that free convection alters the axial velocity () and temperature profiles () as expected, namely a “peaked” upward flow profile and “flattened” downward flow profile. (Note that 1.25 slpm is chosen to compare to instead of the experimental condition of 1 slpm due to instability of the model for 1 slpm upward flow, which will be detailed later.) and demonstrate that these alterations in the velocity and temperature profiles between upward and downward flow are larger at lower velocities (higher Ri). Such alterations are expected to lead to differences in the thermophoretic deposition.
FIG. 6 Axial velocity profiles as a function of radial distance for flow rates of 1.25 (Ri ≈ 9.6) and 5 slpm (Ri ≈ 0.60), both upward and downward flow. (Includes hot zone and variable-wall temperature, detailed later.)
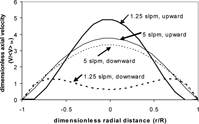
FIG. 7 Temperature profiles as a function of radial distance for flow rates of 1.25 (Ri ≈ 9.6) and 5 slpm (Ri ≈ 0.60), both upward and downward flow. (Includes hot zone and variable-wall temperature, detailed later.)
To better gauge the impact of free convection, Walsh et al. (in press) found that in addition to looking at the bulk Ri, the local Ri should also be calculated along the tube length since a precipitous drop to zero in the local Ri precludes the effect of free convection. The local Ri plots (calculated with 26 sections in the cooling zone only, Δ z = 0.02 m) for the experimental conditions at 1 and 5 slpm are shown in . For both cases, the local Ri remains non-zero over a significant length of the tube, indicating that free convection is an important consideration. The local Ri for the 1 slpm case is relatively large compared to the 5 slpm case, indicating that free convection has a stronger effect in the 1 slpm case, as expected.
FIG. 8 Comparison of local Ri as a function of axial distance for 1 slpm (Ri ≈ 15.0) and 5 slpm (Ri ≈ 0.60) downward flow cases. (Includes hot zone and variable-wall temperature, detailed later.)
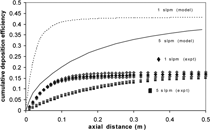
To explore the effects of free convection and to test model validity (i.e., confirm model predictions experimentally), two cases are considered: (1) comparison of systems with a high and low Ri for vertical, downward flow, and (2) comparison of downward and upward flows for a system with a high Ri. Results of the first case are presented in , which compares the cumulative deposition-efficiency profiles for experiments run at 1 slpm (three repeats) and 5 slpm (two repeats) in vertical, downward flow. The shape of the two curves differs for the two flow rates examined. In particular, the 1 slpm (Ri = 15.0) deposition efficiency profiles increase quickly and then flatten out, while the 5 slpm (Ri = 0.60) profiles steadily increases. The asymptotic limit reached by the 1 slpm (Ri = 15.0) case indicates that the gas phase has cooled to the temperature of the wall and thermophoretic deposition has ceased. Brownian diffusion, however, continues in an isothermal system, and the flattening indicates that such diffusion contributes negligibly to the deposition. The steady increase of the 5 slpm (Ri = 0.60) case indicates that the gas temperature does not equilibrate to the wall temperature in the tube length examined, and thermophoretic deposition continues throughout the tube. The lower deposition levels at 5 slpm are attributed to the lower residence time that arises from the increased flow rate, which leads to decreased deposition. This observation of lower deposition levels for higher flow rates agrees qualitatively with previous results (CitationKim 1997; Walsh et al. in press). also shows model predictions for experimental conditions considering the cooling zone only. The model inputs are listed in . As a first step, the wall is considered to be at a constant temperature. The model predictions show the same qualitative behavior as the experimental results, though the modeling predictions are considerably higher than the experimental data. In order to address this inconsistency, the assumption of a constant wall temperature in the cooling zone was explored further.
FIG. 9 Experimental cumulative deposition efficiency for downward flow 1 slpm (diamonds, 3 repeats) and 5 slpm (squares, two repeats). Corresponding variable-property modeling predictions assuming a constant wall temperature and considering the cooling zone only.
To characterize the nature of the wall temperature profile of the experimental system, five bare-wire thermocouples were placed on the wall at various axial distances. Although the goal of the fluid jacket is to maintain a relatively constant wall temperature throughout the cooling zone, measurements from the bare-wire thermocouples indicate that the temperature varies as a function of axial distance, as pictured in . In order to incorporate this effect into the model, the temperature data was fit to an exponential function (AeBz + C) in order to calculate the wall temperature as a function of axial distance (temperature equations are listed in ). Inclusion of the variable T wall leads to slightly lower deposition predictions than with the constant T wall model, as shown in . The variable T wall model retains the qualitative agreement of the constant T wall predictions. The lower deposition predictions come from the reduced temperature gradient that arises by considering the variable wall temperature. In particular, when T wall is held constant, the hot gas exits the furnace and immediately is exposed to cooling water at 293 K, while the variable T wall treatment accounts for the wall being hotter at the top of the cooling zone and then dropping in temperature along the tube length to approximately 300 K (i.e., the constant wall temperature model uses the lowest temperature of the cooling zone throughout the whole axial distance). It is difficult to ascertain if the difference in the two downward flow curves (1 slpm versus 5 slpm) are due to free convection or the change in flow rate. For comparison, the cumulative deposition predictions from a model with constant properties (no free convection) are also included. The constant-properties deposition curve for 5 slpm matches the trend of the 5 slpm variable-properties curve better than the corresponding curves for the 1 slpm case. For approximately the first fifth of the tube length of the 1 slpm case, the variable-properties curves (for both variable and constant wall temperature) have a different slope than the corresponding constant-property prediction. The difference in the slopes of the 1 slpm deposition curves indicates the effect of free convection (i.e., the effects on overall deposition efficiency are small; more noticeable changes are in the trend of the cumulative deposition efficiency). In particular, the steeper slope of the variable-properties case at 1 slpm, can be traced to the effect of the radial velocities, which initially are in the direction of the wall, thereby aiding thermophoresis.
FIG. 10 Temperature profiles as a function of experimental run time at axial distances of 1, 3, 7, 15, and 30 cm. For 1 slpm downward flow.
While the addition of the variable wall temperature improves the comparison between theoretical and experimental results, a quantitative discrepancy is still present (). The modeling predictions in and have been determined by modeling only the cooling zone of the system and assuming that the temperature and concentration profiles are uniform across the entrance to the cooling zone. The addition of the hot zone (10 in. long) to the model system allows the validity of these assumptions to be addressed. The inclusion of the hot zone changes the magnitude of the average inlet velocity and temperature as show in , although the form of the profiles remains the same. The wall temperature of the hot zone corresponds to the furnace set point temperature of 1000 K. The modeling predictions for the cumulative deposition efficiency including the hot zone are displayed in . The addition of the hot zone causes a dramatic decrease in the value of the cumulative deposition efficiency, although the qualitative trends remain similar. This decrease in deposition is due in part to the particles moving toward the center of the tube in the hot zone section. More specifically, since the walls in the hot zone are hotter than the tube interior (which is the opposite of the cooling zone), particles move toward the center due to thermophoresis. illustrates model predictions of the concentration profiles at 1 slpm, which shows the particle concentration becoming higher in the center and lower near the wall in the hot zone. Also, the predicted concentration profiles show that a flat concentration profile is not accurate for the entrance to the cooling zone. This effect is more pronounced at 1 slpm than at 5 slpm (figure not shown). The deposition in the 5 slpm case is also affected by the temperature of the gas, which does not reach the furnace set point temperature by the end of the hot zone section. Therefore, for the 5 slpm case the assumption of a flat temperature profile is inaccurate. In contrast, for 1 slpm cases the gas does reach the furnace set point temperature (i.e., uniform temperature) before entering the cooling zone. For the 5 slpm case, the incomplete heating of the gas leads to a lower temperature gradient, and therefore a lower driving force for thermophoresis.
FIG. 11 Modeling prediction comparing a constant-properties model, a variable-properties model with a constant wall temperature, and variable-properties model with a variable wall temperature for 1 and 5 slpm downward flow considering cooling zone only.
FIG. 12 Experimental cumulative deposition-efficiency for downward flow at 1 and 5 slpm compared with variable-property model. Model includes the hot zone and variable-temperature wall.
FIG. 13 Concentration profiles for 1 slpm, downward flow at various axial distances as predicted by the variable-properties model. Model includes the hot zone (hot zone: 0 m ≤ z < 0.254 m, cooling zone: 0.254 m ≤ z ≤ 0.754 m) and variable-temperature wall.
Originally, the temperature of the gas entering the hot zone was assumed to be 293 K, however, measurements at the entrance of the furnace (i.e., insulation zone) indicate that the temperature entering the insulation zone is approximately 400 K. Including this pre-heating of the gas raises the deposition levels predicted by the model, and brought the predictions closer to the experimental results. and the following figures are based on T in = 400 K; the predictions assuming T in = 293 K are not shown. Comparisons of the concentration profiles for the 1 slpm downward flow case with an inlet temperature of 293 K and 400 K show that fewer particles move toward the center of the tube when the gas is “pre-heated” (not shown). With the inlet gas temperature at 400 K, very good agreement is obtained between the experimental and theoretical results at 1 slpm; however, a discrepancy still exists at 5 slpm. The model predicts lower deposition than was obtained in the experiments which could be due to experimental error or limitations of the model.
The second case, a comparison of upward and downward flow results for a high Ri system, is explored to gauge the effect of free convection on cumulative deposition efficiency. As mentioned previously, free convection alters the velocity and temperature profiles in different manners depending on the tube configuration ( and ). Although it may be expected that the higher radial temperature gradient present in upward flow leads to increased thermophoretic deposition, Walsh et al. (in press) found that downward flow is characterized by higher deposition levels at short axial distances. This behavior is traced to increased residence times due to the flattened downward flow velocity profile. shows experimental cumulative deposition efficiencies for downward (3 repeats) and upward flow (2 repeats) at flow rate of 1 slpm (Ri ≈ 15.0). The experimental results qualitatively match the model predictions, with increased deposition in downward flow at short axial distances and a similar overall deposition efficiency.
FIG. 14 Experimental cumulative deposition-efficiency for 1 slpm upward and downward flow, compared to the variable-properties model including the hot zone and variable-temperature wall.
Unfortunately, modeling results are not available for the 1 slpm vertical, upward flow case due to the lack of convergence of the model. The inability of the model to converge is likely due to the presence of buoyancy-induced turbulence in the system. If the effects of free convection create large distortions in the velocity profiles, the profiles will become unstable and develop into an eddying flow. As seen in , the velocity profiles are more distorted at 1.25 slpm than 5 slpm. Furthermore, the flatness of the 1.25 slpm velocity profile near the wall indicates the onset of turbulence (CitationScheele, Rosen, and Hanratty 1960). Instead, a modeling prediction for 1.25 slpm upward flow is shown for comparison to the 1 slpm experimental results and the 1 slpm downward flow model predictions and experiments. The modeling predictions for the upward flow case are quantitatively lower than the experimental results at short axial distances; however, the qualitative trends predicted by the model match the behavior of the experimental system. The disparity in the upward flow case is due in part to comparing modeling predictions for a slightly higher flow rate (1.25 slpm) than was actually present in the experiment (1 slpm). Model predictions of a lower flow rate would be expected to move the cumulative deposition efficiency curve toward the experimental results (figure of cumulative deposition efficiency for upward flow at various flow rates not shown). The mismatch could also be due to the presence of buoyancy-induced turbulence in the experiments, since such effects are not included in the current model. As turbulence profiles are typically flat, the presence of buoyancy-induced turbulence may cause the peaked upward flow velocity profile to become more flattened, like the flattened downward flow velocity profile. Therefore, the cumulative deposition efficiency of the upward flow case would be closer to the downward flow case than the model predicts.
Finally, it is worthwhile to note that modeling predictions of cumulative deposition efficiency are not sensitive to inlet concentration or particle size. Inlet concentration was varied by 3 orders of magnitude and found to lead to only a slight change in the cumulative deposition efficiency. Since the cumulative deposition efficiency is calculated by normalizing the mixing-cup average of the concentration by the initial concentration, this result is not unexpected. The inlet concentration of the experiments (1.67 × 10¹⁷ particles/kg gas at 1 slpm and 9.58 × 10¹⁶ particles/kg gas at 5 slpm) was slightly higher than the limit presented in CitationPratsinis and Kim (1989) in order to neglect the effects of coagulation (2.6 × 10¹⁶ particles/kg gas). If appreciable particle coagulation is occurring in the experimental system, particles may be agglomerating to a large size, and would not be strongly influenced by the effects of thermophoresis. In this situation, fewer particles would deposit than would be predicted by a model that neglects coagulation. If coagulation is important, the experimental system is expected to have lower deposition than the model predictions (which neglect coagulation), which is not the case in the results shown here ( and ). Finally, the particle size input to the model was changed from 30.2 nanometers (primary particle size) to 416 nm (average agglomerate size). This change also had very little impact on the cumulative deposition efficiency results. Although thermophoresis in the model is treated as independent of particle size for particles under 1000 nm (since K is assumed constant), Brownian diffusion is a function of particle size (Equation Equation9). These results indicate that thermophoretic deposition dominates in the experimental conditions.
SUMMARY
An experimental system was designed to explore the effects of mixed convection on the cumulative deposition efficiencies of aerosol particles in laminar, tube flow. Experimental results were compared to modeling predictions based on the solution of the equations of continuity, momentum, and energy for the gas phase, and a population balance for the solid phase. The goal of the experiments was to examine the effects of free convection on the cumulative deposition efficiency and validate model predictions.
First, a comparison was made between two flow rates (i.e., high and low Richardson numbers) in downward flow. The cumulative deposition efficiency profiles of the two cases are different, as is predicted qualitatively by the model. The quantitative match of the model predictions is improved by considering the hot zone of the system instead of only the cooling (deposition) zone. The 1 slpm downward flow case matches particularly well. The inclusion of the hot zone leads to lower deposition predictions because the particles move to the center of the tube while in the hot zone, leading the particles to have further to travel to the wall when the cooling zone is reached. Also, for higher flow rates, the gas does not heat up to the furnace set point temperature, effectively lowering the temperature gradient that drives thermophoresis.
In the second portion of the work, a comparison is made between downward and upward flow at a high Ri (i.e., low flow rate), which better isolates the effects of free convection. Again, model predictions qualitatively predict the trends, although the model quantitatively predicts slightly lower deposition than the 1 slpm upward flow case at short axial distances. These results show increased deposition at short axial distances in downward flow as compared to upward flow, in agreement with the modeling predictions in Walsh et al. (in press). The increased deposition at short axial distances in downward flow is explained by the increased residence time which arises due to free convection flattening the downward flow velocity profile. The residence time effect dominates over the higher temperature gradient of the peaked upward flow profile, which leads to an increased driving force for thermophoresis.
The local Richardson number (in addition to the bulk Richardson number) successfully predicts the importance of free convection on the cumulative deposition efficiencies in the cases presented herein. In particular, for the 1 slpm case (Ri = 15) the local Richardson number is large over a significant axial distance, indicating that the effects of free convection are important. The difference in cumulative deposition efficiency profiles for upward and downward flow in both the modeling predictions and experimental results confirm the importance of free convection in the system. For the 5 slpm case (Ri = 0.6) the local Richardson number is smaller, but still non-zero over a significant axial distance, indicating a smaller effect of free convection than the 1 slpm case.
Acknowledgments
Received 28 June 2005; accepted 29 November 2005. This material is based upon work supported by the National Science Foundation under grants CTS 9803539 and CTS 9973591. The authors also gratefully acknowledge funding support from OMG Americas. Also, the authors express their gratitude to John Daily for helpful discussions regarding the particle feeder and to S.E. Pratsinis for discussions and hosting J.K. Walsh at ETH Zurich under NSF support.
Notes
*These fits are obtained from the following downward-flow data:
REFERENCES
- Friedlander , S. K. 2000 . Smoke, Dust, and Haze: Fundamentals of Aerosol Dynamics. , New York : Oxford University Press .
- Hinds , W. C. 1982 . Aerosol Technology: Properties, Behavior, and Measurement of Airborne Particles. , New York : John Wiley & Sons .
- Incropera , F. P. and DeWitt , D. P. 1996 . Fundamentals of Heat and Mass Transfer. , New York : John Wiley & Sons, Inc. .
- Kim , K.-S. 1997 . Analysis on SiO2 Particle Generation and Deposition Using Tube Furnace Reactor . AIChE Journal , 43 ( 11A ) : 2679 – 2687 . [CSA]
- Montassier , N. , Boulaud , D. , Stratmann , F. and Fissan , H. 1990 . Comparison Between Experimental Study and Theoretical Model of Themophoretic Particle Depositon in Laminar Tube Flow . J. Aerosol Sci. , 21 ( 1 ) : S85 – S88 . [CROSSREF] [CSA]
- Montassier , N. , Boulaud , D. and Renoux , A. 1991 . Experimental Study of Themophoretic Particle Deposition in Laminar Tube Flow . J. Aerosol Sci. , 22 ( 5 ) : 667 – 687 . [CROSSREF] [CSA]
- Pratsinis , S. E. and Kim , K. S. 1989 . Particle Coagulation, Diffusion and Thermophoresis in Laminar Tube Flows . J. Aerosol Sci. , 20 ( 1 ) : 101 – 111 . [CROSSREF] [CSA]
- Rosner , D. E. and Park , H. M. 1988 . Thermophoretically Augmented Mass-Transfer Momentum-Transfer and Energy-Transfer Rates in High Particle Mass Loaded Laminar Forced-Convection Systems . Chem. Engineer. Sci. , 43 ( 4 ) : 2689 – 2704 . [CROSSREF] [CSA]
- Scheele , G. F. , Rosen , E. M. and Hanratty , T. J. 1960 . Effect of Natural Convection on Transition to Turbulence in Vertical Pipes . Canadian J. Chem. Engineer. , 38 ( 15 ) : 67 – 73 . [CSA]
- Shimada , M. Seto , T. 1993 . Thermophoretic and Evaporational Losses of Ultrafine Particles in Heated Flow . AIChE Journal , 39 ( 11 ) : 1859 – 1869 . [CROSSREF] [CSA]
- Shimada , M. , Seto , T. and Okuyama , K. 1994 . Wall Deposition of Ultrafine Aerosol Particles by Thermophoresis in Nonisothermal Laminar Pipe Flow of Different Carrier Gas . Japanese J. Applied Phys. , 33 ( 2 ) : 1174 – 1181 . [CROSSREF] [CSA]
- Stratmann , F. Otto , E. 1994 . Thermophoretical and Diffusional Particle-Transport in Cooled Laminar Tube Flow . J. Aerosol Sci. , 25 ( 7 ) : 1305 – 1319 . [CROSSREF] [CSA]
- Walsh , J. K. , Weimer , A. W. and Hrenya , C. M. in press . Thermophoretic Deposition of Aerosol Particles in Laminar Tube Flow with Mixed Convection . J. Aerosol Science. , [CSA]
- Walsh , J. K. 2005 . Thermophoretic Deposition of Aerosol Particles in Laminar Tube Flow with Mixed Convection. PhD Dissertation , Boulder : Department of Chemical and Biological Engineering. University of Colorado .