This is an instruction manual for the aerodynamic lens design tool: the “Aerodynamic Lens Calculator”. We explain how to install and use this software. Examples are provided to use this tool to design or test a lens system. The structures of the source code programming are also provided in this manual. The design tool and its manual mentioned in this article are available in the publisher's online edition of Aerosol Science and Technology. To access this file, click on the link for this issue, then select this article. In order to access the full article on-line, you must either have an institutional subscription or a member subscription accessed through http://www.aaar.org.
1. INTRODUCTION
We have developed an Aerodynamic Lens Calculator that can be conveniently used to design and evaluate aerodynamic lens systems. This Calculator utilizes empirical relations derived from numerical or experimental studies, and hence avoids the need to repeat detailed numerical simulations in the design process.
The Calculator has two modules: the Design Module and the Test Module. The Design Module takes input from the user and designs the lens system dimensions, operating conditions and provides estimations of the lens performance. The Test Module tests the performance of a lens system with known dimensions.
The detailed equations and design guidelines have been described in a companion paper (CitationWang and McMurry 2006). This manual provides instruction on how to use this Calculator. We first describe the Design and Test Modules in more detail, and provide examples of the design and test processes. We then describe the structure of the background programming of the Calculator. This will help users to understand the coding and to modify the Calculator to their specific needs. The lens calculator has been tested by the authors and several other researchers. However, we cannot guarantee that it is bug-free. Therefore, please contact us if you encounter problems. We would also appreciate your comments or suggestions for improving this Aerodynamic Lens Calculator.
The tests were mostly carried out in Microsoft Office® Excel 2003 in Windows XP operating systems. It may not work in other Excel versions or operating systems. For example, the toolbar may not be loaded in certain versions of Excel for Macintosh. But the Macintosh users can still use this Calculator. Detailed instruction on setting up the program is given in the next section.
2. SETTING UP THE PROGRAM
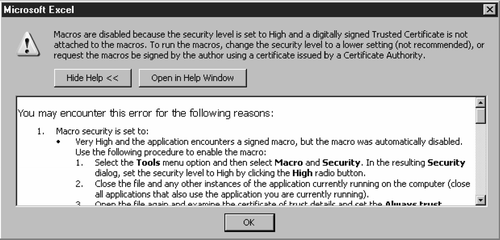
The Aerodynamic Lens Calculator and its manual can be downloaded from the website of Aerosol Science and Technology (http://www.taylorandfrancis.com). Create a new folder and store the Excel file (AeroLensCalculator_060201_vl.0.xls) and PDF manual file (Manual.pdf) in the same directory. Double click the Excel file to open the Calculator. If the file opens without a warning message, you are ready to play with the Calculator. If a warning message similar to pops up, try to lower the Macro security Level.
| 1. | Select the Tools menu option and then select Macro and Security; | ||||
| 2. | In the resulting Security dialog, set the security level to Medium by clicking the Medium radio button; | ||||
| 3. | Close the file, Open the file again and click the Enable button when prompted to allow for the macro to run. | ||||
| 1. | Run the Microsoft Office Installer; | ||||
| 2. | Choose Custom Install; | ||||
| 3. | In the list of applications, expand Office Tools and select Visual Basic for Applications; | ||||
| 4. | Install VBA. | ||||
After these steps, close Excel and open the Calculator file again. A security warning message will appear. Choose the “Enable Macros” option.
For certain Macintosh Excel versions, an error message as shown in may popup. Click the “End” button. In that case, the user will not be able to use the custom toolbar of the Lens Calculator. But equivalent buttons are available for calculations. See next section for detailed instructions.
3. USING THE AERODYNAMIC LENS CALCULATOR
The Aerodynamic Lens Calculator has a user interface in Microsoft Excel, while programming is done through Visual Basic for Applications (VBA). The Calculator consists of three spreadsheets: “Design,” “Test,” and “Gases.” The Design sheet is the Design Module, with which one calculates the dimensions of the lens system and estimates the performance. The Test sheet is the Test Module, which is used to evaluate the lens performance when the lens dimensions are known. The Gas sheet is a database of gas properties. The user can copy these properties to the Design or Test sheet.
In the remainder of this section, we will explain the input and output of each module, and provide examples of designing or testing lens systems.
3.1. The Design Module
3.1.1. Inputs of the Design Module
shows an example of the input data required to design an aerodynamic lens system. There are three categories of inputs: gas properties, lens conditions, and particle properties.
FIG. 3 Example of the input data for the Design Module (A lens for focusing 50–500 nm unit density particles in air).

The properties of the carrier gas used in lens design are: molecular weight (g/mol), specific heat ratio, viscosity (Pa-s), Sutherland's constant (K), and mean free path (nm). These variables are specified at one atmospheric pressure and 296.15 K (CitationRader 1990). Data for some carrier gases are listed in the spreadsheet “Gas.” The user can put in any values pertinent to his/her specific application.
The inputs for lens conditions are: number of focusing lenses (inlet orifice and accelerating nozzle are not counted), pressure before inlet orifice (Pa), pressure before the nozzle (Pa), pressure after the nozzle (Pa), volumetric flowrate through the lens system (slm), operating temperature (K), and the distance (mm) from the nozzle exit to the target where the beam width is of interest. Although the pressure before the nozzle is normally difficult or impossible to measure, this parameter is chosen as an input to make sure the nozzle is choked, and to make the design programming easier. If the input of the pressure before the nozzle is left blank, the Calculator will find a maximum operating pressure. This feature is especially useful when designing lenses for nanoparticles (CitationWang et al. 2005a, b). The user should make sure the Reynolds number is at least below 200 when using this feature.
The input particle properties are: particle density (kg/m3) and the focusing size range defined by the maximum diameter d
pl (nm) and minimum diameter d
p
n
(nm). The program designs a lens system so that the first lens focuses d
p1, the last lens focuses d
pn
, and lens i focuses size d
pi
= d
pl− ![]() (i −1)(i = 1 to
n). We assume that then lenses are responsible for all focusing. In this Calculator, the pressure limiting orifice is denoted as lens 0 (i = 0), the accelerating nozzle is denoted as lens n + 1 (Please refer to the schematic near the title of the Design or Test Module, or in CitationWang and McMurry (2006)).
(i −1)(i = 1 to
n). We assume that then lenses are responsible for all focusing. In this Calculator, the pressure limiting orifice is denoted as lens 0 (i = 0), the accelerating nozzle is denoted as lens n + 1 (Please refer to the schematic near the title of the Design or Test Module, or in CitationWang and McMurry (2006)).
The design module has an optional input of user defined particle diameter and corresponding Stokes number for lens 1 to n (not including the inlet orifice or the accelerating nozzle). This option will overwrite the size input in the “particle properties” section, and it will force the program to design lenses with the user defined Stokes numbers instead of the optimal Stokes numbers. This option is very useful when the user wants to design lenses operating at Stokes numbers other than optimal values, for example, when designing nanoparticle lenses where optimal St's are not possible, and when designing lenses for focusing over a range of sizes that exceeds a decade.
shows an example of the input used to design an aerodynamic lens system that focused 50–500 nm particles of unit density using air as the carrier gas. Five lenses are used in the system. A sample of 0.1 slm aerosol flow is drawn from atmospheric pressure (101325 Pa), and the pressure before the nozzle is specified to be 150 Pa. The detector is located 100 mm downstream of the nozzle exit. The user defined Stokes numbers of each stage is left blank, so optimal Stokes numbers will be used in calculating the orifice diameters.
3.1.2 Tool Bar of the Design Module
When the Excel spreadsheet “Design” is activated, a floating tool bar “Lenses Design” as shown in will popup on the spreadsheet. This tool bar contains the following clickable controls: Design, More, Reset, and Help.
The Design (![]() ) button activates design of the aerodynamic lens system based on the user's input described in the previous section. The More (
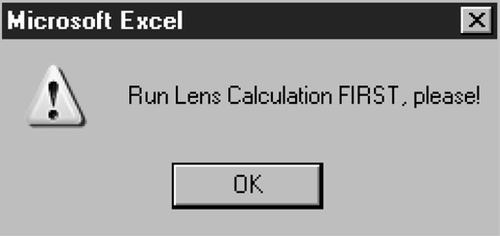
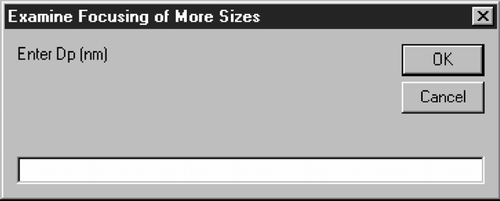
) button activates design of the aerodynamic lens system based on the user's input described in the previous section. The More (![]() ) button allows the user to examine the focusing effects of a given particle size once a lens system is designed. This button is only valid when the Design button has been clicked and the spreadsheet has not been deactivated; otherwise a warning message as shown in will pop up. If the More button is clicked after a lens system is designed, then a popup window as shown in will appear to ask the user to input a particle diameter (nm). After the user inputs a diameter and clicks “OK,” a row will be added to each section of Particle Results. The user can examine up to 20 particle sizes. The Reset (
) button allows the user to examine the focusing effects of a given particle size once a lens system is designed. This button is only valid when the Design button has been clicked and the spreadsheet has not been deactivated; otherwise a warning message as shown in will pop up. If the More button is clicked after a lens system is designed, then a popup window as shown in will appear to ask the user to input a particle diameter (nm). After the user inputs a diameter and clicks “OK,” a row will be added to each section of Particle Results. The user can examine up to 20 particle sizes. The Reset (![]() ) button resets the spreadsheet of the Design Module to a default format. This is useful if the user accidentally deleted some critical cells in the spreadsheet and made an error with the format. When the Help (
) button resets the spreadsheet of the Design Module to a default format. This is useful if the user accidentally deleted some critical cells in the spreadsheet and made an error with the format. When the Help (![]() ) button is clicked, this manual will be opened.
) button is clicked, this manual will be opened.
Besides the floating tool bar, there are four fix buttons: ![]() ,
, ![]() ,
, ![]() , and
, and ![]() . These four buttons are equivalent to the buttons in the toolbar. Both the Windows and Macintosh users can use these buttons.
. These four buttons are equivalent to the buttons in the toolbar. Both the Windows and Macintosh users can use these buttons.
3.1.3. Results of the Design Module
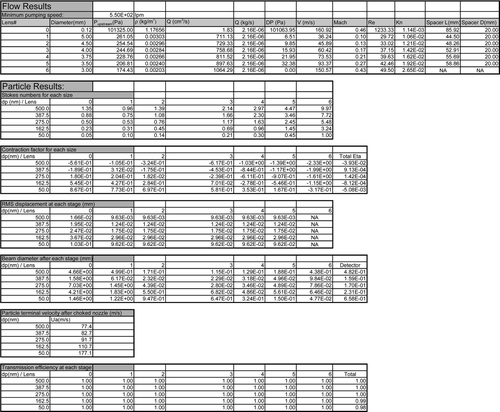
The design results are expressed in two categories: flow and particle results ().
FIG. 7 Example of the result data for the Design Module (A lens for focusing 50–500 nm unit density particles in air).
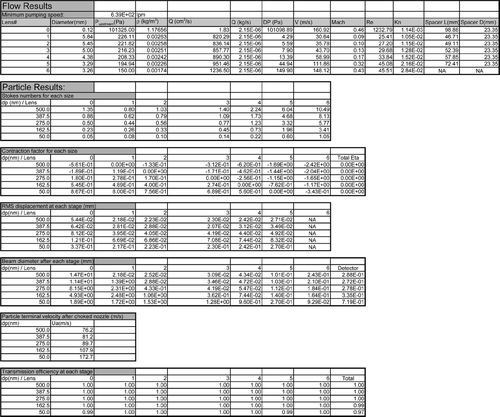
The flow results first provide the minimum pumping speed required for the nozzle to operate at choked condition. The following results are then listed at each column: the lens numbers (0 to n + 1), the calculated aperture diameter of each lens (mm), the pressure upstream of each orifice (Pa), the gas density upstream of each orifice (kg/m3), the volumetric flowrate at each stage (cm3/s), the mass flowrate through the lens system (constant at each stage, kg/s), the pressure drop across each orifice (Pa), the average gas velocity at each orifice (m/s), the flow Mach, Reynolds, and Knudsen numbers at each orifice, and the length and inner diameter of spacers after each orifice (mm).
The listed particle results include the following parameters at each lens stage for each particle size: Stokes number, contraction factor, root mean square (RMS) displacement due to diffusion (mm), particle beam diameter (mm) and transmission efficiency. Also listed is the estimated particle terminal axial velocity (m/s).
shows an example of the results when the Design button is clicked with the input data shown in .
3.2. The Test Module
3.2.1. Inputs of the Test Module
shows the inputs when using Test Module to evaluate the lens system e described by CitationLiu et al. (1995b). Note that the gas and particle properties inputs of the Test Module are exactly the same as the Design Module. However, there are two options in the lens condition input. The first option is to specify the pressure before lens 1 (i.e., in the relaxation chamber) and to leave the flowrate input blank. The other option is to specify the flowrate and to leave the pressure before lens 1 blank. The program will solve for the value of the parameter that is left blank. If both the pressure and the flowrate are specified, the program will take the pressure as input by default.
FIG. 8 Example of the input data for the Test Module (Lens system e described in CitationLiu et al. 1995b).

The lens dimensions need to be specified in the Test Module. These inputs include the aperture diameter of each lens and the nozzle exit, the length and inner diameter (mm) of spacers. The diameter of the inlet orifice should be left blank; the program will calculate its value. The diameter and length of the relaxation chamber (spacer 0) need also be provided. It is assumed that there is no spacer after the nozzle.
3.2.2. Tool Bar of the Test Module
When the Excel spreadsheet “Test” is activated, a floating tool bar “Lenses Test” as shown in will popup on the spreadsheet in Windows based Excel. This tool bar is very similar to the design tool bar, except that the Design (![]() ) button is replaced by the Test (
) button is replaced by the Test (![]() ) button. Once the Test button is clicked, the Calculator carries out evaluation of the lens system. The More (
) button. Once the Test button is clicked, the Calculator carries out evaluation of the lens system. The More (![]() ) and Help (
) and Help (![]() ) buttons have the same functions as those in the design tool bar. The Reset (
) buttons have the same functions as those in the design tool bar. The Reset (![]() ) button, however, resets the spreadsheet of the Test Module to a default test of lenses e by CitationLiu et al. (1995). Similar to the Design Module, the Test spreadsheet has four fix buttons
) button, however, resets the spreadsheet of the Test Module to a default test of lenses e by CitationLiu et al. (1995). Similar to the Design Module, the Test spreadsheet has four fix buttons ![]() ,
, ![]() ,
, ![]() , and
, and ![]() , which are equivalent to the
, which are equivalent to the ![]() ,
, ![]() ,
, ![]() and
and ![]() buttons in the toolbar, respectively.
buttons in the toolbar, respectively.
3.2.3. Results of the Test Module
The content of the Test Module results is exactly the same as that of the Design Module. An example of the test results corresponding to the inputs in is shown in . Note that the spacer length and inner diameter listed in the results are the suggested values instead of the user input value. However, the beam width and transport efficiencies are calculated according to the user input spacer dimensions.
Note that the performance estimations might be slightly different between Design Module and the Test Module even for the same inputs. These differences arise mainly from small errors when iteratively solving for pressure or flowrate and when interpolating the parameterized equations for the contraction factors and losses. Small differences also exit in some cases between the two input methods (pressure or flowrate) of the Test Module for the same reasons.
3.3. Warning Messages and Error Handling
The Calculator provides the following warning messages when the input is not valid or the Calculator cannot find a solution.
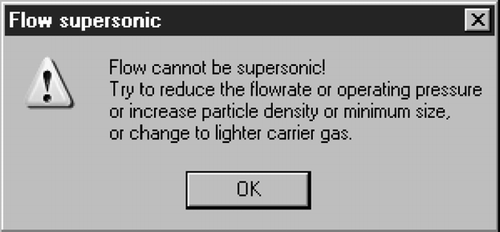
| 1. | Flow is supersonic. Flow through lenses (except the inlet orifice and the nozzle) is constrained to be subsonic. However, when the user specified flowrate or operating pressure is too high, supersonic flow may happen. In this case, the error message shown in will pop up, and the calculation is suspended. The following adjustments can be made to solve this problem:
| ||||||||||||||||||||||||||||||||||||||||
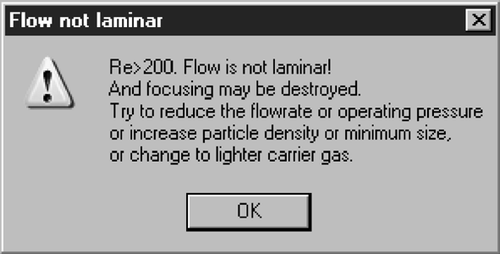
| 2. | Flow is not laminar. Flow through lenses (except the inlet orifice) needs to be laminar to prevent turbulent dispersion of the particle beam. In this calculator, the non-laminar flow error message as shown in will pop up when the flow Reynolds number at any of the orifices (except the inlet orifice) is greater than 200. Although the Calculator will continue the calculation, the user should be aware of the potential deterioration of the beam quality. One can use the same methods as those in overcoming supersonic flow to make flow laminar. | ||||||||||||||||||||||||||||||||||||||||
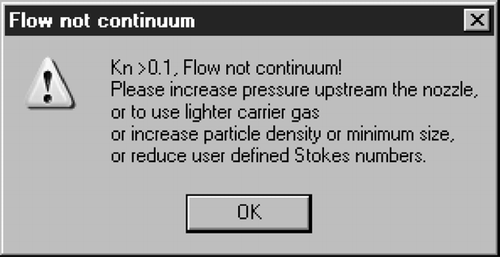
| 3. | Flow is not continuum. It is required that flow through the lens system (upstream of the vacuum chamber) is continuum. Non-continuum flow will occur when the operating pressure is too low. The non-continuum flow warning message shown in will pop up when the flow Knudsen number at any orifices is larger than 0.1. The solutions to this continuum flow violation are:
| ||||||||||||||||||||||||||||||||||||||||
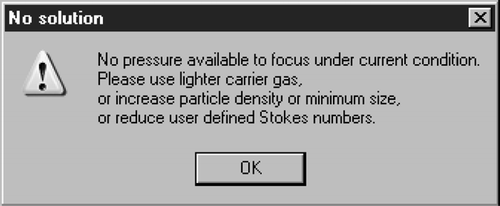
| 4. | Solution cannot be found. When an operating pressure cannot be found because the molecular weight of the carrier gas is too high or the particle size is too small (e.g., to optimally focus 5 nm in air, as shown in in CitationWang et al. (2005a), a no-solution warning message as shown in will pop up. The solutions to this problem are:
| ||||||||||||||||||||||||||||||||||||||||
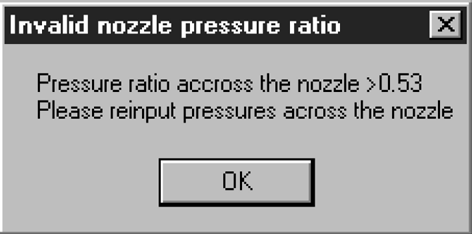
| 5. | Nozzle is not choked. Under typical operating conditions, the accelerating nozzle of a lens system needs to be choked. This restriction is to make sure that particles are accelerated to high velocities and that the pressure downstream of the nozzle is kept low so that particles have long enough stopping distances to reach the downstream destination (a skimmer, substrate or detection chamber, etc.). This warning message is given when the nozzle is not choked (see ). The user must change the pressure drop across the nozzle to create a choked flow. | ||||||||||||||||||||||||||||||||||||||||
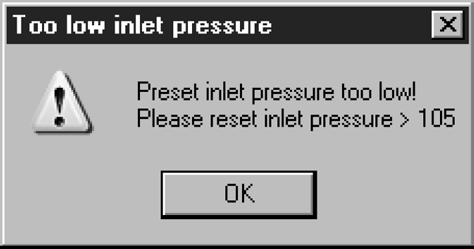
| 6. | Inlet pressure is too low. In the Design Module, when the user specified inlet pressure is lower than the pressure before the nozzle plus the pressure drop at each stage, this warning message will pop up, as shown in . The user has to increase the inlet pressure to a high enough value. There are other warning messages which are mainly related to a non-numerical input in a cell where a number is required. It is straightforward to fix these errors and we will not explain in detail. | ||||||||||||||||||||||||||||||||||||||||
4. PROGRAM LOGIC OF THE LENS CALCULATOR
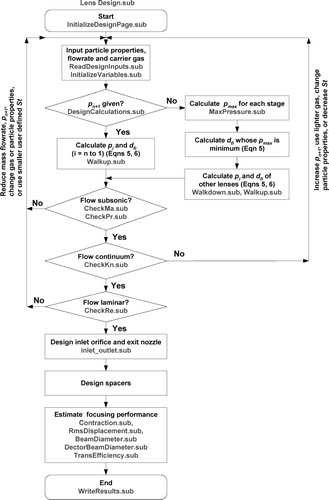
shows the flow chart of the lens Design Module. The design process starts with reading in the user input information of carrier gas, several operating parameters, particle density and the focusing size range. Then the program calculates the operating pressure and dimensions of the lens system: orifice diameters and the length and inner diameter of spacers. Finally, the program estimates the three major performance parameters: size dependent particle terminal axial velocity, beam width, and transmission efficiency. The flow through lenses is always forced to be laminar, continuum, and subsonic.
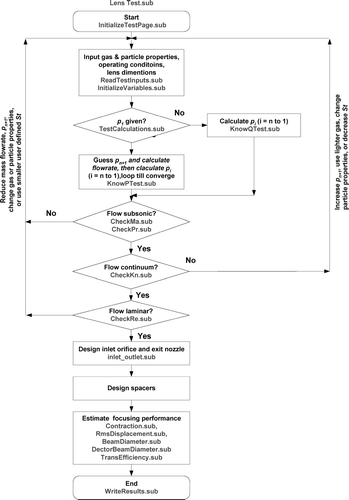
The lens test module is very similar to the design module except that the lens dimensions are specified by the user as well. The flow diagram of the program logic and the corresponding main subroutines are shown in .
5. OTHER COMMENTS
In this manual we described how to use the Aerodynamic Lens Calculator and its program logic. More detailed explanation of variables and subroutines can be found the program source code itself. The Visual Basic source code can be accessed from Excel Menu Tools\Macro\Visual Basic Editor or by simply use keyboard shortcut Alt + F 11. Find the Project Explore in the Visual Basic Editor. Locate the VBAProject corresponding to your Excel file name corresponding to the design tool, and double click “ThisWorkbook.” The source code will now appear on the screen. Users are welcome to modify the source code to meet their needs. We would appreciate learning about such changes so that we can incorporate them in the “Calculator” for others to use.
This software is free to the public. Because only a few lens designs have actually been built and carefully tested in the laboratory, we recognize that not all lenses designed using this calculator might function as predicted. Of course, we cannot take responsibility for such failures of this design tool. However, we would like to learn about them so that we can incorporate what has been learned from the work of others when preparing updated versions of this software.
supplementary files aerodynamic lens calculator manual.zip
Download Zip (149.2 KB)REFERENCES
- Liu , P. , Ziemann , P. J. , Kittelson , D. B. and McMurry , P. H. 1995b . Generating Particle Beams of Controlled Dimensions and Divergence: II. Experimental Evaluation of Particle Motion in Aerodynamic Lenses and Nozzle Expansions . Aerosol Sci. Technol. , 22 ( 3 ) : 314 – 324 . [CSA]
- Rader , D. J. 1990 . Momentum Slip Correction Factor for Small Particles in Nine Common Gases . J. Aerosol Sci. , 21 ( 2 ) : 161 – 168 . [CROSSREF] [CSA]
- Wang , X. , Kruis , F. E. and McMurry , P. H. 2005a . Aerodynamic Focusing of Nanoparticles: I. Guidelines for Designing Aerodynamic Lenses for Nanoparticles . Aerosol Sci. Technol. , 39 ( 7 ) : 611 – 623 . [CROSSREF] [CSA]
- Wang , X. , Gidwani , A. , Girshick , S. L. and McMurry , P. H. 2005b . Aerodynamic Focusing of Nanoparticles: II. Numerical Simulation of Particle Motion through Aerodynamic Lenses . Aerosol Sci. Technol. , 39 ( 7 ) : 624 – 636 . [CROSSREF] [CSA]
- Wang , X. and McMurry , P. H. 2006 . A Design Tool for Aerodynamic Lens Systems . Aerosol Sci. Technol. , Accepted[CSA]
