Abstract
The stream-wise vibration effect of a fibrous filter is studied experimentally and numerically for the purpose of evaluating filtration efficiency. The particle sizes range from 0.02 to 10 μ m and the face velocity ranges from 3 to 10 cm/s. The vibrational peak velocity also varied from 0 to 50 cm/s. The filtration efficiency for this wide size range is obtained by combining the individual test results for fine particles (0.02 to 0.5 μ m) and large particles (0.5 to 10.0 μ m). For the fine particle experiment, Arizona Road Dust (ARD) test particles are generated by an atomizer after an ultrasonic process and measured by a Scanning Mobility Particle Sizer (SMPS). For the large particle experiment, the test particles are generated by a fluidized bed and measured by an Aerodynamic Particle Sizer (APS). When the particles are generated by the atomizer after ultrasonicating, the majority of the particles are in nano scale without the agglomerates on the large particle surface, while particles generated by the fluidized bed are mostly in micro-scale because many nanoparticles are agglomerated on large particle surface. The filtration efficiency increases with the vibrational peak velocity in the impaction-dominant region (D p > 0.1 μ m) and diffusion-dominant region (D p < 0.1 μ m), due to the increased relative velocity between the particle and the filter fiber and the increased diffusion intensity from turbulence around the fiber, respectively. A model for the filter vibration effect is established with a modified Stokes number for the impaction-dominant region and an empirical analysis for the diffusion-dominant region.
1. INTRODUCTION
Most of the current filtration theories and experimental works are based on stationary working conditions. However, in the real world, most filters are operated under certain vibrational conditions such as in an automobile engine intake filtration system, HVAC system filtration, passenger vehicle cabin filtration, hard-disk drive air filtration and so on. There are few theoretical and experimental studies published for the effect of vibration on the performance of air filtration. Therefore, the study for the filter vibration effect will improve the overall evaluation of a filter's performance in real situations.
CitationWang (2001) set up a filter vibration system to evaluate the filtration efficiency under a filter oscillating condition (0–400 Hz) and studied the effect of the filter vibration on the filtration efficiency for large particles (> 2 μ m). He found that the filtration efficiency of the large particles is proportional to the vibration frequency and the vibration acceleration due to the inertial impaction between the particles and the filter media. He also found that filter vibration does not cause any particle shedding from lightly loaded filter media. CitationLam and Dai (2002) investigated the flow around a circular cylinder undergoing sinusoidal oscillating movement in still water and found that the vorticity around the vibrating cylinder causes an increase of turbulent diffusivity which is proportional to the maximum vibrational speed. CitationAlonso et al. (2001) investigated an aerosol penetration through a wire screen for nanoparticles and suggested an empirical equation to model particle deposition due to turbulent diffusion based on the Peclet and Reynolds numbers. CitationDouglas and Ilias (1988) investigated that an aerosol deposition on a cylinder in turbulent cross flow can be explained with eddy diffusion as the prime mechanism, and CitationFu and Tong (2002) showed that the diffusivity around an oscillating cylinder is proportional to the oscillating frequency and amplitude of the cylinder. CitationLee and Liu (1982) established a filtration model for a fibrous filter and many researchers have modified it for their applications.
The purpose of this study is to investigate the stream-wise vibration effect of a commercial glass fiber filter on the filtration efficiency for a wide range of particle sizes and to establish a model of the filter vibration effect using the single fiber filtration efficiency equations.
2. EXPERIMENT
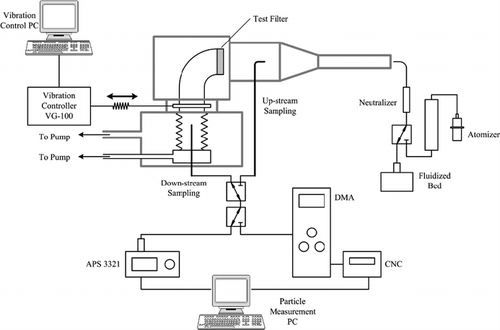
shows the experimental apparatus for the filter vibration test. It consists of a particle generation system, a filtration efficiency test system, a filter vibration control system, and a particle concentration measurement system. In this study, the filtration efficiencies for fine particles (0.02 μ m < Dp < 0.5 μ m) and for coarse particles (0.5 μ m < Dp < 10 μ m) were tested independently, and then the results were combined for a wide range evaluation of the filtration efficiency. An atomizer was used to generate the fine particles and a fluidized bed was used to generate the coarse particles. A scanning mobility particle sizer (SMPS, TSI 3022) and an aerodynamic particle sizer (APS, TSI 3321) were used in measuring the particle concentration for the fine particle test and the coarse particle test, respectively. The filtration efficiency was calculated by measuring particle concentration upstream and downstream of the test filter. The test filter holder was vibrated by an electrodynamic vibration generator (VG-100, VTS) controlled by a PC with digital sine vibration controller software (DSC-1, B&W Eng.). Due to the limitation of the measurable size range of SMPS (0.02 to 0.5 μ m) and APS (0.37 to 20 μ m), the filtration efficiency for the size range from 0.02 to 10 μ m must be combined from the test results of fine and coarse particles. For the fine particle test, the test particles are generated by the atomizer after the ultrasonic process and measured by the SMPS, and then the test particles are generated by the fluidized bed and measured by the APS for the large particle test.
FIG. 1 Schematic diagram of the filter vibration test system.
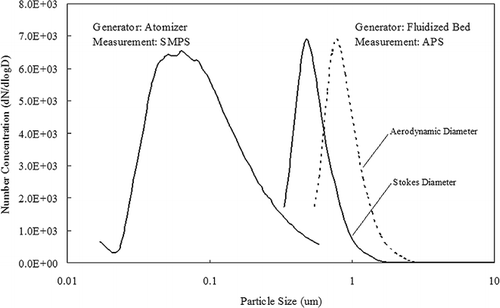
shows the size distributions of the ARD test particle generated by the atomizer and the fluidized bed. We cannot compare the measurements from the SMPS and APS directly because they measure different particle diameters. The SMPS measures the particle's Stokes diameter from the particle dynamics with an electrostatic force and an inertial force. On the other hand, the APS calculates the particle's aerodynamic diameter by measuring the particle's time-of-flight in an accelerated air flow. Therefore, before combining the individual results, the two systems need to be unified for the wide range of filtration efficiencies. For this reason, the aerodynamic diameter presented by the APS for the large particle test is converted into the Stokes diameter by dividing by the square root of the particle density (2.65 g/cc). The dotted line is the Stokes diameter calculated from the aerodynamic diameter measured by the APS to show the same particle size with the SMPS result. As shown in the results, the particle size generated by the atomizer is much smaller than that generated by the fluidized bed. This is because the test particles with the atomizer are broken down and generated as primary particles using an ultrasonic process, while the particles by the fluidized bed are generated as an agglomerated particles.
FIG. 2 Size distributions of ARD generated by an atomizer and a fluidized bed.
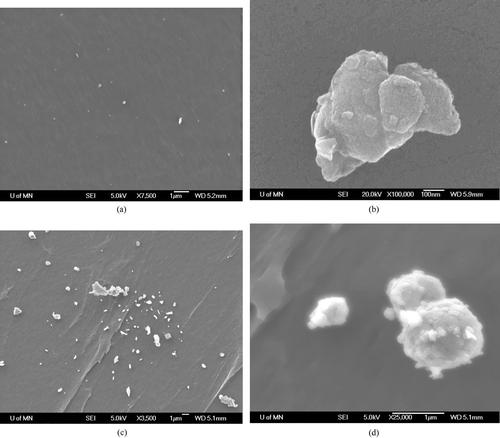
shows the SEM photographs of the ARD test particles generated by the atomizer and the fluidized bed. When the particles are generated by the atomizer after ultrasonicating for 30 minutes, the majority of the particles are in the nano scale as shown in , and even the large particles do not have small particle agglomerates on the surface as shown in . On the other hand, particles generated by the fluidized bed are mostly in the micro-scale as shown in , and many nanoparticle agglomerates can be seen on the large particle surface as .
FIG. 3 SEM photographs of ARD generated by an atomizer (a), (b) and by a fluidized bed (c), (d).
3. RESULTS AND DISCUSSION
3.1 Filtration Efficiency
shows the filtration efficiency as a function of wide range particle size for different face velocities. For the large particles, high face velocity shows higher filtration efficiency because the dominant filtration mechanism for large particles is impaction, which is proportional to the face velocity. However, the filtration efficiency for the fine particles decreases with the increasing face velocity because the dominant mechanism for fine particles is diffusion, which is inversely proportional to the face velocity. Higher face velocities will decrease the particle resident time through the filter.
FIG. 4 Filtration efficiency as a function of particle size for different face velocities.
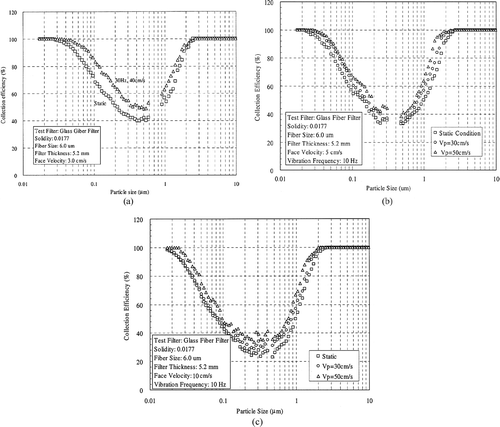
shows the results for the filtration efficiency test as a function of vibrational peak velocity, which is the maximum velocity in the cycle for the various face velocities. As shown in the results, the filtration efficiency increased with the increasing vibrational peak velocity for both the impaction-dominated part (Dp > 0.1 μm) and the diffusion-dominated part (Dp < 0.1 μ m) due to the increase of the relative velocity between the particle and the filter fiber, and due to the increase of the diffusion intensity by turbulent behavior around the fiber.
FIG. 5 Filtration efficiency for different vibration peak velocities (a) Vf = 3 cm/s; (b) Vf = 5 cm/s; (c) Vf = 10 cm/s.
3.2 Modeling for the Filter Vibration
In general, the fibrous filter filtration is very complicated, and the filtration efficiency of a fibrous filter can be derived only by analyzing the particle collection on an individual fiber. The overall filtration efficiency can be expressed as follows (CitationZhu et al. 2000),
There are five basic mechanisms by which an aerosol particle can be deposited onto a filter fiber: interception, inertial impaction, diffusion, gravitational settling, and electrostatic attraction. In this study, interception, inertial impaction, and diffusion are only considered in analyzing the single fiber collection efficiency. This is because that electrostatic attraction can be neglected by using a neutralizer right after the particle generation and the gravitational effect is negligible in a horizontal flow condition (CitationHinds 1999). Therefore, the single fiber efficiency can be simplified with three main mechanisms as follows,
Effect of the Filter Vibration on the Diffusion
shows the single fiber efficiency as a function of Peclet number for the various face velocities without any filter vibration. The single fiber efficiency by diffusion, ηd, can be expressed as a straight line for the log-log plot with the Peclet number in x-axis. Both the slope and y-intersect depend on the turbulent diffusivity that increases the particle deposition on the filter fiber. As shown in , the flow Reynolds numbers for each test are in the Stokes regime (Ref < 1); therefore, there is no turbulent diffusivity and each result shows the same straight line.
shows the single fiber efficiency for the various face velocities (Vf) and vibration peak velocities (Vp) that cause various turbulent diffusivity of the particles around the filter fiber stimulating the particle deposition on the fiber. Different vibration test results in the different straight lines and the modeling of the vibration effect for the diffusion-dominated region can be empirically established as follows,
FIG. 6 Single fiber efficiency as a function of Peclet number for the static conditions with various face velocities.
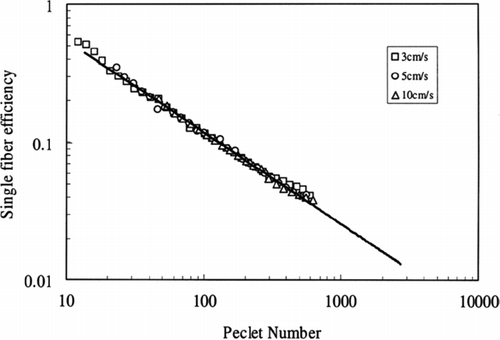
FIG. 7 Single fiber efficiency as a function of Peclet for the various vibration conditions (a) 10 Hz; (b) 30 Hz.
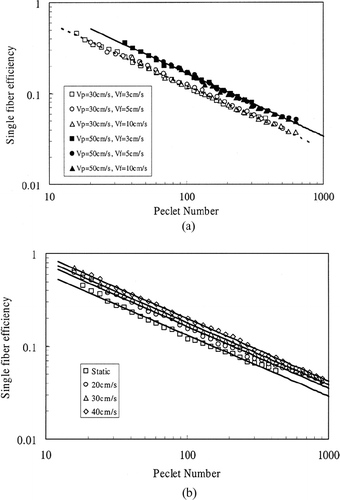
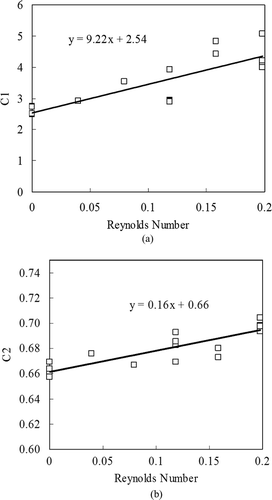
FIG. 8 The constants (a) C1 (r2 = 0.9323) and (b) C2 (r2 = 0.9344) of Equation (Equation7).
Effect of the Filter Vibration on the Impaction
As shown in Equation (Equation5), the single fiber filtration efficiency by the particle impaction is expressed with the Stokes number, which is affected only by the relative velocity of a particle with respect to a fiber in a filter vibration condition. Therefore, the single fiber filtration efficiency by the particle impaction is analyzed by considering the relative velocity of the particle caused by filter vibration.
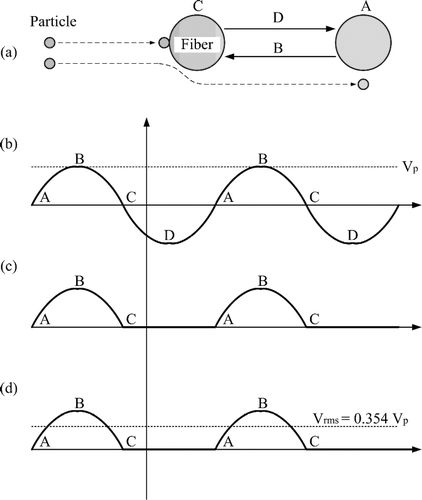
shows the deposition mechanism by a particle impaction to a vibrating filter fiber. As shown in the figure, the fiber is vibrating in sinusoidal motion (), and some particles are deposited on a fiber by the inertial impaction due to the relative velocity between the particle and the fiber. On the other hand, once a particle passes a vibrating fiber, the particle may not have a chance to meet the fiber again. Therefore, the backward movement (C → D → A) of the fiber does not play any role on the particle collection (). The Root Mean Square (RMS) of the vibration velocity, which represents the average velocity of the vibrating object, can be calculated from the half period of the sinusoidal motion (). The modified Stokes number for the particle collection by the vibrating fiber can be expressed as follows,
FIG. 9 Vibration effect on the particle impaction deposition.
Comparison of the Experimental Results with the Model
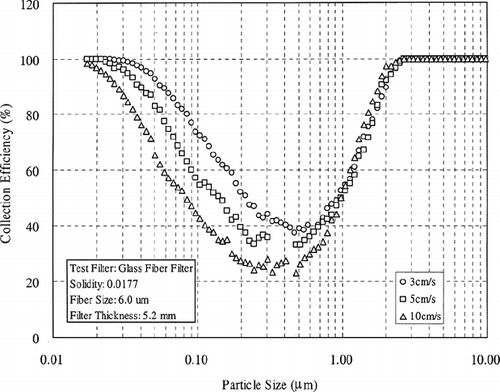
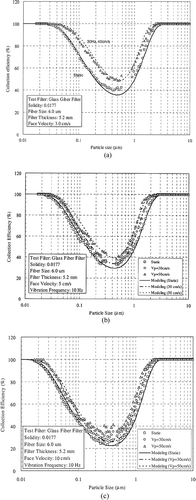
shows the experimental results compared with the model for the particle collection efficiency by the stream-wise vibrating filter. As mentioned before, the modeling is performed with the empirical Peclet number analysis for the diffusion-dominant region and with the modified Stokes number analysis for the impaction-dominant region. The test filer is a glass fiber filter with the solidity of 0.0177, the average fiber diameter of 6.0 μ m, and the thickness of 5.2 mm. The face velocities are varied from 3 to 5 cm/s, and the vibrational peak velocities are up to 50 cm/s. As shown in the result, the filter vibration modeling is in good agreement with the experimental result for the various vibration conditions.
FIG. 10 Comparison between experimental results and the modeling for the various vibration conditions (a) Vf = 3 cm/s; (b) Vf = 5 cm/s; (c) Vf = 10 cm/s.
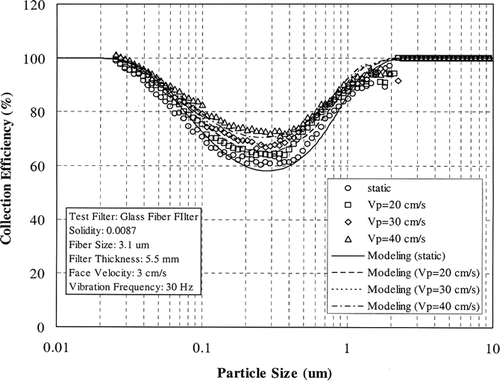
shows the results of comparison for a different test filter media which has the solidity of 0.0087, the average fiber diameter of 3.45 μ m, and the thickness of 4.7 mm. These results coincide with each other, showing that the filtration efficiency increases with the increasing vibrational peak velocity over all the particle sizes. With these results, the filtration efficiency under the vibration conditions can be expected by a modified Stokes number analysis for the impaction-dominant region and an empirical Peclet number analysis for the diffusion-dominant region.
FIG. 11 Comparison between the experimental results and the modeling results for the different test filter.
CONCLUSION
In this article, the experimental and modeling studies of the filter vibration effect on the filtration efficiency have been conducted for the commercial HVAC glass fiber filter. The filtration efficiency of the particle sizes from 0.02 to 10 μ m is obtained by combining the individual test results for fine particles (0.02 to 0.5 μ m) and large particles (0.5 to 10 μ m). Nano-sized ARD test particles can be generated by the atomizer using the ultrasonic process due to the separation from large particles, while nano-sized particles are deposited on and move with large particles when generated by the fluidized bed. From the test results, the filtration efficiency increases with the filter vibration velocity both in the impaction-dominant region (Dp > 0.1 μ m) and in diffusion-dominant region (Dp < 0.1 μ m) due to the increased relative velocity between the particle and the filter fiber and due to the increased diffusion intensity from turbulence around the filter fiber. The modeling of the filter vibration effect is established with a modified Stokes number analysis for the impaction-dominant region and an empirical Peclet number analysis for the diffusion-dominant region. The filter vibration modeling is in good agreement with the experimental results for the various vibration conditions and various test filters.
This work was supported by the Post-doctoral Fellowship Program of Korea Science & Engineering Foundation (KOSEF) and Center for Filtration Research in University of Minnesota.
REFERENCES
- Alonso , M. , Alguacil , F. J. and Nomura , T. 2001 . Turbulent Deposition of Aerosol Nanoparticles on a Wire Screen . J. Aerosol Sci. , 32 : 1359 – 1367 . [CSA]
- Douglas , P. L. and Ilias , S. 1988 . On the Deposition of Aerosol Particles on Cylinder in Turbulent Cross Flow . J. Aerosol Sci. , 19 : 451 – 462 . [CROSSREF] [CSA]
- Fu , W. and Tong , B. 2002 . Numerical Investigation of Heat Transfer from a Heated Oscillating Cylinder in a Cross Flow . Int. J. Heat and Mass Trans. , 45 : 3033 – 3043 . [CROSSREF] [CSA]
- Hinds and William , C . 1999 . Aerosol Technology: Properties, Behavior, and Measurement of Airborne Particles. , p. 182 New York : John Wiley & Sons .
- Lam , K. M. and Dai , G. Q. 2002 . Formation of Vortex Street and Vortex Pair from a Circular Cylinder Oscillating in Water . Exp. Ther. Fluid Sci. , 26 : 901 – 915 . [CROSSREF] [CSA]
- Lee , K. W. and Liu , B. Y. H. 1982 . Theoretical Study and Aerosol Filtration by Fibrous Filters . Aerosol Sci. Technol. , 1 : 147 – 161 . [CSA]
- Wang , H. 2001 . Design of an Experimental Setup to Study the Performance of Air Filter Media Under Vibration Conditions and Preliminary Data , Ph.D. Thesis University of Minnesota .
- Zhu , C. , Lin , C. and Cheung , C. S. 2000 . Inertial Impaction-Dominated Fibrous Filtration with Rectangular or Cylindrical Fibers . Powder Technol. , 112 : 149 – 162 . [CROSSREF] [CSA]