An inhalation exposure system and operating protocol were developed that resulted in consistent achievement of targeted exposure concentrations of hardwood smoke without compromising the desire to include multiple phases of a burn cycle. A conventional, noncatalyzed stove was operated in a temperature-controlled room with a three-phase (kindling, high burn, and low burn) cycle. Equally sized wood of similar moisture content was loaded in a consistent fashion each day of the study. A stable and controllable dilution system was employed that involved simultaneous withdrawal of smoke from a primary dilution tunnel. Exposure operators utilized real-time measurements of particulate matter (PM), CO, and stove temperature, along with operational experience, to gauge when adjustments to dilution air or the firebox were necessary. Dilutions of smoke were controlled in four separate inhalation atmospheres with daily average particle mass concentrations of 30, 100, 300, and 1000 μg/m3. Each of these atmospheres was characterized in detail, including gas, semivolatile, and particle phases. Gas phase hydrocarbons were composed mostly of carbonyls (especially furans) and acids (especially low molecular weight aliphatic acids). Several classes of gas-phase semivolatile organics were measured, with the highest proportions of material in classes of polycyclic aromatic hydrocarbons and methoxy phenols. The particle phase was primarily organic carbon (> 90%) with small amounts of ions, elements, and black carbon. Approximately 15% of the organic carbon was identified and quantified, with the largest contribution of material from sugars and sugar derivatives.
INTRODUCTION
The National Environmental Respiratory Center (NERC) was established to conduct laboratory research that improves our understanding of the contributions of individual air contaminants and their combinations to the health effects associated with exposures to complex air pollution mixtures. The NERC research strategy (described at http://www.nercenter.org) includes the conduct of a series of inhalation toxicology studies (laboratory exposures of rodents) of common source emissions having different, but overlapping, compositions. Both the composition of the exposure atmospheres and a range of health effects are measured in detail using identical protocols, and the results are compiled into a composition-concentration-health response database that will be utilized for statistical and other exploration of the data. The first NERC study, termed “Contemporary Diesel Emissions” (circa 2000), has been completed and the composition (CitationMcDonald et al. 2004) and several health responses have been reported (CitationHarrod et al. 2003, Citation2005; CitationCampen et al. 2003; CitationReed et al. 2004; Barrett et al. 2004). The generation and characterization of exposures for the second study, hardwood smoke (HWS), are described here. The health responses are being reported in separate articles.
Typical inhalation exposure systems rely on a steady and reproducible production of a test material (e.g., HWS) that can be set and maintained at a target concentration (or dilution). In these types of systems, continuous monitoring by an appropriate technique can be used to give system operators feedback to maintain dilutions. This approach is complicated when the test material is produced in variable concentrations throughout an exposure period, such as emissions from diesel engines operated on a transient cycle as reported for the first NERC study (CitationMcDonald et al. 2004). In that study the engine cycle was continuously repeated every 20 min. Because the cycle was reproducible, the system operator could utilize averages of measurements of particulate matter (PM) obtained over several repeating cycles (e.g., three, repeated 20-min cycles gave a 1 h sample, the total exposure time was 6 h) to monitor the dilutions. A similar approach was taken in a wood smoke study (using pinyon pine), reported by CitationTesfaigzi et al. (2002), where several PM measurements (approximately every 10–30 min over a 6-h period) were utilized to adjust dilutions. In that study, smoke was generated in a single operating mode, with wood being continuously added throughout the exposure period and the stove operated with the air intake at a constant setting. Because of the variability in wood emissions during that study, operation of the system was labor intensive and the result showed considerable variability in the exposure concentrations. Others have attempted to produce a more stable wood smoke atmosphere by burning aerosolized wood shavings in a flow-through furnace (CitationZelikoff et al. 2002). An approach that eliminated fluctuations in wood smoke concentration would be desirable from an operational standpoint, but would not be representative of the true variations in the composition of wood smoke as it is predominantly generated and exists in the environment.
The HWS study was designed to include multiple phases (kindling, low, and high burn rates) of a single burn cycle during each 6-h exposure day. The goal was to have simultaneous dilutions (yielding daily integrated average PM concentrations of 30, 100, 300, 1000 μ g/m3) that could be reproduced from day to day, despite the complication of variability throughout each burn phase. A further complication was the day-to-day variability. Variability in wood stove emissions can be linked to several factors, including the configuration and operation of the stove, burn rate, type of wood, moisture of wood, configuration of flue, draft on flue, and barometric pressure (CitationMcCrillis et al. 1989, Citation1990). An approach was developed that minimized the impact of these factors, including standardization of the burn cycle, enclosure of the flue in the same building as the stove with a fixed draft across the top of the flue, and maintenance of homogenously sized and split wood stored in a cold room (10–15°C) under controlled conditions.
Exposure atmosphere composition in the exposure chambers was assessed as described previously (CitationMcDonald et al. 2001, Citation2004). The approach included assessments of PM concentration and composition; particle number count and size distribution; elements (metals and associated analytes); inorganic sulfate, nitrate, and ammonium; PM organic and elemental carbon ([EC] also termed as black carbon); and speciated organic compounds (including alkanes, alkenes, alkynes, cycloalkanes/cycloalkenes, furans, phenols, sugars, acids, carbonyls, volatile aromatic compounds, polycyclic aromatic hydrocarbons [PAH], oxygenated PAH, hopanes, and steranes). Gaseous NH3, NOx, SO2, CO, and CO2 were also measured. Several of the components were semivolatile organic compounds (SVOCs) that existed simultaneously in the gas and particle phase. Because this characterization resulted in thousands of compositional data points, it is not practical to publish the data in their entirety. Instead, this article describes the experimental methodology and summarizes major findings. The entire data set for the study is available on the NERC web site (http://www.nercenter.org).
METHODS
Wood Smoke Generation and Exposures
Construction of the system and procedures for operating the appliance were modeled, in part, after the U.S. Environmental Protection Agency's (EPA) Method 28A, “Standards of Performance for New Stationary Sources; New Residential Wood Heaters; Final Rule” (CitationU.S. EPA 1988), and the Washington State Uniform Building Code Standard 31-2. The final design of the system is shown in . The design and operation of the system are described below.
Figure 1 Schematic of woodstove, flue, dilution/transit lines, and exposure chamber for conducting inhalation exposures to hardwood smoke. Note that four exposure levels were used, and only one chamber is shown for illustration.
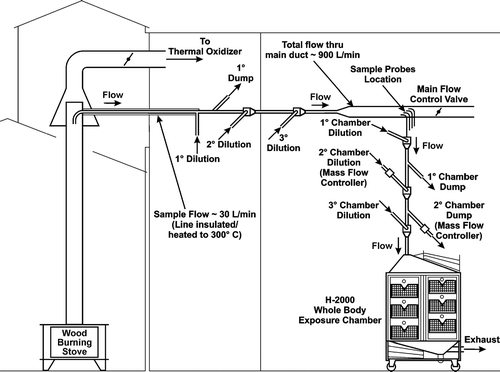
HWS was generated by burning a mix of hardwood (genus Quercus, species mixed and not specified by vendor) in a noncertified wood stove (Pineridge Model 27000; Heating Energy Systems, Inc., Clackamas, OR) having a 0.06-m3 firebox and a customized sliding gate air intake damper. A custom damper was developed because the stock damper had an automatic valve that would open and shut the damper based on temperature at the front of the stove box. Over time, this automatic damper did not operate correctly and was replaced with a manual damper that would allow better control of the system. The dimensions of the fabricated damper were 1.5 cm × 6.5 cm.
The stove was isolated in an ∼ 55-m2 building that was temperature controlled between 18–32°C throughout the study by filtered forced-air cooling (in the summer). Seasoned hardwood that was uniformly split (∼ 50 cm × 8 cm) from rounds and included bark was obtained from a private vendor located in Potosi, Missouri. Upon arrival, the moisture content of ∼ 10 sentinel pieces of wood was measured with a calibrated electrical resistance moisture meter (J-2000; Delmhorst® Instruments, Towaco, NJ). The moisture (20–25% dry weight) was maintained throughout the course of the study by storing the wood in a temperature-(∼ 15°C) and humidity-controlled (∼ 90%) room.
The stove was operated over a three-phase burn cycle that spanned the 6-h exposure period. The fire was started (which initiated exposures) with unprinted/unbleached newspaper (end-rolls obtained from Albuquerque Journal, Albuquerque, NM) and hardwood (same wood type used for entire test) split into small (e.g., 5–10 cm in width) pieces. The three burn phases included kindling (∼ 15–20 min), a high burn rate (∼ 90 min with ∼ 4–6 kg of wood), and a low burn rate (remainder of exposure period with an additional ∼ 4–6 kg of wood) controlled by the air intake damper. For the high burn rate, the sliding damper was open (maximum air intake) and then closed down to an aperture of ∼ 0.3 × 6.5cm during the low burn cycle. The burn rate (loss of wood mass/time) was measured during the exposure period by a platform scale (Mountain Scales, Inc., Denver, CO) that the stove was placed on. Transition from kindling to high burn to low burn was based on a combination of the approximate time interval described above. Through a series of prestudy testing and evaluations, it was determined that at those time points ∼ 75% of the wood mass had been burned.
The flue was a 15.2-cm triple-wall insulated solid pack steel chimney, extending ∼ 3 m from the platform scale, that transitioned into a double-walled chimney up to a height of ∼ 4m. The top of the flue was maintained in an enclosed space and had a 60-cm (cross-sectional diameter) shroud located around the top 20 cm that maintained constant flow of air across the top of the stack. This shroud maintained a flow sufficiently high to exhaust the majority of the wood smoke to a waste smoke oxidizer while maintaining the draft induced on the wood stove below 0.02 cm of water measured when the stove was not operating. A minor portion of the smoke was extracted for transfer to the dilution tunnel at a flow rate of ∼ 30 L/min with a 2.5-cm probe located ∼ 30.5cm from the top of the flue. This 180-cm line was maintained at approximately 300°C to minimize water condensation and thermophoretic particle losses during transit. At the termination of the heated line, a series of several dilution and air bypass legs served to quickly dilute the smoke down to ∼ 20–23°C. Dilution was conducted with outside air maintained at ∼ 20°C after being scrubbed by passage through HEPA and charcoal-impregnated pre-filters to remove particles and volatile organics. At the primary dilution point, the smoke traveled through a 5-cm diameter line for 4 m before it expanded to a 15.2-cm line, where the flow rate was approximately 900 L/min.
At a location 7.6 m from the flue extraction point, four parallel probes of diameters ranging from 0.6 cm outer diameter (OD) for the low exposure chamber to 2.5 cm O.D. for the high chamber were used to extract smoke for transfer to the chambers. The range in probe diameters allowed maintenance of similar flow velocities at all of the extraction points even though volumetric extraction flows varied from approximately 10–100 L/min. After extraction from the main dilution plenum, the diameter of each transfer line expanded to 5 cm. Each transfer line had additional dilution and bypass air for further dilution. Mass flow controllers that were interfaced into the computer monitoring system controlled the final dilution/bypass air on each chamber. The transfer lines from the 15.2-cm dilution plenum to the exposure chambers were ∼ 5 m long. Because of practical considerations, the lengths of the transfer lines were similar, but not identical. The small variations in the length of the transfer lines (up to 2 m) translated to differences in transit time among exposure levels of only fractions of a second.
Exposures were conducted in 2-m3 flow-through exposure chambers (H2000, Hazleton Systems, Maywood, NJ). Material passed through these chambers at approximately 500 L/min, yielding a material residence time within the chamber of about 4 min. These chambers were designed to enhance the uniformity of the distribution of test material. The spatial variation of the HWS PM within these chambers was determined to be less than 10% when determined as previously described (CitationMcDonald et al. 2001). The exposures included five treatment groups: four exposed to different dilutions of HWS and one to clean air as a control.
The system dilutions were based on 6-h average target concentrations of 30 (low), 100 (mid-low), 300 (mid-high), and 1000 (high) μ g/m3 HWS PM. At the highest exposure level, the dilution from the flue was determined to be ∼ 300:1 by measuring CO directly from the flue and in the exposure chamber. Because the system was on a three-phase burn cycle, the concentrations inside the exposure chambers varied throughout each exposure period. As a result, the primary emphasis of the exposure system operator was to maintain targeted dilution splits among the exposure groups (e.g., 3:1 difference in dilution between the mid-low and mid-high levels). These splits were monitored by a combination of real-time PM and CO, determined as described below.
Exposure Characterization
Detailed assessment of the composition of the exposure atmospheres at all exposure levels, including quality assurance and quality control, was conducted as described in detail previously (CitationMcDonald et al. 2004). Because of practical constraints, detailed assessments were only conducted periodically (e.g., three times per exposure level) throughout the course of the study. summarizes the measurements, collection technique, measurement technique, and analysis allocation (several of the samples were analyzed by collaborating laboratories). Gravimetric mass was measured from each exposure level each day of the study. Carbon monoxide and total hydrocarbons were measured 5–10 times per exposure level, and the remaining measurements were made approximately three times per exposure level. Methods are described briefly below, with particular attention to methods that differed slightly from those reported previously (CitationMcDonald et al. 2004).
TABLE 1 Summary of exposure atmosphere characterization measurements and measurement conditions
Gas Phase
Concentrations of CO were determined using a photoacoustic gas analyzer (Innova 1312; California Analytical Instruments, Irvine, CA). Real-time CO was measured simultaneously in each exposure atmosphere with a modified chemical cell detector (Langan CO measurer; Langan Instruments, San Francisco, CA). The real-time data was utilized by the exposure operator (along with PM measurements) as an indicator of dilution. The chemical cell was purchased directly from Langan and placed in a flow-through capsule immediately downstream of the filters utilized for determining PM. Total NOx were measured using a chemiluminescent analyzer (Model 200A NOx Analyzer; Pollution Instruments, San Diego, CA). Both NOx and CO analyzers were calibrated prior to each study using National Institute of Standards and Technology traceable standards. Techniques for the collection and analysis of SO2, NO3 −/SO4 −2, and NH4+ have been described elsewhere (CitationChow et al. 1998).
Speciated gas phase organic compounds were determined by mass spectrometric (MS) analysis of samples (alkyne, alkane, alkene, aromatic, furan) collected in electropolished canisters, trapped on KOH impregnated filters (acids), or trapped on dinitrophenylhydrazine-(DNPH)-impregnated silica gel cartridges (for carbonyl and dicarbonyl). Canister samples were analyzed by gas chromatography (GC)/MS, and both KOH impregnated filters and DNPH cartridges were analyzed by liquid chromatography-diode array-MS.
Particle Mass
PM was collected on 47-mm Teflon impregnated glass fiber (T60A20; Pall-Gelman, East Hills, NY) filters. Pre-and post-exposure filter weights were measured gravimetrically immediately prior to and after exposures using a Mettler MT5 microbalance located in the exposure laboratory. Over the 6-h exposure duration, filter samples were collected hourly (60-min samples) from the two highest exposure levels and three times (120-min samples) from the two low levels. One filter sample per day was collected from the control chamber. PM is reported as the total PM measured in the exposure chambers. HWS PM is the total PM minus the PM measured in the control chamber. Although air flowing through the control chamber was filtered, small amounts of PM (0–15 μ g/m3) were measured in the control chamber due to the presence of the rodents. Assuming that the rodent contribution to PM was the same in each exposure chamber, the control PM value was subtracted from the exposure chamber PM to yield HWS PM.
Because filter-based PM data were utilized for monitoring and controlling PM concentrations during exposures, it was not practical to equilibrate the filters prior to and after sampling in a conditioning chamber at a specified temperature and humidity. Some samples were taken to assess the difference in measured PM concentration after filter conditioning for 24 h at 23°C and 40% relative humidity prior to and after sampling, and results did not differ by more than 10%.
To characterize the potential vapor artifact on the PM measurement, several samples were collected where either an XAD-4 coated concentric vapor denuder was placed upstream of the Pallflex filter or a TefloTM filter (Pall-Gelman) was used. The vapor denuder serves to remove vapors prior to contact with the filters to prevent or reduce vapor adsorption artifacts. In each case, the alternative PM measurement was collected simultaneously and at the same flow rate as the Pallflex filter.
Real-time PM was measured using a Model 8520 DustTrak photometer (TSI, Inc., Minneapolis, MN) to assess system stability and serve as an indicator of chamber concentration in order to adjust dilutions for achieving the target mass concentration. The DustTrak response was calibrated for HWS PM by making simultaneous gravimetric measurements and deriving a correction factor for the DustTrak response based on filter weights.
PM Composition
For PM composition (not including speciated organics and metals), samples were collected on Pallflex 47-mm diameter, heat treated, pre-baked (to remove contaminant organic carbon) quartz-fiber filters. Following collection, one-half of the filter was extracted in water and the extract was analyzed for NO3–/SO4–2 by ion chromatography and NH4 + by colorimetry (CitationChow et al. 1998). On the second half of the filter, organic carbon (OC) and EC content were analyzed by the IMPROVE thermal/optical reflectance method described by CitationChow et al. (1993). To convert the measured OC response to organic matter (OM), a correction factor of 1.4 was applied. This correction factor takes into account noncarbon elements such as hydrogen and oxygen that are not measured by the analytical technique but contribute to the mass of PM. Although other conversion factors that apply to wood smoke have been proposed (e.g., CitationTurpin and Lam 2001), this conversion factor yielded good agreement between the sum of measured species and total particle mass in this study. The same conversion (1.4) also yielded good comparisons with gravimetric mass in other wood smoke emission characterization studies (CitationMcDonald et al. 2000). Elements were determined in acid digestions of Teflo filters by inductively coupled plasma (ICP)-MS and ICP-optical emission spectroscopy (for Si and S) as described by CitationMcDonald et al. (2004).
Vapor-phase SVOCs and particle-phase organic compounds were collected by two separate techniques: (1) a XAD-coated denuder (vapor phase) followed by a Teflon-coated glass-fiber filter/polyurethane foam/XAD-4/polyurethane foam cartridge (particle phase) and (2) a Teflon-coated glass-fiber filter (particle phase) followed by the polyurethane foam/XAD-4/polyurethane foam cartridge (vapor phase). Both approaches were used because the techniques have complementary performance characteristics. The denuder, when conditions are appropriate, yields the best operational definition of the vapor-particle split because the vapor phase is removed before it can adsorb to the filter. In addition, when the denuder is used the back-up sorbent is counted as particle-phase, effectively correcting for desorption of particle-phase components from the filter to the sorbents.
In addition to several potential limitations of technique 1 reported by CitationKamens et al. (1999), the denuder does not function properly if it is overloaded with material that saturates the active sorbent sites, leading to breakthrough of vapor-phase SVOCs to the filters. Technique 2 has a higher collection capacity, but is subject to positive (adsorption of vapor-phase to filter) and negative (desorption of particle organics from the filter) artifacts. The data reported here are from technique 2 (filters = particle-phase and sorbent = vapor-phase). Technique 1 revealed inconsistent results in gas-particle partitioning (showed breakthrough), and had poor scaling between exposure levels because (due to limited sample capacity) the samples were taken at specific times during the burn cycle, not over the entire three-phase burn cycle. Technique 2 was collected over the entire burn cycle, and showed good scaling between different exposure levels.
Prior to extractions, samples were spiked with a range of deuterated or 13C-labeled internal standards that included PAH, alkanes, phenols, acids, and sugar derivatives (detailed list described in CitationMcDonald et al. 2004). The denuder was extracted and analyzed separately from the filter cartridge to allow direct quantification of the portions in the vapor and particle phase. Filter and sorbent cartridge extractions were conducted in a MARS-X microwave extractor. Two sequential extractions were conducted: dichloromethane (for filters) or 90:10 hexane:ether (for sorbent cartridge) followed by acetone. After extraction, samples were concentrated by rotoevaporation to ∼4 mL and further concentrated to ∼0.5 mL under a gentle stream of nitrogen. Samples were then split and either analyzed by GC/MS directly (neutral and nonpolar compounds) or analyzed after being derivitized by either silation (sugar derivatives and sterols) or methylation (acids) as described previously (CitationMcDonald et al. 2004).
Particle Size
Particle size was measured using a ten-stage micro-orifice-uniform deposit impactor ([MOUDI]; MSP Corp., Minneapolis, MN). The impactor was operated at a flow rate of 30 L/min, providing particle size data from 0.05–10 microns in aerodynamic diameter. The chemical composition was assessed for impaction stages with cutpoints below 5.6 μ m (50% cut-off point) as described previously by CitationKleeman et al. (2000) and CitationMcDonald et al. (2002). The larger sizes were not analyzed, both because they accounted for a very small amount (< 3%) of the mass and because they are not in the respirable size range of a rodent. The top MOUDI stages (down to 5.6 μ m) were lightly greased to collect any larger particles that could have bounced and created positive artifacts at lower stages. The stages at 3.16, 1.78, 1.00, 0.54, 0.37, 0.148, 0.105, and 0.054 μ m were used without grease, with a quartz-fiber (same type used for carbon analysis described below) after-filter to collect particles smaller than 0.054 μ m. PM to be analyzed for OM/BC and inorganic ions was collected on pre-baked aluminum substrates, and samples for metal analysis were collected on pre-cleaned (CitationMcDonald et al. 2004) Teflon membrane filters. Analysis of these samples is described in the following sections.
Particle number size distribution was measured using a scanning mobility particle sizer ([SMPS]; Differential Mobility Analyzer Model 3080, Condensation Particle Counter Model 3025, TSI, Inc.). The SMPS was operated at a sample flow rate of 0.3 L/min and a sheath flow rate of 3 L/min. SMPS scans were collected several times throughout each exposure day at each exposure level. The total scan time was 3 min. Because the particle size changes throughout each phase of a burn cycle, the SMPS scans are partially skewed because not all particle sizes could be measured simultaneously.
RESULTS
gives two examples (at high exposure level) of real-time traces of PM during the three-phase burn cycle. As expected, the PM concentrations fluctuated throughout the day according to the burn cycle, and the highest concentrations in the chamber were observed during the low burn rate phase. also illustrates that there was variability in each phase from day to day. Both of the examples shown resulted in average PM concentrations of 1000 μ g/m3. Because of this, characterizations were conducted multiple times at each exposure level to ensure that the range and magnitude of the variability of individual constituents were characterized. gives data from measurements taken on three separate days for CO, THC, several organic compounds along with calcium and iron. These were all obtained from the High exposure level on days where the particle mass concentrations were within 20% of the 1000 μ g/m3 target. Overall there was reasonable agreement from day to day, especially for CO and THC, which were present in the highest concentrations. The components that were present in low concentrations (e.g., ng/m3-μg/m3) were the most variable from day to day. The composition of the HWS at each exposure level is given in and . Note the average PM concentrations were within 10% of the target at all exposure levels. In addition, the standard deviation shows that the day-to-day variability in average PM concentrations was low. Including over 9 months of continuous operation, over 90% of the exposure days were within 15% of the target PM exposure concentration at all exposure levels. Not shown here, but comparing the TEFLO (Teflon membrane) with the Pallflex (Teflon-coated glass fiber) revealed little to no difference in the measured particle mass concentration. In addition, measurements of wood smoke PM with a vapor denuder up-stream resulted in an ∼ 20% decrease in measured PM, suggesting that vapor adsorption accounted for approximately this much of the mass on filter.
Figure 2 Real-time particle mass concentration during two separate operations of the three-phase burn cycle. Both of these resulted in an average particle mass concentration of approximately 1 mg/m3.
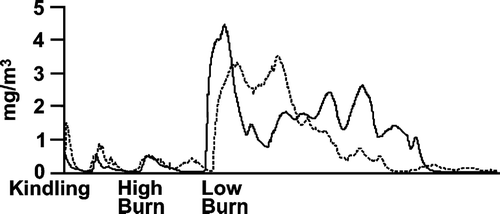
Figure 3 Concentration of total hydrocarbons (THC), carbon monoxide (CO), and several minor components of the wood smoke atmosphere obtained from the High exposure chamber on three separate days. The individual data are averages integrated over a 6-h burn cycle. In general, the trace components showed the most variability in concentration from day to day.
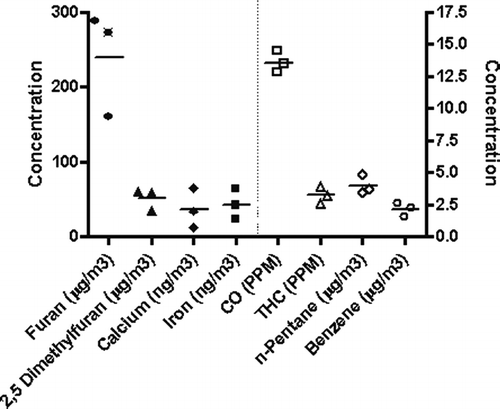
Figure 4 Summary composition (by weight percent) of clean air, and four exposure levels of hardwood smoke.
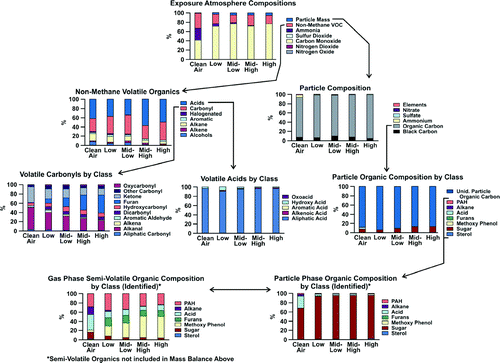
TABLE 2 Summary of hardwood smoke exposure atmosphere composition
The gaseous portion of HWS in these exposure atmospheres was composed of gaseous CO (max of ∼ 13 ppm at high exposure level) and volatile organics (max of ∼ 3 ppm at high exposure level), with low to nondetectable concentrations of NOx and SO2. The volatile organics were almost entirely composed of carbonyls (∼30% of volatile organic compounds [VOC]) and acids (∼60% of VOC). The single largest class within the carbonyls were the furans (∼ 40% of total carbonyl), which were dominated by 2-methyl furaldehyde. Other carbonyls in large abundance included methyl-ethyl-ketone, acetone, and acetaldehyde. Acids were almost entirely (90%) composed of aliphatic compounds, mostly due to the large abundance (∼1.5 mg/m3 at high level) of acetic acid.
The fractional abundance of the primary PM constituents (EC, OM, NO3 −/SO4 −2, NH4 +, metals) showed that PM was composed of nearly 100% OM at all exposure levels. Fifteen percent of this OM was able to be quantified and attributed to specific analytes as described below. In the clean air control, the OM likely consisted of a combination of rodent dander and exhaled organic vapor that adsorbed onto the quartz filter and was measured as organic carbon. Electron microscopic analysis (not shown here) revealed that the HWS PM was primarily composed of amorphous and spherical organic droplets. Because of their volatility, it was not possible to obtain suitable electron micrographs of the HWS PM because the analyses are obtained under vacuum that smears the PM. In addition to OM, there was ∼ 5% EC and 2–3% metals and other elements. The most abundant elements were calcium, potassium, and zinc, with small (< 100 ng/m3 at high exposure level) but detectable amounts of iron and aluminum.
As expected based on laboratory and field studies of the composition of wood smoke (CitationRowell 1984; CitationRogge et al. 1998; CitationMcDonald et al. 2000; CitationSchauer et al. 2001; CitationFine et al. 2002), the HWS OM contained substantial concentrations of sugars (aribinose, xylose), sugar derivatives (especially levoglucosan), and methoxylated phenols. PAHs were present in HWS; however, they only accounted for a small total portion of the exposure atmosphere (less than 0.5% of PM).
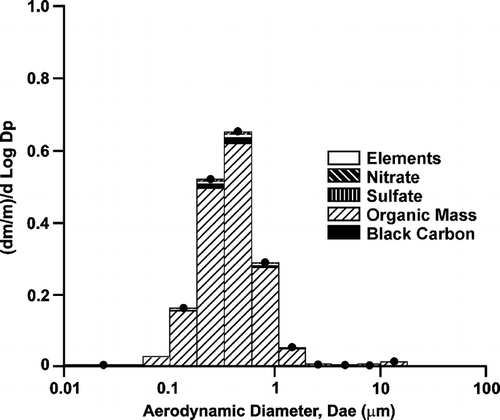
PM in the HWS exposure showed particle sizes from 0.25–0.35 μ m median diameter, with the largest particle size observed at the lowest dilution (highest concentration). The slightly larger size with lower dilution was somewhat expected, as similar observations were reported for differences in particle size with dilution for diesel exhaust (CitationReed et al. 2004). Mass distributions are presented as the fractional mass amount (dm/m total) for each incremental size range. Because the MOUDI stages were 50% cut-off points and there was mass on each stage that overlapped in size from the higher and lower cut points, aerodynamic diameters are represented as the geometric mean between impactor cut points. shows the particle size by composition for a sample collected from the high exposure level. The particle size by composition mirrored the overall PM composition, mostly composed of OM across the entire size range. The elements and inorganic ions were not observed below ∼ 0.2 μ m or above 1 μ m. They were distributed relatively evenly between 0.2 and ∼ 1.0 μ m.
Figure 5 Size-selective chemistry of hardwood smoke sampled from the high exposure level (1 mg/m3 particle mass).
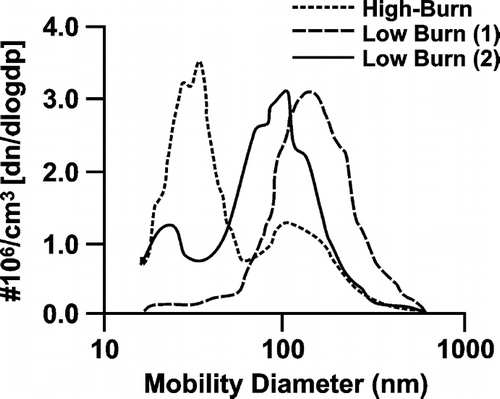
Particle number size distribution, as previously reported by CitationHays et al. (2002), changes throughout different portions of the wood smoke cycle. shows three sample particle number scans obtained from the mid-high exposure level at different portions of the burn cycle. Median particle number diameters spanned from approximately 20–150 nm, depending on the burn conditions. The three particle sizes were obtained from different portions of the high and low burns. In general, the smaller particle sizes were observed during high burn conditions where more oxidative burn conditions likely occurred. The larger particle sizes were observed during the low burn conditions.
Figure 6 Representative particle number size distribution scans from different points in the burn cycle. In general, smaller particle sizes were observed during high burn (higher oxygen) conditions.
DISCUSSION
Overall, the composition at all exposure levels was consistent with results of previous studies that have characterized emissions from wood smoke in the laboratory or field (CitationHillis 1962; CitationCommins 1969; CitationRowell 1984; CitationMcCrillis et al. 1989; CitationRogge et al. 1998; CitationMcKenzie et al. 1994; CitationMcDonald et al. 2000; CitationSchauer et al. 2001; CitationFine et al. 2002). The characteristic composition of wood smoke is derived from the structure of wood, which is approximately 60–70% cellulose (sugars such as pentose, arabinose) bound together by lignin (methoxylated phenols) polymers. Wood (all plants) also includes several elements, especially calcium, potassium, zinc, and iron that are all functioning elements in living systems (e.g., calcium/potassium important for osmotic balance in plants). During combustion wood is decomposed and distilled to produce large proportions of sugar/lignin derivatives and some metals (elements). In the gas-phase furans, carbonyls/dicarbonyls, and methoxyphenol derivatives were observed in this study, as was previously reported in hardwoods by CitationMcDonald et al. (2000). Sugars and sugar derivatives such as arabinose and levoglucosan along with primarily the syringol (2,6-methoxyphenol) lignin derivatives accounted for large portions of the particle phase. Also observed as part of the particle phase were several sterols (including phytosteroids such as β -sitosterol as well as α -tocopherol [Vitamin E]).
While variability in emissions are inherently characteristic of wood burning cycles, and are desirable to include in an average exposure to wood smoke, variations in the average emissions rates from day to day pose several problems for conducting repeated controlled exposures. In this study, an exposure system and operating protocol was developed that resulted in consistent achievement of targeted exposure concentrations without compromising the desire to include multiple phases of a burn cycle. The system kept a constant small draw on the flue by keeping it enclosed in a custom built cupola. The stove was operated in a temperature-controlled room to ensure that the temperature did not change throughout the duration of the study. Equally sized wood of similar moisture content was loaded in a consistent fashion each day of the study. A stable and controllable dilution system was employed that involved simultaneous withdrawal of smoke from a primary dilution tunnel. Lastly, the exposure operators utilized real-time measurements of PM, CO, and stove temperature, along with operational experience, to gauge when adjustments to dilution air or the firebox were necessary. By monitoring stove temperature, the system operator was able to follow the combustion conditions each day, and make adjustments to the wood loading or slight adjustments to the damper (during low burn phase) to ensure similar combustion temperature profiles were achieved daily. Overall, all of these steps resulted in consistent exposure concentrations of PM throughout the study without compromising the inclusion of multiple burn phases.
This work was supported by the National Environmental Respiratory Center, which was funded by numerous industry, state, and federal sponsors, including the U.S. Environmental Protection Agency, U.S. Department of Energy, and U.S. Department of Transportation. This manuscript does not represent the views or policies of any sponsor. The exposure system was operated and data were collected by Mark Gauna and Richard Mossman. Ben Myren, of Myren Consulting, Inc. (Colville, WA), assisted in the development and characterization of the burn cycle.
Related Research Data
REFERENCES
- Campen , M. J. , McDonald , J. D. , Gigliotti , A. P. , Seilkop , S. K. , Reed , M. D. and Benson , J. M. 2003 . Cardiovascular Effects of Inhaled Diesel Exhaust in Spontaneously Hypertensive Rats . Cardiovasc. Toxicol. , 3 ( 4 ) : 353 – 361 . [INFOTRIEVE] [CSA]
- Chow , J. C. , Watson , J. G. , Pritchett , L. C. , Pierson , W. R. , Frazier , C. A. and Purcell , R. G. 1993 . The DRI Thermal/Optical Reflectance Carbon Analysis System: Description, Evaluation and Applications in U.S. Air Quality Studies . Atmos. Environ. , 27A : 1185 – 1201 . [CSA]
- Chow , J. C. , Zielinska , B. , Watson , J. G. , Fujita , E. M. , Richards , L. W. , Neff , W. , Dietrich , D. and Hering , S. 1998 . Northern Front Range Air Quality Study, Volume A: Ambient Measurements. , Santa Rosa, CA : Prepared for Colorado State University by Desert Research Institute, Reno, NV, and Sonoma Technology, Inc. .
- Commins , B. T. 1969 . Formation of Polycyclic Aromatic Hydrocarbons during Pyrolysis and Combustion of Hydrocarbons . Atmos. Environ. , 3 ( 5 ) : 65 – 77 . [CSA]
- Fine , P. M. , Cass , G. R. and Simoneit , B. R. 2002 . Chemical Characterization of Fine Particle Emissions from the Fireplace Combustion of Woods Grown in the Southern United States . Environ. Sci. Technol. , 36 ( 7 ) : 1442 – 1451 . [INFOTRIEVE] [CSA] [CROSSREF]
- Harrod , K. S. , Jaramillo , R. J. , Rosenberger , C. L. , Wang , S. Z. , Berger , J. A. , McDonald , J. D. and Reed , M. D. 2003 . Increased Susceptibility to RSV Infection by Exposure to Inhaled Diesel Engine Emissions . Am. J. Respir. Cell Mol. Biol. , 28 : 451 – 463 . [INFOTRIEVE] [CSA] [CROSSREF]
- Harrod , K. S. , Jaramillo , R. J. , Berger , J. A. , Gigliotti , A. P. , Sielkop , S. and Reed , M. D. 2005 . Inhaled Diesel Engine Emissions Reduce Bacterial Clearance and Exacerbated Lung Disease to Pseudomonas aeruginosa Infection in vivo . Toxicol. Sci. , 83 : 155 – 165 . [INFOTRIEVE] [CSA] [CROSSREF]
- Hays , M. D. , Geron , C. D. , Linna , K. J. , Smith , N. D. and Schauer , J. J. 2002 . Speciation of Gas-Phase and Fine Particle Emissions from Burning of Foliar Fuels . Environ. Sci. Technol. , 36 : 2281 – 2295 . [INFOTRIEVE] [CSA] [CROSSREF]
- Hillis , W. E. 1962 . Wood Extractives , New York : Academic Press .
- Kamens , R. M. , Fan , Z. , Myosoen , J. , Odum , J. , Hu , J. , Coe , D. , Zhang , J. , Chen , S. and Leach , K. 1999 . “ The Use of Denuders for Semivolatile Characterization Studies in Outdoor Chambers ” . In Gas and Particle Phase Measurements of Atmospheric Organic Compounds , Edited by: Lane , D. A. pp. 333 – 367 . Amsterdam : Overseas Publishers Association .
- Kleeman , M. J. , Schauer , J. J. and Cass , G. R. 2000 . Size and Composition Distribution of Fine Particulate Matter Emitted from Motor Vehicles . Environ. Sci. Technol. , 34 : 1132 – 1142 . [CSA] [CROSSREF]
- McCrillis , R. C. , Leese , K. E. and Harkins , S. M. 1989 . Effects of Burn Rate, Wood Species, Moisture Content and Weight of Wood Loaded on Woodstove Emissions , Research Triangle Institute (EPA Project Officer: McCrillis, Air and Energy Engineering Research Lab, RTP, NC 27711) . U.S. Environmental Protection Agency Contract 68-02-3992, EPA/600/2-89/025, Work Assignments 7 and 37
- McCrillis , R. C. and Burnet , P. G. 1990 . Effects of Burn Rate, Wood Species, Altitude, and Stove Type on Woodstove Emissions . Toxicol. Ind. Health , 6 : 95 – 102 . [INFOTRIEVE] [CSA]
- McDonald , J. D. , Zielinska , B. , Fujita , E. M. , Sagebiel , J. C. , Chow , J. C. and Watson , J. G. 2000 . Fine Particle and Gaseous Emission Rates from Residential Wood Combustion . Environ. Sci. Technol. , 34 ( 11 ) : 2080 – 2091 . [CSA] [CROSSREF]
- McDonald , J. D. , Costanzo , J. , Barr , E. B. , Mauderly , J. L. , Schauer , J. J. , Zielinska , B. , Sagebiel , J. C. , Chow , J. C. , Grosjean , D. and Grosjean , E. Characterization of Laboratory Exposure Atmospheres for Health Effects Studies, Published by CD-ROM . Proceedings of Air and Waste Management Annual Conference . June 24–28 2001 , Orlando, FL.
- McDonald , J. D. , Zielinska , B. , Sagebiel , J. C. and McDaniel , M. R. 2002 . Characterization of Fine Particle Material in Ambient Air and Personal Samples from an Underground Mine . Aerosol Sci. Technol. , 36 ( 11 ) : 1033 – 1044 . [CSA] [CROSSREF]
- McDonald , J. D. , Barr , E. B. , White , R. K. , Chow , J. C. , Schauer , J. J. , Zielinska , B. and Grosjean , E. 2004 . Generation and Characterization of Four Dilutions of Diesel Engine Exhaust for a Subchronic Inhalation Study . Environ. Sci. Technol. , 38 ( 9 ) : 2513 – 2522 . [INFOTRIEVE] [CSA] [CROSSREF]
- McKenzie , L. M. , Hao , W. M. , Richards , G. N. and Ward , D. E. 1994 . Quantification of Major Components Emitted from Smoldering Combustion of Wood . Atmos. Environ. , 28 ( 20 ) : 3285 – 3292 . [CSA] [CROSSREF]
- Reed , M. D. , Gigliotti , A. P. , McDonald , J. D. , Seagrave , J. C. , Seilkop , S. K. and Mauderly , J. L. 2004 . Health Effects of Subchronic Exposure to Environmental Levels of Diesel Exhaust . Inhal. Toxicol. , 16 : 177 – 193 . [INFOTRIEVE] [CSA] [CROSSREF]
- Rogge , W. F. , Hildemann , L. M. , Mazurek , M. A. , Cass , G. R. and Simoneit , B. R. T. 1998 . Sources of Fine Organic Aerosol: 9. Pine, Oak and Synthetic Log Combustion in Residential Fireplaces . Environ. Sci. Technol. , 32 : 13 – 22 . [CSA] [CROSSREF]
- Rowell , R. 1984 . The Chemistry of Solid Wood, Advances in Chemistry Series , Washington, D.C. : American Chemical Society .
- Schauer , J. J. , Kleeman , M. J. , Cass , G. R. and Simoneit , B. R. 2001 . Measurement of Emissions from Air Pollution Sources. 3. C1–C29 Organic Compounds from Fireplace Combustion of Wood . Environ. Sci. Technol. , 35 ( 9 ) : 1716 – 1728 . [INFOTRIEVE] [CSA] [CROSSREF]
- Tesfaigzi , Y. , Singh , S. P. , Foster , J. E. , Kubatko , J. , Barr , E. B. , Fine , P. M. , McDonald , J. D. , Hahn , F. F. and Mauderly , J. L. 2002 . Health Effects of Subchronic Exposure to Low Levels of Wood Smoke in Rats . Toxicol. Sci. , 65 : 115 – 125 . [INFOTRIEVE] [CSA] [CROSSREF]
- Turpin , B. J. and Lam , H. J. 2001 . Species Contributions to PM2.5 Mass Concentrations: Revisiting Common Assumptions for Estimating Organic Mass . Aerosol Sci. Technol. , 35 ( 1 ) : 602 – 610 . [CSA]
- U.S. EPA (U.S. Environmental Protection Agency) . 1988 . Standards of Performance for New Stationary Sources; New Residential Wood Heaters: Final Rule. 40 CFR Part 60 , Vol. 53(38) , Washington, DC : Federal Register .
- Zelikoff , J. T. , Chen , L. C. , Cohen , M. D. and Schlesinger , R. B. 2002 . The Toxicology of Inhaled Woodsmoke . J. Toxicol. Environ. Health B. Crit. Rev. , 5 ( 3 ) : 269 – 282 . [INFOTRIEVE] [CSA] [CROSSREF]