The size and composition of ambient airborne particulate matter is reported for winter conditions at five locations in (or near) the San Joaquin Valley in central California. Two distinct types of airborne particles were identified based on diurnal patterns and size distribution similarity: hygroscopic sulfate/ammonium/nitrate particles and less hygroscopic particles composed of mostly organic carbon with smaller amounts of elemental carbon. Daytime PM10 concentrations for sulfate/ammonium/nitrate particles were measured to be 10.1 μ g m−3, 28.3 μ g m−3, and 52.8 μ g m−3 at Sacramento, Modesto and Bakersfield, California, respectively. Nighttime concentrations were 10–30% lower, suggesting that these particles are dominated by secondary production. Simulation of the data with a box model suggests that these particles were formed by the condensation of ammonia and nitric acid onto background or primary sulfate particles. These hygroscopic particles had a mass distribution peak in the accumulation mode (0.56–1.0 μ m) at all times. Daytime PM10 carbon particle concentrations were measured to be 9.5 μ g m−3, 15.1 μ g m−3, and 16.2 μ g m−3 at Sacramento, Modesto, and Bakersfield, respectively. Corresponding nighttime concentrations were 200–300% higher, suggesting that these particles are dominated by primary emissions. The peak in the carbon particle mass distribution varied between 0.2–1.0 μ m. Carbon particles emitted directly from combustion sources typically have a mass distribution peak diameter between 0.1–0.32 μ m. Box model calculations suggest that the formation of secondary organic aerosol is negligible under cool winter conditions, and that the observed shift in the carbon particle mass distribution results from coagulation in the heavily polluted concentrations experienced during the current study. The analysis suggests that carbon particles and sulfate/ammonium/nitrate particles exist separately in the atmosphere of the San Joaquin Valley until coagulation mixes them in the accumulation mode.
INTRODUCTION
Particles released directly from a source (primary PM) have a characteristic size and composition distribution that is determined by the generating mechanism (CitationHildemann et al. 1991; CitationKleeman et al. 1999; CitationKleeman et al. 2000; CitationAllen et al. 2001; CitationWingfors et al. 2001; CitationMcDonald et al. 2003; CitationSturm et al. 2003; CitationHays 2004; CitationLaschober et al. 2004; CitationMcDonald et al. 2004; CitationShah et al. 2004). Once in the atmosphere, the particle size and composition distribution can be modified by chemical reactions, condensation/evaporation of semi-volatile species, coagulation with other particles, activation during high humidity, wet deposition, and dry deposition. Some of these processes will be more important than others in a typical urban/regional system, and a comprehensive set of size and composition distribution measurements is needed to identify these dominant mechanisms. The purpose of the current study is to identify the mechanisms that shape the airborne particle size and composition distribution in a range of environments in central California, including an urban area, a remote inland environment, and a remote coastal environment. The measured particle size and composition distribution at 5 distinct locations has been analyzed during 107 sample events spanning 2 months. The variation of particle size and composition distributions have been examined as a function of time and location. A box model that includes each of the processes described above has been employed at each site to identify the dominant transformation mechanisms.
BACKGROUND
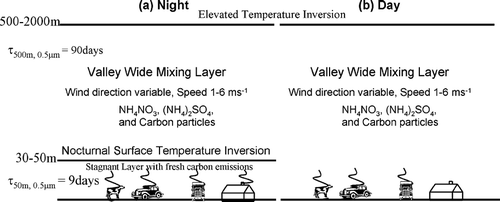
The San Joaquin Valley (SJV) in central California routinely experiences some of the highest airborne particulate matter concentrations found in the United States (CitationLehrman et al. 1995; CitationChow et al. 1996; CitationMagliano et al. 1999; CitationStockwell et al. 2000; CitationWatson et al. 2000; CitationWatson et al. 2002). During the wintertime, a high-pressure system often remains over central California for several days to several weeks. This high-pressure system is characterized by elevated temperatures aloft coupled with low wind speeds and low pressure gradients between the SJV and neighboring airsheds (CitationWatson et al. 1998). These conditions create strong atmospheric temperature inversions in the SJV below 850 mb, effectively capping the valley by preventing the mixing of pollutants above a certain height (usually 500–2000 m). During a typical diurnal cycle, a second strong temperature inversion forms immediately next to the earth's surface at night as the ground radiates energy and cools the atmosphere from below. Primary pollutants emitted at night are trapped in this shallow surface layer (usually 30–50 m deep), leading to high concentrations at ground level during the evening hours. Secondary pollutants produced in the shallow surface layer are usually depleted at night because the removal rate exceeds the amount of secondary material that can be produced in the shallow volume. On the following day, the atmosphere is typically heated from below by solar radiation incident on the ground, breaking down the nighttime stagnation layer and mixing pollutants up to the height of the elevated temperature inversion (below 850 mb). The ground level concentration of primary pollutants usually decreases in the daytime because the emissions are mixed into a larger volume. The ground level concentration of secondary pollutants usually increases during the daytime because the sun drives photochemical reactions and a greater volume of the atmosphere is available to produce secondary material that can reach the ground level. illustrates the night (panel a) and day (panel b) phases of this diurnal cycle.
FIG. 1 Typical diurnal cycle of atmospheric mixing in the SJV. (a) During the night a ground-based temperature inversion forms a shallow stagnant surface layer where primary pollutants are concentrated and secondary pollutants are depleted (assuming removal exceeds production). A mixed valley-wide layer exists above this ground-based inversion where primary concentrations are constant and secondary concentrations may increase due to continuous production. (b) During the day, the ground-based inversion is broken by solar radiation, mixing the pollutants trapped in the surface layer up to the height of the elevated temperature inversion. Note that the majority of residential wood combustion occurs at night.
The concentration as a function of time C 1(t) for a non-reactive primary pollutant in a system with constant emissions rate E (μ g m−2 min−1), deposition velocity V (m min−1), and mixing height h (m) is given by:
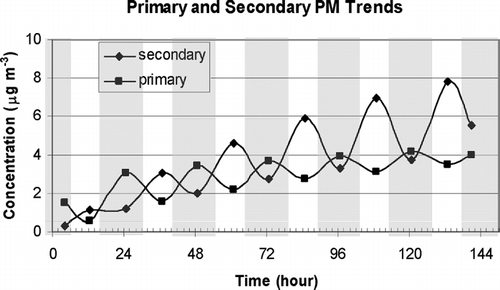
shows the predicted evolution of ground level primary and secondary pollutant concentrations averaged over the daytime (8:00–18:00) and nighttime (18:00–8:00) hours for the simple system illustrated in over a 6-day period. Note that this is not a full model simulation, only a preliminary examination of how a simple system would behave. The calculation assumes a constant primary pollutant emissions rate of 0.5 μ g m−2 min−1, a constant secondary production rate of 0.1 μ g m−3 h−1, a constant deposition velocity of 0.1 m min−1, a daytime mixing depth of 500 m, and a nighttime mixing depth of 50 m. The transition between daytime and nighttime conditions was assumed to occur quickly. Equations (Equation1) and (Equation2) were applied at the beginning of each time period (day or night) to predict the concentrations at the conclusion of that interval. The resulting concentration was then used as the starting point for the next time period. The primary pollutant concentration for this ideal system is higher at night than during the day, and gradually increases throughout the stagnation event. The primary pollutant concentration asymptotically approaches a steady state value of E/V (= 5 μ g m−3 for the current example) with decreasing amplitude between daytime and nighttime concentrations. The secondary pollutant concentration for this ideal system is higher during the day than at night. The daytime secondary pollutant concentration asymptotically approaches a steady state value of Phday/V (= 8.33 μ g m−3 for the current example) while the nighttime concentration asymptotically approaches a steady state value of Phnight/V (= 0.83 μ g m−3 for the current example). Note that daytime and nighttime secondary concentrations do not converge to the same value. These primary and secondary concentration trends continue until the high pressure system causing the elevated temperature inversion moves out of the area. The idealized pollutant concentration pattern shown in is evident in many of the PM10 and PM1.8 concentrations measured at locations in the SJV during winter stagnation events (CitationHerner et al. 2005).
FIG. 2 Average primary and secondary ground-level pollutant concentrations during the day and night for the simple system illustrated in over a 6-day period. The calculation assumes a constant primary pollutant emissions rate of 0.5 μ g m−2 min−1, a constant secondary production rate of 0.1 μ g m−3 h−1, a constant deposition velocity of 0.1 m min−1, a daytime mixing depth of 500 m, and a nighttime mixing depth of 50 m.
Samples for the current study were collected as part of the California Regional Particulate Air Quality Study (CitationWatson et al. 1998). The sampling sites, sample collection methods, analytical methods, QA/QC procedures, and uncertainty calculations have been reported previously (CitationHerner et al. 2005), and so only a brief summary of sampling times and locations is provided here. Sample collection took place during two stagnation events during December 2000–February 2001. Sampling was performed during 15 sampling days broken into four separate periods, called Intensive Operating Periods (IOP's). IOP's 1–3 all took place during a single three week stagnation event lasting from December 15 2000 through January 7 2001. IOP1 took place during December 15–18, IOP2 during December 26–28, and IOP3 during January 4–7. Measurements of 24-h average PM2.5 concentrations made at Bakersfield with a Beta Attenuation Monitor show a steady increase from ∼ 20 μ g m−3 on December 14, 2000 to ∼ 160 μ g m−3 on January 6, 2001. On January 7 a low-pressure system moved in to central California and rain was recorded in the SJV during January 8–12 and again during January 23–25. The measured PM2.5 concentrations during these rain events decreased below 10 μ g m−3 at Bakersfield. Concentrations increased to ∼ 100 μ g m−3 within 5 days after each rain event. IOP4 took place from January 31 to February 3 during a shorter and less intense stagnation event that started on January 28, 2000, and lasted until early February 2001. Temperatures during the IOPs on the valley floor ranged from −5° to 0°C at night and from 15° to 18°C during the day. Relative humidity during the study period reached 80% during the night and fell to 40% or less during the day.
Samples were collected at three urban sites (Bakersfield, Modesto, and Sacramento) and two background sites (Bodega Bay and Sequoia) using filter based samplers (RAAS2.5-400, Andersen Instruments, or equivalent) and Micro-Orifice Uniform Deposit Impactors (MOUDI model 110, MSP Corp.). Bakersfield and Modesto are both located on the floor of the San Joaquin Valley, while Sacramento is located just north of the SJV at the same elevation. Bodega Bay is located on the Pacific coast at sea level, slightly north of San Francisco and west of the SJV, while Sequoia is located in the foothills on the eastern edge of the SJV approximately 415 m above the valley floor. A single daily sample was collected at Bodega Bay and Sequoia over the period 00:00–22:00 Pacific Standard Time (PST). At Bakersfield, Modesto and Sacramento two samples per day were collected: a daytime sample from 10:00–18:00 PST and a nighttime sample from 20:00–08:00 PST (at Sacramento sampling only took place during IOPs 1 and 2). In this study fine PM was defined as particulate matter with aerodynamic diameter smaller than 1.8 μ m (PM1.8), and coarse particulate matter was defined as particles with aerodynamic diameter between 1.8 and 10 μ m. The collected samples were analyzed for water soluble ions using ion chromatography (Dionex DX600) and for organic and elemental carbon using the NIOSH 5040 thermal optical transmittance method (Sunset Laboratory EC/OC Analyzer).
RESULTS
shows the average particle size and composition distribution measured at Bodega Bay during IOPs 1–4. The meteorological conditions strongly affect particle characteristics at this coastal location. A large coarse particle fraction of sodium chloride was observed during periods with onshore winds (, , ), while a mass peak in the accumulation mode (0.56 um–1.0um) dominated by ammonium nitrate was observed during periods with offshore winds (, , ). and show organic compounds (OC), elemental carbon (EC), nitrate, ammonium, chloride, sulfate, sodium, potassium, and calcium in a single combined particle size distribution. , and , group the chemical species that have similar size distributions together. shows sea salt particles, shows ammonium nitrate dominated particles, and , and show carbon dominated particles (including non-seasalt sulfate in ). Measurements have shown that airborne particulate matter is a complex mixture of particles, some of which may have similar aerodynamic diameter but different composition (CitationLiu et al. 2003; CitationPastor et al. 2003). It is likely that the different size distributions illustrated in , , , and 3f are representative of separate externally mixed particle classes.
FIG. 3 Average particle size and composition at Bodega Bay during the current study (IOP1–4) during periods of onshore winds (panels a–c) and offshore winds (panels d–f). N = 15
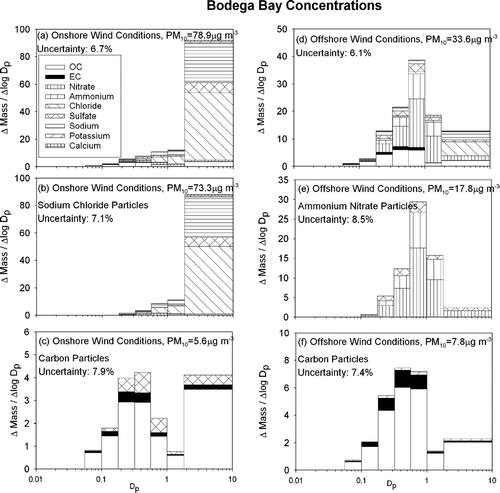
shows that the particle size distribution and chemical constituents at Bodega Bay are completely dominated by sea salt during onshore flow. The coarse particle fraction constitutes the majority of the measured PM10 mass during these conditions. Sodium chloride accounts for 85% of the mass found in the coarse fraction, while sulfate and OC account for 8%, and 4% respectively. Particles smaller than 0.56 μ m aerodynamic diameter have increasingly large fractions of sulfate, nitrate, and carbon. Particles smaller than 0.18 μ m are completely dominated by carbonaceous material. Thirty-five percent of the total particulate carbon was found in the coarse size range during onshore flow conditions, suggesting some process that generates carbonaceous material in the larger particle sizes.
also shows that particle concentrations are significantly lower during offshore flow than during onshore flow, mainly due to changes in the coarse particle size fraction. shows that the mass peak during offshore flow occurs between 0.56–1.0 μ m, and is dominated by ammonium nitrate. shows that organic compounds, elemental carbon, and potassium have a mass peak in the 0.32–56 μ m range (slightly lower than the ammonium-nitrate-sulfate particles). The concentration of carbon particulate matter is greater during offshore flow than during onshore flow.
and show average particle size and composition distributions at Sacramento and Modesto respectively. These two sites are located in the northern part of the SJV (Modesto) or just north of the SJV (Sacramento). The size and composition of airborne particles are similar at these two sites, and they will be discussed together. At both Sacramento and Modesto samples were collected between 10 A.M..–6 P.M.. (day) and 8 P.M..–8 A.M.. (night). , , and , , show daytime size and composition distributions while , , and , , show nighttime distributions. As in , the top panels of and show all species measured as a single size distribution, while the lower panels group species with similar size distributions.
FIG. 4 Average particle size and composition at Sacramento during the current study (IOP1–2) during the day (10 A.M..–6 P.M..) (panels a–c) and night (8 P.M..–8 A.M.) (panels d–f). N = 12
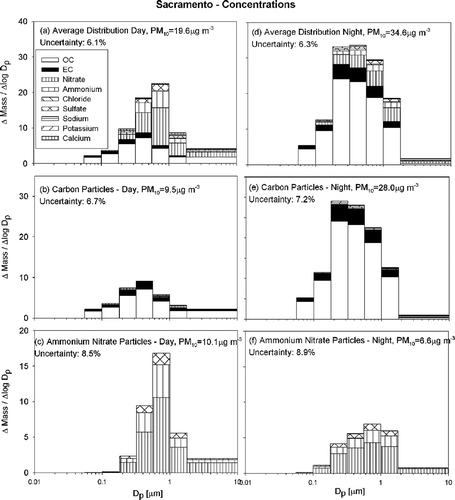
FIG. 5 Average particle size and composition at Modesto during the current study (IOP1-4) during the day (10 A.M..–6 P.M..) (panels a–c) and night (8 P.M..–8 A.M..) (panels d–f). N = 28
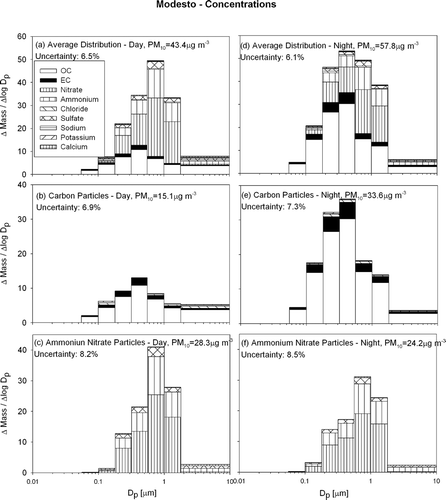
and , and and 5d show that the mass peak for the overall particle size distribution occurs between 0.56 and 1.0 μ m aerodynamic diameter during the day and 0.32–0.56 μ m during the night. The decreased diameter of the peak in the mass distribution reflects the effect of high concentrations of smaller carbon particles at night. The daytime mass peak is sharper than the corresponding nighttime mass peak at both locations. Daytime particles are dominated by secondary ammonium nitrate while nighttime concentrations have larger primary carbon content. Overall PM10 mass concentrations are 33% and 76% larger during the night than during the day at Modesto and Sacramento respectively.
Carbon particles at Sacramento and Modesto are distinctly diurnal with nighttime concentrations 2–4 times greater than daytime concentrations. Carbonaceous PM10 concentrations were approximately 9.5 and 15.1 μ g m−3 during the day and 28.0 and 33.6 μ g m−3 during the night at Sacramento and Modesto respectively. Although primary carbon particle emissions from mobile sources decrease in the late evening, the shallow nighttime inversion and the increased emission of fresh carbon particles from wood combustion cause the observed nighttime carbon peak (see and related discussion). The average mass peak for carbon particles was found at 0.32–0.56 μ m at both locations except for Sacramento at night where the carbon particles were smaller with the mass peak at 0.18–0.32 μ m.
and and and show that particulate ammonium ion, nitrate and sulfate were highly correlated (similar to the pattern seen in offshore flow at Bodega Bay). All three species have a mass peak at 0.56–1.0 μ m aerodynamic diameter both during the day and night. The peak at both sites was more pronounced during the day, but since secondary ammonium nitrate particulate matter condenses onto hygroscopic seed particles both during the day and night, the diurnal size shift observed for carbon particles does not exist for these particles. PM10 ammonium ion + nitrate + sulfate concentrations at Modesto were measured to be 28.3 μ g m−3 during the day and 24.2 μ g m−3 during the night, while concentrations at Sacramento were 10.1 μ g m−3 during the day and 6.6 μ g m−3 during the night. The pattern of higher daytime concentrations for secondary species is expected based on the trends illustrated in .
and illustrate that particulate carbon concentrations were similar at Modesto and Sacramento, while particulate ammonium/nitrate/sulfate concentrations at Modesto were 3–4 times higher than at Sacramento. This trend likely reflects the distribution of ammonia sources in the study region.
shows the average particle size and composition distribution measured at Bakersfield with a format analogous to , , . The particle size distribution at Bakersfield has a highly pronounced mass peak at 0.56–1.0 μ m at all times during the sampling period. PM10 concentrations averaged 69 and 78 μ g m−3 during the day and night respectively (much higher than at Sacramento and Modesto), and are dominated to a greater extent by ammonium nitrate. Total PM concentrations are slightly diurnal with marginally (13%) greater nighttime concentrations.
FIG. 6 Average particle size and composition at Bakersfield during the current study (IOP1-4) during the day (10 A.M..–6 P.M..) (panels a–c) and night (8 P.M..–8 A.M..) (panels d–f). N = 29
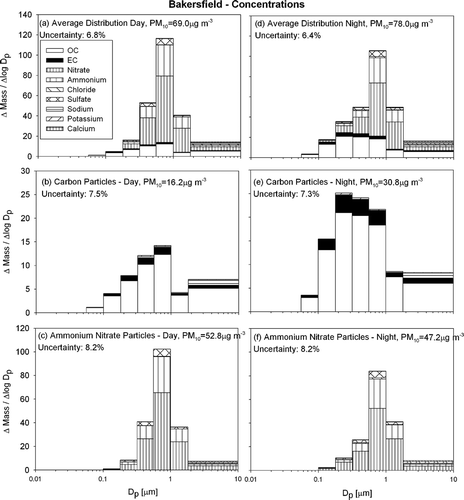
and show that the PM10 particulate carbon concentrations measured at Bakersfield are similar to carbon concentrations found at Modesto and Sacramento. The familiar trend with nighttime concentrations higher than daytime concentrations reinforces the expectation that particulate carbon concentrations are dominated by primary emissions. The diurnal trend in the particle size distribution for carbonaceous particulate matter is different from that observed at Sacramento and Modesto, with a mass peak at 0.56–1.0 μ m during the day and a mass peak at 0.18–0.32 μ m during the night.
and show that particulate ammonium nitrate has the same size distribution as particulate sulfate, matching the behavior observed at Modesto, Sacramento and Bodega Bay (during offshore flow). Concentrations of ammonium nitrate at Bakersfield are significantly greater than at any other site where sampling took place during the current study. The mass peak in the accumulation mode (0.56–1.0 μ m aerodynamic diameter) is more pronounced at Bakersfield than at both Modesto and Sacramento. Concentrations of these secondary species at Bakersfield are diurnal with greater concentrations during the day.
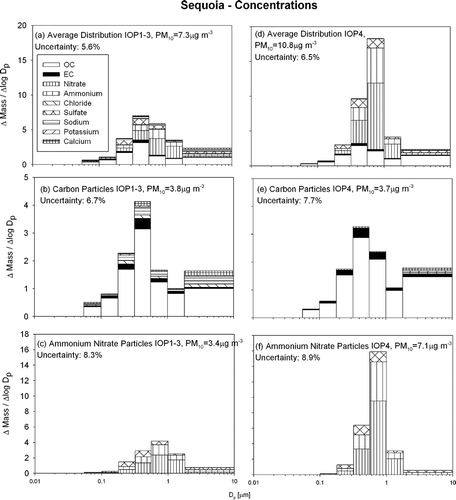
shows the particle size and composition distribution measured at Sequoia during the current study. , , show the average size and composition distribution during the first (stronger) stagnation event spanning IOPs 1–3, while , , show the average size and composition distribution during the second (weaker) stagnation event spanning IOP4. The depth of the mixing layer during the first stagnation event was low enough to keep the Sequoia site (415 m above the valley floor) relatively isolated. During the second stagnation event the mixing layer is believed to have been deep enough to include Sequoia in the valleywide mixed layer. Concentrations at this rural site are significantly lower than at the other sites but, as on the valley floor, particulate carbon and particulate ammonium-nitrate-sulfate have different size distributions. Particulate carbon has a mass peak at 0.32–0.56 μ m, while particulate ammonium/nitrate/sulfate has a peak at 0.56–1.0 μ m. and show that carbon concentrations during the two events were low and similar with PM10 concentrations of 3.8 μ g m−3 and 3.7 μ g m−3, respectively. and show that ammonium/nitrate/sulfate concentrations varied greatly between the events with PM10 concentrations of 3.4 μ g m−3 and 7.1 μ g m−3, respectively.
FIG. 7 Average particle size and composition distribution at Sequoia during the current study. Panels (a–c) show the average during IOPs 1–3 (N = 11) while panels d–f show the average during IOP4 (N = 4).
The average uncertainty of the species concentrations shown in , , , , caused by uncertainty in sample flow rates and sample analysis was estimated as 7–16% (CitationHerner et al. 2005). The sum of each species concentration size distribution was compared to a collocated PM1.8 filter measurement with correlation coefficients (R2) greater than 0.9 for all species other than Na+, K+, and Ca2+ (predominantly minor species in , , , , ). Collocated PM1.8 filter measurements for all species except Ca2 + had correlation coefficients (R2) of 0.8 or greater.
ANALYSIS
, , , , illustrate that airborne particulate matter at Bodega Bay, Sacramento, Modesto, Bakersfield, and Sequoia can be naturally grouped into two categories composed of species with similar size distributions. The first category of particulate species with similar size distributions contains sulfate, nitrate and ammonium ion. This material is much more hygroscopic than the second category composed of elemental and organic carbon. Previous field studies have observed two distinctly different particle types in the atmosphere: a hydrophobic particle type that grows little at relative humidity around 80–90% and a hygroscopic particle which grows significantly under those same conditions (CitationZhang et al. 1993; CitationPitchford et al. 1994; CitationKerminen 1997). It is likely that the particle classes that naturally form by grouping species with similar size distributions and diurnal patterns in the current study correspond to these hydrophobic/ hygroscopic categories. The diurnal variation of the PM10 concentrations for the different particle types strongly suggests that carbonaceous material is dominated by primary emissions while nitrate and ammonium are formed through secondary processes (see and related discussion). The validity of the split between these particle types was further corroborated with a box model, which will be discussed later in this section.
While the PM10 concentration trends observed at the sampling locations can be explained using the simple model summarized in , the factors that determine the diurnal variation of the size distributions for the various chemical species are more complicated. As a first step, the size and composition distributions shown in , , , , may be compared to the size and composition distribution of primary source emissions (CitationKleeman et al. 1999; CitationKleeman et al. 2000): particle nitrate is not emitted in any significant quantity from any major emission source, reinforcing the conclusion that secondary formation produces this aerosol species in the atmosphere. Sulfate emissions from gasoline-powered motor vehicles generally have a size distribution that peaks between 0.5–0.8 μ m (CitationKleeman et al. 2000), matching the ambient sulfate size distributions measured in the current study. Secondary production of sulfate likely produces additional particulate sulfate in the atmosphere. Emissions of primary carbonaceous material from most combustion sources peak between 0.1–0.2 μ m particle diameter (CitationKleeman et al. 1999; CitationKleeman et al. 2000), contrasting with the carbon size distribution peaks observed at larger particle sizes during the current study. This final observation presents a significant puzzle, since it is not obvious how carbon particles are shifted to larger sizes in the atmosphere.
The processes that commonly shape the airborne particle size distribution include emissions, deposition, condensation/evaporation, and coagulation. A two-layer box model that includes a description of these processes was used to evaluate the relative importance of each process for the size distributions measured at Bakersfield, Modesto, and Bodega Bay during the current study. The major components of the box model calculation are the same as those used in the UCD/CIT air quality model (CitationKleeman et al. 1997; CitationHeld et al. 2004) except that transport processes are not included in the calculation. A coagulation calculation was also incorporated into the box model to account for transformations to the particle size distribution associated with coagulation processes. Airborne particles in the box model are represented by up to 10 different primary emitted particle classes. Each particle class is represented by a discrete particle size distribution with 15 representative particles that cover the size range from 0.01 to 10 μ m initially. The size of each discrete particle used to represent the size distribution evolves as condensation and evaporation take place (equivalent to a moving sectional approach). Gas-phase reactions and gas-to-particle conversion processes are also included in the box model to simulate the formation of secondary particulate matter. Two vertical layers are used to resolve the atmosphere above the height of the mixing depth and below the height of the mixing depth up to a total height of 1km. The horizontal resolution of the box model is 40 km by 40 km.
All of the processes in the box model calculation have been extensively tested during previous modeling exercises (CitationHeld et al. 2004; CitationKleeman et al. 2005; CitationYing et al. 2006) except for coagulation. Numerical solutions to the coagulation equation have been derived previously for a fixed-bin representation of the particle size distribution (CitationJacobson et al. 1994). A new formulation of the coagulation equations was necessary to describe how coagulation modifies the moving sectional size distribution used in the present study. Coagulation combines two particles in the atmosphere to form a new particle with the aggregate volume and composition of the original particles. All current air quality models use a spherical representation of particles, and so the diameter of the particle formed by a coagulation event can be easily calculated if the properties of the original particles are known. One method to describe the particles produced by coagulation events with a moving sectional representation of the airborne particle size distribution would be to create new particle sections with the appropriate diameter and composition for every coagulation event that occurs. This approach is inefficient because it would require an infinitely large number of size bins to represent the aerosol evolution over time. A more efficient approach can be derived by recognizing that most of the coagulation events that occur in the atmosphere involve collisions between very small particles (with high Brownian mobility) and very large particles (that have large target area). The size of the particle resulting from such events is very similar to the size of the original larger particle. In the limit, this type of coagulation event becomes analogous to condensation for the larger particle, where the size and composition is modified by the accumulation of a small amount of additional material.
Based on the above discussion, the equations that describe how coagulation changes the particle number and chemical component concentration in a moving sectional size distribution can be written as:
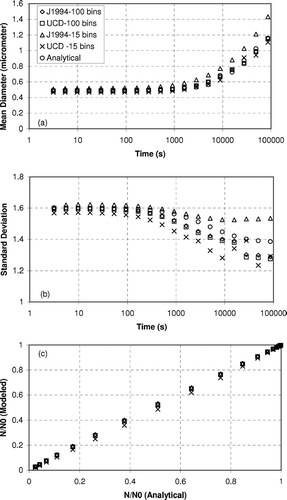
shows the accuracy of the moving sectional coagulation model described in Equation (Equation3) (referred to as UCD) along with a fixed bin numerical solution (CitationJacobson et al. 1994) (referred to as J1994) versus an exact solution for a test system initialized with a log-normal distribution N0 = 1E12 m3, Dpg = 400 nm, and σ g = 1.6. shows that the mean particle diameter in the distribution increases slowly to 600 nm after 10,000 sec and 1.1 μ m after 100,000 sec. Both the moving sectional coagulation model and the fixed bin coagulation model accurately predict the growth of the average diameter as a function of time when they use 100 size bins. The numerical solutions diverge slightly from the true solution when only 15 size bins are used to represent the particle distribution, but both methods still predict the growth trend with reasonable accuracy. The UCD moving sectional coagulation model with 15 size bins appears to be slightly more accurate than the fixed sectional approach using 15 size bins. shows that the geometric standard deviation (σ g ) of the size distribution decreases to 1.45 in 10,000 sec and 1.39 in 100,000 sec. The numerical solutions follow the same qualitative trends but they differ from the true σ g value by 10–15% at 100,000 sec. The accuracy of the UCD moving sectional coagulation model with 15 size bins is comparable to the accuracy of the fixed sectional coagulation approach. shows the predicted number of particles in the size distribution vs. the actual number of particles. Both the moving sectional coagulation model and the fixed bin coagulation model predict number concentrations that match the true solution almost exactly. The moving sectional coagulation model used in the current study accurately predicts the evolution of the particle size distribution caused by coagulation processes.
FIG. 8 Predicted evolution of a log-normal particle size distribution using a fixed-bin model (J1994) and a moving sectional model (UCD).
The box-model was used to simulate the first stagnation episode spanning IOPs 1–3 using the meteorological data (temperature, relative humidity, mixing depth and solar radiation) measured during the study period. The emission rate of gas- and particle-phase pollutants was extracted from the emission inventory prepared for the CRPAQS field study by the California Air Resources Board. The chief purpose of the box model in the current study was to calculate the rate at which emissions, deposition, condensation/evaporation, and coagulation shifted the airborne particle size distribution at each of the locations where measurements were made. The rate of each process at any time depends on the current particle size distribution. The rate calculation was anchored to the observed size distribution values by setting the box-model particle size and composition distribution to the measured concentrations at the middle of each sampling event. The box model was then used to predict the evolution of the particle size distribution until the middle of the next sampling event. This approach interpolates between measured particle size distributions using our best understanding of atmospheric physics while simultaneously guaranteeing that the rate calculation is not biased by transport processes that are not included in the simple box model.
, , illustrate the predicted rate at which emissions, deposition, condensation/evaporation, and coagulation modify the total airborne particle mass distribution at Bakersfield, Modesto, and Bodega Bay, respectively. Rate calculations at Sacramento and Sequoia have not been included because they were similar to results at the other SJV or background sites respectively. The same scale is used on all plots to facilitate a direct comparison of the processes at different locations. Panel a in , , shows the airborne particle mass concentrations at each location. A buildup of ambient particulate matter occurs during the first stagnation event at Modesto and Bakersfield. A general increase in the particle size at which the peak concentration occurs is also apparent. At the end of the stagnation event, during IOP3, particulate matter concentrations are significantly greater at Bakersfield than at Modesto. PM concentrations at Bodega Bay in are significantly lower than at the valley sites.
FIG. 9 Effect of major atmospheric processes on the measured particle mass distribution at Bakersfield during IOPs 1–3.
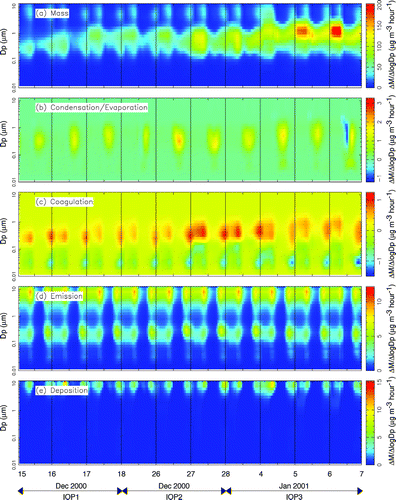
FIG. 10 Effect of major atmospheric processes on the measured particle mass distribution at Modesto during IOPs 1–3.
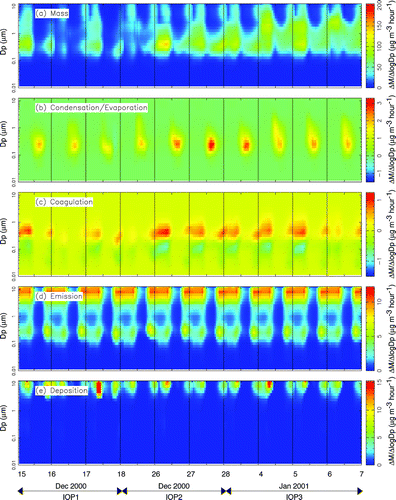
FIG. 11 Effect of major atmospheric processes on the measured particle mass distribution at Bodega Bay during IOPs 1–3.
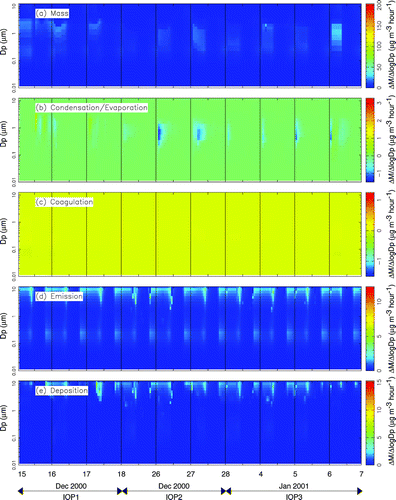
Panels b–e in , , illustrate the rate at which emissions, deposition, condensation/evaporation, and coagulation are predicted to modify the overall mass distribution. Each rate is expressed in units of μ g h−1, which describes how quickly each process adds or removes mass to certain locations in the particle size distribution (Δ M/Δlog D p ). All processes are shown using the same scale to aid direct comparisons between rates at different sites. At the remote Bodega Bay site, this causes many of the rates to appear negligible, emphasizing that the particle size distribution at the background sites is determined by what is transported to the site rather than local transformation processes.
Condensation/Evaporation
The calculated rate of change in the ambient particulate matter size distribution due to condensation/evaporation is shown in panel b of , , . and show that condensation is predicted to add several μ g hr−1 of aerosol to the accumulation mode of the airborne particle size distribution at locations in the SJV. The majority of this shift in the size distribution is caused by the condensation of ammonium nitrate onto hygroscopic sulfate particles during each afternoon when gas-phase nitric acid is produced by the photochemical transformation of NOx. The condensation of ammonium nitrate is thermodynamically favored to occur onto hygroscopic particles (CitationStelson et al. 1982). Sulfate is hygroscopic and has negligible vapor pressure at atmospheric temperatures. Sulfate particles emitted directly into the accumulation mode therefore form a wet stable core that other semi-volatile species such as ammonia and nitric acid may condense onto. The abundance of fresh ammonia emissions and the low wintertime temperatures prevalent in the SJV produce conditions where the condensation of ammonium nitrate onto hygroscopic sulfate particles is limited only by the production rate of gas phase nitric acid. Sulfate particles continue to grow due to condensation until they become larger than approximately 1 μ m particle diameter, at which point their deposition velocity rapidly increases. According to the box model calculations, the continuous growth of sulfate/ammonium/nitrate particle due to condensation coupled with rapid deposition of sulfate/ammonium/nitrate particles greater than 1 μ m forms the sulfate/nitrate/ammonium ion accumulation mode size distribution observed throughout the SJV (see panel c of , , ).
Model calculations summarized in panel b of , , do not predict the condensation of ammonium nitrate onto primary carbon particles emitted from combustion sources. Direct carbon emissions into the model calculation are considered to be hydrophobic, consistent with previous studies that suggested that organic aerosol diminishes particle water absorption in urban locations and that primary anthropogenic particles are hydrophobic or only slightly hygroscopic (CitationKerminen 1997). The peak in the particulate carbon mass distribution emitted from dominant sources in the SJV (wood combustion and transportation sources) usually occurs between 0.1–0.2 μ m particle diameter (CitationKleeman et al. 1999; CitationKleeman et al. 2000). If the condensation of ammonium nitrate was responsible for shifting the peak in the particulate carbon mass distribution from 0.15 μ m to 0.75 μ m particle diameter (see ), then primary carbon particles would need to accumulate a mass of ammonium nitrate greater than 100 times their original weight. This implies that carbonaceous aerosol would account for less than 1% of the total mass in the accumulation mode. Panel a of , , , illustrates that carbon accounts for 10–30% of the total accumulation mode mass, further supporting the prediction that condensation of ammonium nitrate does not occur onto primary carbon particles.
The calculated production of secondary organic aerosol during the winter stagnation event is very small due to low photochemical activity. This prediction is consistent with previous source apportionment studies conducted for locations in the SJV during winter stagnation events, which found that primary organic aerosol (wood smoke) accounts for the majority of the particulate carbon in the atmosphere (CitationSchauer et al. 2000). This combination of evidence suggests that condensation of organics is not a dominant mechanism for the transformation of the airborne particle size distribution during the current study.
Hygroscopic Growth
Box model calculations treat the condensation of water as a dynamic process based on the approach described by Pruppacher and Klett (CitationPruppacher et al. 1978) using the thermodynamic data of Tang and Munkelwitz (CitationTang et al. 1994). The water content of hygroscopic sulfate/nitrate/ammonium ion particles increases significantly with increasing relative humidity. Secondary organic aerosol may also absorb water in the model calculations, but as discussed previously, SOA concentrations are predicted to be very small during the current study. The solubility of primary organic aerosol is predicted be negligible, consistent with the treatment used in other air quality models (CitationKoo et al. 2003). Measurements have shown that the diameter of particles composed of common wood smoke components grows no more than 30% even at a relative humidity of 90% (CitationMochida et al. 2004). It is unlikely that primary carbon particles could grow from an emissions size of 0.15 μ m to the observed accumulation mode values unless a fog event occurred. Daytime fog events did not occur during the current study, strongly suggesting that hygroscopic growth does not account for the observed shift in the carbon size distribution illustrated in , , , , .
Dry Deposition
The calculated rate of change in ambient particulate matter size distribution due to deposition is shown in panel e of , , based on the deposition procedure described by CitationKleeman et al. (1997). Dry deposition rates depend on atmospheric stability conditions, wind speed, particle size, and particle density. Deposition is predicted to remove up to 15 μ g m−3 h−1 of airborne particulate matter from the coarse region of the size distribution at Modesto, but deposition of all particle sizes occurs in the simulation. Deposition rates for a 0.1 μ m, a 0.5 μ m, and a 3 μ m particle during the current study are predicted to be 2.4 × 10⁻⁴ m s−1, 6.4 × 10⁻⁵ m s−1, and 4.34 × 10⁻⁴ m s−1 respectively. During the evening hours when mixing depths are on the order of 50 m, these velocities suggest deposition time scales (h/V) of 58 h, 217 h, and 32 h for ultrafine, accumulation mode, and coarse airborne particles, respectively. Over a multiweek stagnation episode, deposition is predicted to be a significant process that shapes the airborne particle size and composition distribution. As discussed in the section describing condensation, model calculations predict that deposition plays a key role in shaping the accumulation mode size distribution of sulfate particles that grow due to the condensation of ammonium nitrate.
Emissions
Panel d of , , show the rates at which the airborne particle size distribution is modified due to primary emissions. At Modesto, primary particulate matter emissions occur mainly in the coarse mode and in the 0.1–0.3 μ m range. Coarse emissions consist of dust particles that quickly deposit out of the atmosphere (see panel e). Predicted emissions in the 0.1–0.3 μ m size range are released mainly from wood combustion and transportation sources. Carbonaceous wood smoke particles modify the particle size distribution at a rate of 5 μ g m−3 h−1 during the hours before midnight at both Modesto and Bakersfield. Carbonaceous transportation particle emissions modify the particle mass distribution at a rate of 3 μ g m−3 h−1 in the early morning hours. Some emissions of ultrafine particles (smaller than PM0.1) associated with gas fired power plants are also predicted at Bakersfield. Modest emissions of coarse sea salt particles are predicted at the background site, but emissions are otherwise small at this location. The size and composition distribution of airborne particles is governed by the transport of PM to the Bodega Bay site.
Coagulation
The calculated rate of change in ambient particulate matter size distribution due to coagulation is shown in panel c of , , based on the procedure described by Equation (Equation3). Coagulation describes the physical process when two particles collide to form a single particle. In the ambient air, the mechanisms leading to coagulation are mainly Brownian motion, gravitational settling and turbulence. Coagulation due to turbulence is only significant in fog or clouds where turbulent motion is strong and the particles are large. These conditions are not relevant for the current study, and so coagulation by Brownian motion and deposition dominates the calculation. The overall coagulation rate increases as the concentration of airborne particulate matter increases, with the fastest rates observed for collisions between small particles and larger particles.
shows that coagulation does not play an important role in shaping the size distribution at Bodega Bay because concentrations are too low to generate significant coagulation rates. In contrast, and show that coagulation is an important mechanism at heavily polluted locations in the SJV. At Modesto and Bakersfield, the predicted nighttime coagulation rates during IOPs 2 and 3 reached 1 μ g m−3 h−1 moving particles from the 0.08–0.25 μ m size range into the 0.3–0.5μ m size range. The majority of this coagulation occurred between primary wood smoke particles emitted with an average diameter of 0.1–0.2 μ m and accumulation mode sulfate/nitrate/ammonium ion particles. Ultrafine particles (0.02–0.03 particle diameter) emitted from natural gas combustion in the region surrounding Bakersfield were also quickly transferred to the accumulation mode by coagulation in the model calculation.
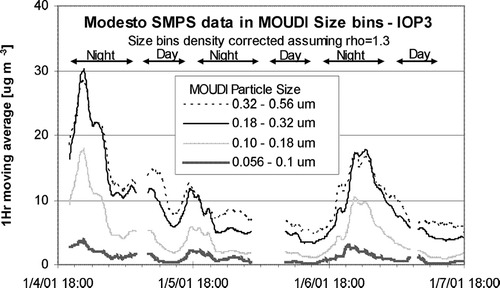
The emission of fresh carbon particles at relatively small sizes and the growth of these particles to larger sizes was observed using real-time measurements available at a limited number of sites during the current study. shows continuous ambient particle size distribution measurements made at Modesto during IOP 3 using a Scanning Mobility Particle Sizer (SMPS, TSI Instruments). The particle number distributions measured by the SMPS were converted to particle mass distributions assuming spherical particles with a density of 1.3 (appropriate for wood smoke particles) and then averaged into MOUDI size bins that were also corrected for density. During the nights of January 5 and 7, particulate matter mass concentrations increased strongly between 18:00–24:00 PST. The timing of the increased mass concentrations is consistent with the formation of the nighttime surface atmospheric temperature inversion layer along with increased emissions from home heating. On January 6, surface winds at Modesto reached speeds of 4–6 m s−1, preventing the formation of a strong nighttime surface inversion and the buildup of airborne particle mass concentrations. During nights when a strong surface inversion did form, the peak in the SMPS particle mass distribution shifted from a diameter of 0.32–0.56 μ m at 18:00 to a diameter of 0.18–0.32 μ m at midnight, indicating that the freshly emitted particles were smaller than the particles that were already in the atmosphere. After 24:00 PST, particulate matter mass concentrations started to decrease and the peak in the size distribution shifted back to larger diameters (0.32–0.56 μ m). This pattern is consistent with the predicted balance between fresh emissions, deposition, and coagulation in a heavily polluted atmosphere as illustrated in , , .
FIG. 12 Hourly-average airborne particle size distributions measured at Modesto during IOP3 using a SMPS. The mass measurement that would be recorded in the MOUDI size bins was calculated assuming a particle density of 1.3.
The diurnal variation of the particulate carbon size distribution at Bakersfield (, ) was different than the corresponding diurnal variations observed at Sacramento (, ) and Modesto (, ). The peak in the particulate carbon size distribution at Bakersfield occurred at 0.56–1.0 μ m particle diameter while the peak in the corresponding distributions at Sacramento and Modesto occurred at 0.32–0.56 μ m particle diameter. The diurnal variation of the carbon size distribution at Bakersfield (, e) could only be reproduced by box model calculations when carbon particles and sulfate/ammonium/nitrate ion particles were treated as separate externally mixed particle classes. As discussed previously, the condensation of ammonium nitrate onto hygroscopic sulfate particles leads to the formation of an accumulation mode for sulfate/ammonium/nitrate particles. Higher condensation rates of ammonium nitrate lead to a sulfate/ammonium/nitrate size distribution with increased concentrations and a tighter geometric standard deviation and larger average diameter within the 0.56–1.0 μ m size range. Internally mixed calculations under the same conditions predict a smaller average diameter for accumulation mode particles because the same amount of condensate is distributed over all particles rather than just the hygroscopic sulfate/ammonium/nitrate particles. This reduction in the average size of accumulation mode particles reduces their coagulation rate with smaller carbon particles.
The effect of the concentration and size distribution of accumulation mode particles on the coagulation rate with smaller carbon particles can be observed through an examination of carbon particle trends during the entire study period. shows the evolution of day (, d) and night (, c) airborne particle organic + elemental carbon concentrations in different size fractions at Bakersfield (, b) and Modesto (, d) during IOPs 1–4. As discussed previously, IOPs 1-3 occurred during the same multi-week stagnation event, while IOP 4 occurred during a second weaker stagnation event. Nighttime particulate carbon size distributions peak at diameters 0.18–0.32 μ m at both Modesto and Bakersfield at the start of IOP1. The average peak in the nighttime carbon size distribution increases to 0.32–0.56 μ m during IOP2 at both locations. During IOP3, the peak in the nighttime particulate carbon size distribution at Bakersfield increases to 0.56–1.0 μ m, while the corresponding peak at Modesto remains at 0.32–0.56. This same general trend of larger carbon particles at the more heavily polluted location is reflected in the average daytime size distributions. These observations support the prediction that increased coagulation rates in heavily polluted locations shift primary carbon particles emitted at 0.1–0.2 μ m particle diameter to larger sizes.
FIG. 13 Size-resolved total carbon (EC + OC) size distributions at Bakersfield during the night (panel a), Bakersfield during the day (panel b), Modesto during the night (panel c), and Modesto during the day (panel d).
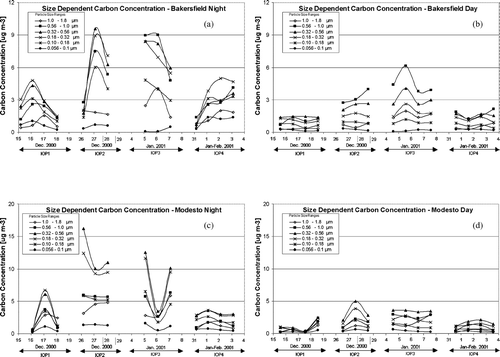
In summary, the heavily polluted conditions at Modesto and Bakersfield lead to nighttime coagulation rates that explain the shift in the particulate carbon size distribution observed at Sacramento, Modesto, and Bakersfield (panel b and e of , , ). The general trends illustrated in , , are expected to occur at urban locations throughout the SJV under similar meteorological conditions.
CONCLUSIONS
A combination of measurements and model predictions for particle size and composition at multiple locations in central California has been used to identify dominant processes that shape the airborne particle size distribution. The coarse particle fraction is dominated by fresh emissions of sea salt at coastal locations or windblown dust at inland locations. Deposition rapidly removes these large particles from the atmosphere. Fresh emissions of carbonaceous aerosol from combustion sources dominate ultrafine particle concentrations at urban locations in the SJV. Coagulation with accumulation mode particles in heavily polluted conditions transfers ultrafine carbon particles to larger sizes. Hygroscopic sulfate particles act as a site for the condensation of ammonium nitrate aerosol in the accumulation mode. Little or no SOA production is expected under the cool winter conditions experienced during the winter in the SJV. Sulfate/ammonium/nitrate particles continue to grow through the condensation of water and additional ammonium nitrate until they exceed 1 μ m particle diameter, at which point deposition rapidly removes them from the atmosphere. The results of this analysis suggest that the air quality models used to simulate the airborne particle size distribution in the SJV during winter stagnation episodes must include emissions, condensational growth, coagulation, and deposition processes.
This research was supported by the San Joaquin Valleywide Air Pollution Study Agency and the California Air Resources Board under contract number 2000-05PM.
Related Research Data
REFERENCES
- Allen , J. O. , Mayo , P. R. , Hughes , L. S. , Salmon , L. G. and Cass , G. R. 2001 . Emissions of Size-Segregated Aerosols from On-Road Vehicles in the Caldecott Tunnel . Environ. Sci. Technol. , 35 ( 21 ) : 4189 – 4197 . [INFOTRIEVE] [CSA]
- Chow , J. C. , Watson , J. G. , Lu , Z. Q. , Lowenthal , D. H. , Frazier , C. A. , Solomon , P. A. , Thuillier , R. H. and Magliano , K. 1996 . Descriptive Analysis of PM(2.5) and PM(10) at Regionally Representative Locations During SJVAQS/AUSPEX . Atmos. Environ. , 30 ( 12 ) : 2079 – 2112 . [CROSSREF] [CSA]
- Hays , M. D. , Smith , N. D. and Dong , Y. 2004 . Nature of Unresolved Complex Mixture in Size–Distributed Emissions from Residential Wood Combustion as Measured by Thermal Desorption-Gas Chromatography-Mass Spectromotry . J. Geophys. Res. , : 109 In Press[CSA]
- Held , T. , Ying , Q. , Kaduwela , A. and Kleeman , M. 2004 . Modeling Particulate Matter in the San Joaquin Valley with a Source–Oriented Externally Mixed Three–Dimensional Photochemical Grid Model . Atmos. Environ. Part A–General Topics , 38 ( 22 ) : 3689 – 3711 . [CSA]
- Herner , J. D. , Aw , J. , Gao , O. , Chang , D. P. and Kleeman , M. J. 2005 . Size and Composition Distribution of Airborne Particulate Matter in Northern California.! Particulate Mass, Carbon, and Water Soluble Ions . J. Air & Waste Manag. Assoc. , 55 ( 1 ) [CSA]
- Herner , J. D. , Aw , J. , Gao , O. , Chang , D. P. and Kleeman , M. J. 2005 . Size and Composition Distribution of Airborne Particulate Matter in Northern California: I–Particulate Mass, Carbon, and Water–Soluble Ions . Journal of the Air & Waste Management Association , 55 ( 1 ) : 30 – 51 . [CSA]
- Hildemann , L. M. , Markowski , G. R. , Jones , M. C. and Cass , G. R. 1991 . Submicrometer Aerosol Mass Distributions of Emissions from Boilers, Fireplaces, Automobiles, Diesel Trucks, and Meat–Cooking Operations . Aerosol Sci. Technol. , 14 ( 1 ) : 138 – 152 . [CSA]
- Jacobson , M. Z. , Turco , R. P. , Jensen , E. J. and Toon , O. B. 1994 . Modeling Coagulation Among Particles of Different Composition and Size . Atmos. Environ , 28 ( 7 ) : 1327 – 1338 . [CROSSREF] [CSA]
- Kerminen , V. M. 1997 . The Effects of Particle Chemical Character and Atmospheric Processes on Particle Hygroscopic properties . J. Aerosol Sci. , 28 ( 1 ) : 121 – 132 . [CROSSREF] [CSA]
- Kleeman , M. J. , Cass , G. R. and Eldering , A. 1997 . Modeling the Airborne Particle Complex as a Source-Oriented External Mixture . J. Geophys. Res.–Atmospheres , 102 ( SEP 20 ) : 21355 – 21372 . [CROSSREF] [CSA]
- Kleeman , M. J. , Schauer , J. J. and Cass , G. R. 1999 . Size and Composition Distribution of Fine Particulate Matter Emitted from Wood Burning, Meat Charbroiling, and Cigarettes . Environ. Sci. Technol. , 33 ( 20 ) : 3516 – 3523 . [CROSSREF] [CSA]
- Kleeman , M. J. , Schauer , J. J. and Cass , G. R. 2000 . Size and Composition Distribution of Fine Particulate Matter Emitted from Motor Vehicles . Environ. Sci. Technol. , 34 ( 7 ) : 1132 – 1142 . [CROSSREF] [CSA]
- Kleeman , M. J. , Ying , Q. and Kaduwela , A. 2005 . Control Strategies for the Reduction of Airborne Particulate Nitrate in California's San Joaquin Valley . Atmos. Environ. , 39 ( 29 ) : 5325 – 5341 . [CROSSREF] [CSA]
- Koo , B. Y. , Ansari , A. S. and Pandis , S. N. 2003 . Integrated Approaches to Modeling the Organic and Inorganic Atmospheric Aerosol Components . Atmos. Environ. , 37 ( 34 ) : 4757 – 4768 . [CROSSREF] [CSA]
- Laschober , C. , Limbeck , A. , Rendl , J. and Puxbaum , H. 2004 . Particulate Emissions from On-Road Vehicles in the Kaisermuhlen-Tunnel (Vienna, Austria) . Atmos. Environ. , 38 ( 14 ) : 2187 – 2195 . [CROSSREF] [CSA]
- D. E. S. , Lehrman , T. B. and Knith , W. R. 1995 . Integrated Monitoring Study Data Analysis , Sacramento : California Air Resources Board . California Regional PM10/PM2.5 Air Quality Study (CRPAQS), Final Report
- Liu , D. Y. , Wenzel , R. J. and Prather , K. A. 2003 . Aerosol Time-of-Flight Mass Spectrometry During the Atlanta Supersite Experiment: 1. Measurements . J. Geophys. Res.-Atmos. , 108 ( D7 ) Art. No. 8426[CROSSREF] [CSA]
- Magliano , K. L. , Hughes , V. M. , Chinkin , L. R. , Coe , D. L. , Haste , T. L. , Kumar , N. and Lurmann , F. W. 1999 . Spatial and Temporal Variations in PM10 and PM2.5 Source Contributions and Comparison to Emissions During the 1995 Integrated Monitoring Study . Atmos. Environ. , 33 ( 29 ) : 4757 – 4773 . [CROSSREF] [CSA]
- McDonald , J. D. , Barr , E. B. , White , R. K. , Chow , J. C. , Schauer , J. J. , Zielinska , B. and Grosjean , E. 2004 . Generation and Characterization of Four Dilutions of Diesel Engine Exhaust for a Suhchronic Inhalation Study . Environ. Sci. Technol. , 38 ( 9 ) : 2513 – 2522 . [INFOTRIEVE] [CROSSREF] [CSA]
- McDonald , J. D. , Zielinska , B. , Fujita , E. M. , Sagebiel , J. C. , Chow , J. C. and Watson , J. G. 2003 . Emissions from Charbroiling and Grilling of Chicken and Beef . J. Air & Waste Manage. Assoc. , 53 ( 2 ) : 185 – 194 . [CSA]
- Mochida , M. and Kawamura , K. 2004 . Hygroscopic Properties of Levoglucosan and Related Organic Compounds Characteristic to Biomass Burning Aerosol Particles . J. Geophys. Res.-Atmos. , 109 ( D21 ) [CROSSREF] [CSA]
- Pastor , S. H. , Allen , J. O. , Hughes , L. S. , Bhave , P. , Cass , G. R. and Prather , K. A. 2003 . Ambient Single Particle Analysis in Riverside, California by Aerosol Time-of-Flight Mass Spectrometry During the SCOS97–NARSTO . Atmos. Environ. , 37 : S239 – S258 . [CROSSREF] [CSA]
- Pitchford , M. L. and McMurry , P. H. 1994 . Relationship between Measured Water–Vapor Growth and Chemistry of Atmospheric Aerosol for Grand-Canyon, Arizona, in Winter 1990 . Atmos. Environ. , 28 ( 5 ) : 827 – 839 . [CROSSREF] [CSA]
- Pruppacher , H. R. and Klett , J. D. 1978 . Microphysics of Clouds and Precipitation , Boston : D. Reidel Publishing Company .
- Schauer , J. J. and Cass , G. R. 2000 . Source Apportionment of Wintertime Gas–Phase and Particle-Phase Air Pollutants Using Organic Compounds as Tracers . Environ. Sci. Technol. , 34 ( 9 ) : 1821 – 1832 . [CROSSREF] [CSA]
- Shah , S. D. , Cocker , D. R. , Miller , J. W. and Norbeck , J. M. 2004 . Emission Rates of Particulate Matter and Elemental and Organic Carbon from In–Use Diesel Engines . Environ. Sci. Technol. , 38 ( 9 ) : 2544 – 2550 . [INFOTRIEVE] [CROSSREF] [CSA]
- Stelson , A. W. and Seinfeld , J. H. 1982 . Thermodynamic Prediction Of The Water Activity, Nh4no3 Dissociation-Constant, Density And Refractive-Index For The Nh4no3-(Nh4)2so4-H2o System At 25-Degrees-C . Atmos. Environ. , 16 ( 10 ) : 2507 – 2514 . [CROSSREF] [CSA]
- Stockwell , W. R. , Watson , J. G. , Robinson , N. F. , Steiner , W. and Sylte , W. W. 2000 . The Ammonium Nitrate Particle Equivalent of NOx Emissions for Wintertime Conditions in Central California's San Joaquin Valley . Atmos. Environ. , 34 ( 27 ) : 4711 – 4717 . [CROSSREF] [CSA]
- Sturm , P. J. , Baltensperger , U. , Bacher , M. , Lechner , B. , Hausberger , S. , Heiden , B. , Imhof , D. , Weingartner , E. , Prevot , A. S. H. , Kurtenbach , R. and Wiesen , P. 2003 . Roadside Measurements of Particulate Matter Size Distribution . Atmos. Environment , 37 ( 37 ) : 5273 – 5281 . [CROSSREF] [CSA]
- Tang , I. N. and Munkelwitz , H. R. 1994 . Water Activities, Densities, And Refractive–Indexes Of Aqueous Sulfates And Sodium-Nitrate Droplets Of Atmos. Importance . J. Geophys. Res. , 99 ( D9 ) : 18801 – 18808 . [CROSSREF] [CSA]
- Watson , J. G. , Chow , J. C. , Bowen , J. L. , Lowenthal , D. H. , Hering , S. , Ouchida , P. and Oslund , W. 2000 . Air Quality Measurements from the Fresno Supersite . J. Air & Waste Manage. Associ. , 50 ( 8 ) : 1321 – 1334 . [CSA]
- Watson , J. G. , Chow , J. C. , Lowenthal , D. H. , Stolzenburg , M. R. , Kreisberg , N. M. and Hering , S. V. 2002 . Particle Size Relationships at the Fresno Supersite . J. Air & Waste Manage. Associ. , 52 ( 7 ) : 822 – 827 . [CSA]
- Watson , J. G. , DuBois , D. , DeMandel , R. , Kaduwela , A. , Magliano , K. , McDade , C. , Mueller , P. , Ranzieri , A. , Roth , P. and Tanrikulu , S. 1998 . Field Program Plan for the California Regional PM2.5/10 Air Quality Study , Sacramento : California Air Resources Board .
- Wingfors , H. , Sjodin , A. , Haglund , P. and Brorstrom-Lunden , E. 2001 . Characterisation and Determination of Profiles of Polycyclic Aromatic Hydrocarbons in a Traffic Tunnel in Gothenburg, Sweden . Atmos. Environ. , 35 ( 36 ) : 6361 – 6369 . [CROSSREF] [CSA]
- Ying , Q. and Kleeman , M. J. 2006 . Source Contributions to the Regional Distribution of Secondary Particulate Matter in California . Atmos. Environ. , 40 ( 4 ) : 736 – 752 . [CROSSREF] [CSA]
- Zhang , X. Q. , McMurry , P. H. , Hering , S. V. and Casuccio , G. S. 1993 . Mixing Characteristics and Water-Content of Submicron Aerosols Measured in Los-Angeles and at the Grand-Canyon . Atmos. Environ. Part A-General Topics , 27 ( 10 ) : 1593 – 1607 . [CROSSREF] [CSA]