For spherical silicon nanoparticles produced by laser pyrolysis in a temperature range below the melting point of the bulk phase, the average particle size measured by transmission electron microscopy has been found to be larger than the crystallite size derived from profile fitting of broadened X-ray diffraction peaks. This result, interpreted in terms of aggregation and solidification of particles during the coagulation process, has been explained by a sectional model suitably developed to describe coagulation and aggregation of particles. The model predicts the evolution of the size distribution of both macroscopic polycrystalline particles and of crystallites composing the aggregates. Single crystal particles are supposed to form not only by collisions between liquid particles but also by collisions between a larger solid and a smaller liquid particle coexisting in the system due to capillarity effects which are responsible for the decreasing of the melting point of nanometre-sized particles with respect to the bulk phase. On the other hand, polycrystalline aggregates are supposed to form by collisions between solid particles. The spheroidal shape of particles found in the analysed powders has been explained by observing that the characteristic sintering time was at least one order of magnitude smaller than the characteristic time for coagulation.
The good predictive capabilities of the model for the average particle size of both the macroscopic size distribution and that of crystallites have confirmed that the hypothesis of aggregation is able to quantitatively reproduce the experimental findings.
INTRODUCTION
Nanopowders can be rightly considered as the forerunner of the nanomaterial revolution, probably the earliest use being in glazes for the early dynasty Chinese porcelain. Today several kinds of nanoparticles, spanning from metallic and semiconducting nanoparticles to nanoceramics, are commercially exploited, and nanoparticles do represent the fundamental bricks for the fabrication of more complex structures (CitationBonnell 2003).
There is a wide variety of techniques for producing nanoparticles. These essentially fall into three categories: condensation from a vapor, chemical synthesis, and solid-state processes such as milling. Among these techniques, laser pyrolysis, firstly introduced in 1982 for the synthesis of silicon based ceramic nanoparticles (CitationCannon et al. 1982) is a versatile and effective method for producing high purity nanopowders from gas, vapor, or aerosol precursor phases, provided having a resonance between the laser beam radiation (generally a continuous wave CO2 laser) and, at least, one of the components' absorption bands.
Some important characteristic features of the laser pyrolysis in a flow reactor are the very well defined reaction zone (wall-less reactor), the very fast energy absorption of the precursor which leads to almost immediate bond cleavages followed by recombination reactions, nucleation, and coagulation processes. Due to the low residence time in the reaction zone and to the high cooling rates the particles are of nanometric size.
Laser pyrolysis is presently applied for the synthesis of different nanopowders, for instance ceramics nanopowders, such SiC, Si3N4, and Si-C-N intermediate compounds (CitationDez et al. 2002), which are used for the fabrication of high-strength ceramic monoliths, iron oxide based nanoparticles to be exploited as contrast agent in bio-medical application (CitationVenteimillas-Verdaguer, Bomatì-Miguel, and Morales 2002), pure Si nanoparticles with a breakthrough application in opto-electronic devices (CitationHuisken et al. 2003; CitationKirkey et al. 2004; CitationBorsella 2000). Depending on the envisaged application, different mean particle sizes are required. For ceramic production the average size should not be smaller than 30–40 nm, due to the powder handling and processing difficulties, which vanish all the expected benefits (CitationCain and Morrell 2001). Conversely, the average size of pure Si particles should not exceed few nanometres for generating the quantum confinement effects (CitationCullis, Canham, and Calcott 1997). Therefore, the capability of synthesizing nanoparticles with controlled and tuneable size maintaining, at the same time, a reasonable yield, is of outstanding importance for laser pyrolysis to widely establish itself.
The mean size of the produced nanoparticles depends on the several factors, including the reaction temperature and time. Aim of the present paper is to investigate the mechanism of nucleation and growth of the simplest reaction of nanoparticles synthesis by laser pyrolysis, namely the formation of silicon nanoparticles from SiH4 gas at different reaction temperatures.
The particle size measurements, performed by transmission electron microscopy (TEM) and X-ray diffraction (XRD) techniques, presented apparently contradictory results. Whereas the mean particles size measured by transmission electron microscopy is in good agreement with the classic coagulation theory, the X-ray crystallite size indicates a standing decrease of the crystallite size as the reaction temperature is reduced. The difference in the measured sizes can be envisaged taking into account that electron microscopy figures the real powder particles while X-ray diffraction is sensitive to the extension of optically coherent regions (coherence length) which correspond to the subgrain domains of particles. At high reaction temperature both techniques lead to same measured size (CitationDi Nunzio and Martelli 1999), indicating that each silicon particle is a single crystal. At lower temperature, below the melting point of bulk silicon, the observed difference suggests that one single particle is in fact a polycrystalline aggregate, as it has been already observed by CitationHerlin-Boime et al. (2004) in the laser synthesis if silicon carbide.
Many aspects of the coagulation process of silicon nanoparticles have been already subjected to modelling by CitationMukherjee, Sonwane, and Zachariah (2003), CitationLehtinen and Zachariah (2002) and CitationTalukdar and Swihart (2004), and to theoretical studies by molecular dynamics (CitationZachariah and Carrier 1999). Nevertheless, a classical approach to coagulation is unable to give an exhaustive interpretation of the complex features observed in the powders when the reaction temperature is below the melting point of bulk silicon, since it only explains the macroscopic particle size distribution (PSD).
Therefore, to rationalize the experimental findings, a specific sectional model for the coagulation of silicon nanoparticles, based on the physical properties of silicon has been developed. This model reproduces the classical PSDs at high reaction temperature and accounts for the formation of polycrystalline aggregates in terms of their internal crystallite size distribution (CSD), as a function of the reaction temperature and of the experimental conditions inside the reactor chamber.
After a short description of the main features of the experimental apparatus, the microstructural characterization of the powders produced at different reaction temperatures is presented. Then the modified discrete coagulation model is introduced and applied to the interpretation of the experimental results and compared with the classical aerosol theory.
EXPERIMENTAL
Silicon nanoparticles were produced by pyrolysis of a gaseous precursor induced by a CO2 laser in a continuous-flow reactor whose schematic diagram is shown in . Details on the pyrolysis technique and on the features of the reactor used have been described elsewhere (CitationBorsella et al. 1993; CitationBorsella et al. 1997).
FIG. 1 Schematic diagram of the experimental equipment used to produce Si nanopowders.
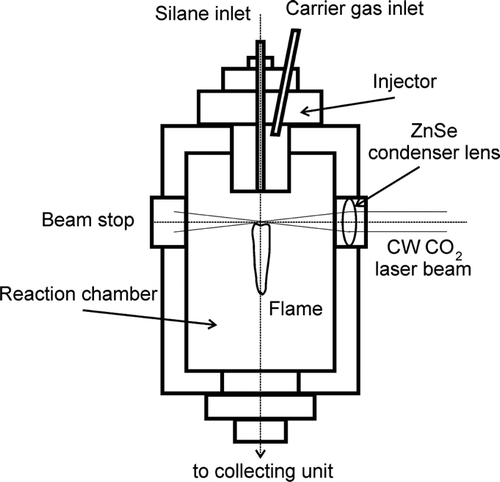
In a typical pyrolysis experiment for Si-nanoparticles synthesis, pure SiH4 with a flux of 250 sccm was introduced into the reaction chamber maintained at 500 torr, through a nozzle of 4 mm diameter surrounded by a coaxial flow of Ar (30000 sccm) acting as carrier gas. The gas flow was intersected by a horizontal CW-CO2 focused laser beam (4 mm) at the centre of the reaction chamber.
The reaction temperature, measured by optical pyrometers, was varied in the range 800–1500 °C by changing the laser power between the minimum threshold for activating the photothermal decomposition and the maximum value.
With this experimental set-up the residence time inside the flame (reaction time) has been estimated to last about 9 ms. The synthesized powder particles were collected in a glass tank located at the end of the reaction chamber without any size selection system.
The TEM specimens have been obtained according to the standard procedures for extraction replicas of loose materials: the powders are dispersed in ethanol, some drops of the solution are placed on a cellulose acetate film, dried and covered with a carbon film by spark deposition in vacuum. Then the fragments of the carbon film are collected on copper grids and the cellulose acetate is dissolved with vapors of methyl acetate.
TEM images have been obtained by a Jeol 200 CX scanning-transmission electron microscope operating with an accelerating voltage of 200 kV. The particle size distributions have been determined by counting more than 500 single particles for each sample.
The XRD average crystallite (coherently diffracting domain) size has been calculated by a Monte Carlo peak fitting procedure (CitationDi Nunzio, Martelli and Ricci Bitti 1995; CitationDi Nunzio and Martelli 1999) on the (111) diffraction peak of silicon with a Bragg-Brentano powder diffractometer and normal resolution conditions. The diffraction spectra have also shown that the powders are fully crystalline and no amorphous silicon is formed after the rapid cooling at the end of the reaction.
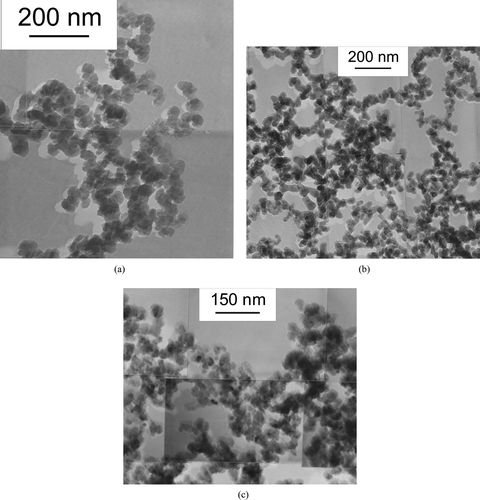
Three powders labelled Si 1, Si 2, and Si 3, synthesized at reaction temperatures of 840°C, 1030°C, and 1400°C, respectively, have been considered in the present work. The powder microstructure, as observed by TEM imaging is reported in . In all cases the particles have a well defined spheroidal shape. The chains of particles that can be seen in the pictures are formed during the sample preparation by the van der Waals attraction forces and not by stiff necks formed during the coagulation process.
FIG. 2 TEM micrographs of the Si nanopowders Si 1 (a), Si 2 (b), and Si 3 (c) produced at 840°C, 1030°C, and 1400°C, respectively.
In the numerical results of the TEM and XRD characterization are reported. The particle size measured from TEM images is the diameter of the circle equivalent to the particle projection on the photographic plate. Its average size is that of the PSD. On the other hand, the crystallite size obtained from the analysis of the x-ray peak profiles has to be intended as the diameter of the equivalent sphere identified by the coherence length of the crystal lattice (CitationGuinier 1956) and its average size is associated to the CSD.
TABLE 1 Experimental data from TEM and XRD characterization of the silicon nanopowders produced by laser pyrolysis
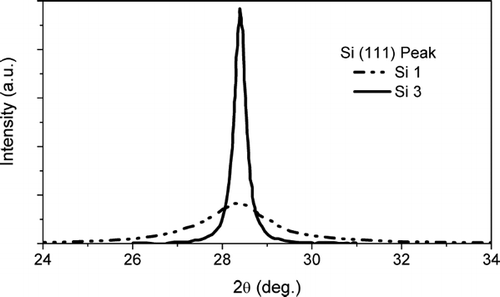
In the whole x-ray diffraction pattern recorded on sample Si 3 is reported, whereas shows the different profiles of the (111) reflections for the samples Si 3 and Si 1, respectively. The low and monotonic background in confirms the absence of the amorphous silicon phase. The large broadening of the (111) peak profile of the sample Si 1 in indicates the remarkable reduction in size of the crystal coherence lengths.
FIG. 3 X-ray diffraction pattern recorded on the sample Si 3 with Cu-kα (= 0.154 nm) incident radiation. There is no evidence of amorphous Si phase formation.
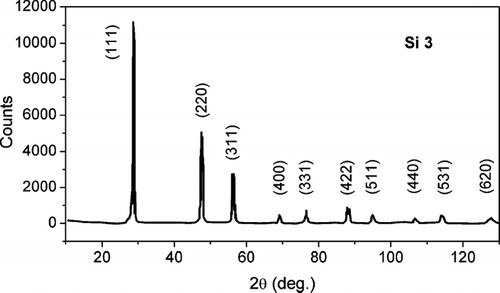
FIG. 4 Normalized line profiles of the Si (111) reflection peaks for samples Si 1 and Si 3. The full width at half maximum of the peaks is inversely proportional to the crystal coherence length or crystallite size.
The standard deviation of both PSD and CSD has been also reported in to evaluate the associated broadening.
REACTION CONDITIONS
Kinetic Regime of Coagulation and Classical Approach
The kinetic regime (free molecule or continuum) of the coagulation reaction depends on the Knudsen number in the reaction chamber. This is defined as Kn = 2λ /d, where λ is the mean free path in the gas phase and d the average diameter of particles. Free-molecule regime exists for Kn greater than about 50, whereas the continuum regime is considered for Kn < 1 (CitationOtto and Fissan 1999).
For a reaction temperature T = 1400°C, in the hypothesis of a complete dissociation of silane, the number of Si atoms per volume unit, N 0, is estimated 2.35 · 104 μ m− 3 and the total number of gas atoms per unit volume including the carrier gas is about 2.9 · 106 μ m− 3. Therefore, adopting an average particle diameter of 4 · 10−10 m, and estimating a mean free path of about 500 nm, the Knudsen number is about 2500 and the coagulation kinetics is well described by the free-molecule regime. At the end of the reaction, when coagulation has greatly reduced the number of particles per volume unit and increased their average diameter, the Knudsen number might fall below 10, and the system tends towards the transition region with the continuum regime. Nevertheless, in the present calculations it has been assumed that the process can be fully described by the free-molecule approximation.
According to the classical theory of aerosol coagulation (CitationFriedlander 1977), the evolution of the average particle size in free molecule regime is given by:
From the classical theory the characteristic coagulation time τ FM , which represents the average time elapsed between two consecutive collisions or the time required for reducing the number of particles of a factor two in a monodisperse aerosol (CitationKodas and Hampden-Smith 1999), is calculated as:
Capillarity Effects and Coagulation in Presence of Liquid and Solid Particles
Capillarity effects cannot be neglected when the size of particles lies in the nanometre range due to the large contribution of the surface energy of a highly curved interface to the overall energy balance. For single-component nanoparticles formed in the liquid state this implies that the actual temperature of the liquid-to-solid transition lies below the melting point of the bulk solid phase referred to flat surfaces. For spherical particles the maximum undercooling (T M ) of a liquid nanoparticle before solidification can be estimated by a rigorous thermodynamic treatment as a function of the curvature radius r as follows (CitationBuffat and Borel 1976; Ben David et al. 1999; CitationAlymov and Shorshokov 1999):
Unfortunately, despite recent reliable determinations for γ LV (about 740 mJ/m2) can be found in the literature (CitationFuji et al. 2000; CitationFuji et al. 2001; CitationAlchagirov et al. 2001), no reliable experimental data are available for γ SV . Therefore, a similar approach based on the Gibbs-Thomson relationship has been applied where the undercooling temperature is expressed as a function of the interfacial energy of the solid phase with respect to the liquid phase:
Sintering of Solid Particles After Collision
The TEM and XRD analysis of the powders shows that the particles have a spheroidal shape with a polycrystalline microstructure suggesting the occurrence a sintering process for the particle formation. The sintering effect can be evaluated by comparing the characteristic sintering time τ Sint and the coagulation time τ FM according to CitationZachariah and Carrier (1999).
For a monodisperse system of solid-like particles, the sintering time is defined as (CitationFriedlander and Wu 1994):
If the characteristic sintering time is greater than the coagulation time (τ FM /τ Sint > 1) the sintering process is faster than the coagulation. In this condition spheroidal particles are obtained because, in the average, a shape close to the equilibrium one can be attained before the next collision occurs. Conversely, if τ FM /τ Sint < 1 non-spherical agglomerates are formed because the time needed for particles to rearrange their shape after a collision is not enough compared to the collision frequency.
RESULTS OF THE CLASSICAL COAGULATION THEORY
The kinetic constant K FM has been calculated as a function of the experimental conditions (partial pressure of the precursor and of the carrier gas, pressure in the reactor chamber, temperature) assuming the complete dissociation of the gaseous precursors at the beginning of the process, the full mixing with the carrier gas, and a sticking probability of particles equal to unity. The resulting average particle size after 9 ms of reaction time at the three temperatures are reported in . From the comparison with the TEM experimental results (), it can be observed that the classical approach gives good predictions of the average size and the correct trend as a function of temperature. Moreover, from the τ FM /τ Sint ratios (reported in the last column of ), it can be deduced that the sintering process is faster than the collision rate in the whole temperature range, thus it is responsible for the observed spheroidal shape of the particles.
TABLE 2 Average particle diameter calculated by the classical analytical model after a reaction time of 9 ms and ratio between the characteristic coagulation time to the sintering time
THE SECTIONAL COAGULATION MODEL FOR SI NANOPARTICLES
The pure coagulation model rightly explains the dependence of the average particle size measured by TEM, where ⟨ d⟩ decreases as T is increased. In opposition, the XRD measurements show that, after approximately the same reaction time (9 ms), the average crystallite size increases as the temperature is raised up.
In order to corroborate the hypothesis that the presence of a two-phase population, which originates aggregated particles, can explain the complex behaviour of the system in terms of a macroscopic PSD observed by TEM and of a crystallite size distribution (CSD) shape measured by XRD, an integrated model for concurrent coagulation and concurrent aggregation of crystallites is proposed.
The approach, which can be classified as “sectional” according to the current definitions in the aerosol theory (CitationKodas and Hampden-Smith 1999), is based on a discrete formulation of the general dynamic equation (GDE) (CitationFriedlander 1977; CitationKodas and Hampden-Smith 1999).
It is composed by a module, which evaluates the nucleation rate, according to the classical theory in the gas phase, and a growth module, which describes both the direct growth from gaseous monomers and the pure growth due to collisions among particles.
All particles are assumed to have a spherical shape since their nucleation, and all the collision events are assumed to be effective, that is all the particles sticking together generate a larger one. Since the time elapsed between two subsequent collisions is long enough to enable the particle sintering, the assumption of a spherical shape holds also for collisions between solid particles.
The discrete particle size distribution is expressed in terms of radii classes spaced by a fixed step Δ r. The PSD is represented in terms of the number of particles per unit volume, n i , in the i-th class having radius r i . Thermal effects associated with the coagulation process (CitationZachariah and Carrier 1999; CitationLehtinen and Zachariah 2002; CitationMukherjee, Sonwane, and Zachariah 2003), have not been accounted for, since they are only relevant for low pressure and low temperature processes.
Nucleation
The nucleation process is described according to the classical nucleation theory for condensation from the gas phase, as reported by Russell et al. (1962), through the flux of critical nuclei per unit volume and time given by:
Growth
Growth of nucleated particles occurs by two simultaneously acting mechanisms: particle-monomer collisions and particle-particle collisions. The former mechanism governs the first stages of coagulation, the latter is the only possible mechanism once monomers have been almost completely consumed in the gas phase.
Binary collisions between spherical particles belonging to the size classes i and j (with r i ≥ r j ) generate a new spherical particle of volume:
The collision frequency per unit volume is calculated according to the kinetic theory of gases as the product between the average cross section of the colliding particles and their average velocity. The generic form of the collision kernel for uneven particles is:
In a time interval Δ t the number of collisions per unit volume between particles in the classes i and j is:
To treat the particle fluxes among the size classes it is necessary to express the general dynamic equation in a discrete form expliciting the volume conservation and imposing at the same time that X ij T particles survive after the collision. If these conditions are expressed by considering both the destination class k and the next one (k+1), the following system is obtained:
In the case of monomers, the same formalism is used after substituting r j with r 0, m j with m 0, n j with N 0, v j with V 0 and letting the index i to scan the whole distribution. Then, the volume fraction of the condensed phase is calculated as:
Crystallite Size Distribution
To account for the formation of polycrystalline particles, as experimentally observed at low reaction temperature, the effect of the phase transition controlled by capillarity has been introduced in the model in an explicit form for accurately describing the state of the system in a temperature range where the limiting size between liquid and solid particles lies within the PSD boundaries. Besides the macroscopic PSD, an additional crystallite size distribution (CSD) aimed at modelling the internal structure of a single particle has been introduced. The CSD includes all those solid particles that, being part of an aggregate (a polycrystalline macroscopic particle) do not participate any longer to the collisions directly, but contribute only as crystal individuals.
In order to describe the evolution of the CSD, all the possible collisions between solid and liquid particles are considered paying particular attention to their aggregation state (solid, liquid) and internal structure (single crystal, polycrystal) of the newly formed particles. For modelling the three possible cases (liquid-liquid, liquid-solid, solid-solid) it has been assumed that (see ):
| 1. | The collision between liquid particles generates a new liquid particle, whether its radius is smaller than the limiting value r lim(T), which only contributes to the PSD, otherwise it produces a spherical single-crystal solid particle which is added to the PSD and also included in the size distribution of aggregates (CSD). | ||||
| 2. | When liquid and solid particles collide, single crystal solid particles are formed, which contribute to both PSD and CSD. | ||||
| 3. | Collisions between solid particles are assumed to originate polycrystalline particles contributing to the PSD, but without affecting the CSD evolution. Therefore, the sintering effect, which tends to recover the spheroidal shape of the aggregates, is supposed not effective for producing single-crystal particles by epitaxial growth. | ||||
TABLE 3 Summary of the selection rules for particle collisions in modelling the PSD and CSD evolution during coagulation
Simulations by the Sectional Model and Discussion of the Results
Calculations have been performed by simulating the experimental conditions (φSiH4 = 250 sccm, φAr = 30000 sccm, P = 500 torr, reaction time 9 ms) and imposing a constant temperature in the reaction region. A spacing Δ d = 0.25 nm for the sections of the particles and crystallites size distributions has been used.
The calculated critical diameter is in all cases smaller than the monomer size. There is no thermodynamic barrier, therefore homogeneous collision-controlled nucleation takes place and Si atoms, generated by silane dissociation, are stable and can be considered as particles from a thermodynamic point of view (CitationKodas and Hampden-Smith 1999). This means that nucleation has no effect on the coagulation kinetics and the analytical solution is a good approximation for the macroscopic PSD.
The calculated evolution of the average particle size of PSD and CSD during the reaction for the three experimental temperatures is shown in . Two limiting behaviours can be clearly distinguished. At temperatures close to the melting point, where all the particles are in the liquid state, PSD and CSD coincide and the average particle diameter grows continuously with time exhibiting a parabolic kinetics. The growth exponent has been calculated 0.365 at 1450°C, which is close to the value 2/5 predicted by the analytical theory (Equation Equation9).
FIG. 5 Evolution of the PSD and CSD average diameters calculated by the modified sectional model for a reaction time of 9 ms.
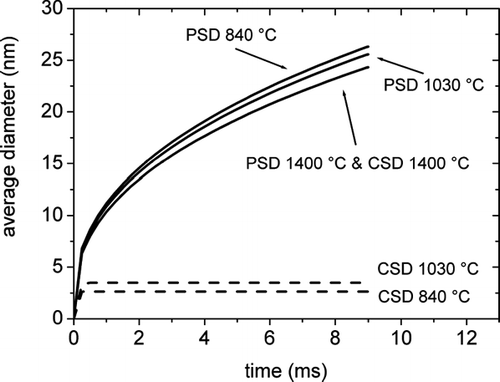
On the other hand, at temperatures where the liquid-solid boundary lies inside the distribution, PSD and CSD split up. The PSD shows the same continuous growth behaviour of the average particle size, whereas the average size of the CSD reaches a saturation value after less than 0.5 ms.
The inverse dependence of the average particle diameter with temperature after a fixed coagulation time is observed for the PSDs, in agreement with the analytical model and TEM determinations. After a sufficient time, the PSD reaches a stationary state characterized by a self-preserving shape, which is indicated by a constant value of the ratio between the standard deviation of the distribution and the average size. The growth curves of the average size of the PSD are almost coincident with those calculated by the analytical model. Differently, when solid particles are produced, the saturation value of the average size of the CSD decreases with temperature, in agreement with the experimental evidence from XRD.
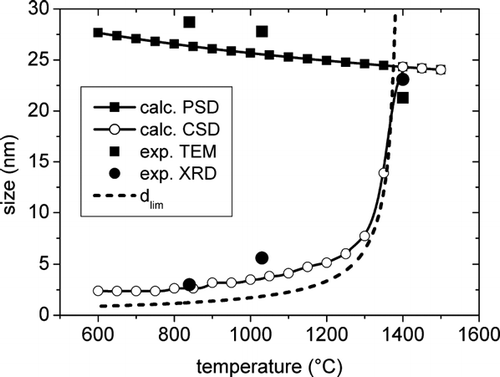
The behavior of the model for a reaction time of 9 ms in the temperature range from 600°C to 1500°C is shown in . The calculated average size of PSD and CSD clearly exhibit an opposite behaviour with temperature, and their values become coincident above the bulk melting point. It is worth noting that, in the low temperature range (below about 1150°C) the limiting diameter for liquid and solid particles () falls slightly below the average CSD diameter. This is due to the effect of the assumed epitaxial solidification of small liquid particles on larger single-crystals in mixed phase collisions. The experimental TEM and XRD average sizes show a good agreement with the theoretical predictions, as it can be observed from the determinations of the average sizes by TEM and XRD superimposed.
FIG. 6 Calculated behaviour of the average particle size of PSD and CSD with temperature and comparison with the experimental data from TEM and XRD. The dashed line represents the limiting size for the liquid to solid transition.
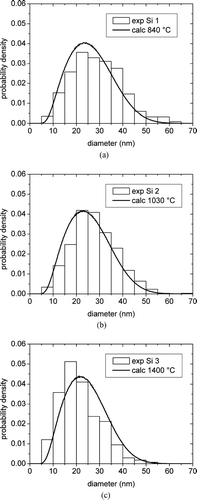
The calculated PSDs are in good agreement with the distributions from TEM () and their shape is very close to that of the self-preserving distribution theoretically predicted by the classical aerosol theory in stationary conditions of coagulation.
FIG. 7 Comparison between the calculated PSDs and the distributions from TEM measurements for the samples (a) Si 1, (b) Si 2, and (c) Si 3.
The comparison between the CSDs calculated with the present model and the corresponding distributions derived from XRD measurements is shown in . It can be observed that, although the calculated average values of the CSDs are close to the corresponding experimental determinations of the crystallite size, as shown in and , some discrepancies can be observed for the shape of the size distributions. The main difference is the presence of a spike at the beginning of the calculated CSD. The most reasonable explanation of such a feature seems to be the extremely simplified hypotheses adopted for describing the aggregation kinetics, with the specific exclusion of collisions between solid particles as a possible origin of single-crystal particles. As a matter of fact, due to the presence of an effective sintering processes, the single-crystal formation through solid particle collision cannot be in principle ruled out. A more complex model of epitaxial growth should be developed for its quantitative description and an additional hypothesis on the fraction of solid-solid collisions originating single crystals should be introduced. The tackling of all these aspects is beyond the scope of the present approach which, at this stage of development, is just aimed at demonstrating in the simplest way how the aggregation can be modelled together with coagulation.
FIG. 8 Comparison between the calculated CSDs and the distributions from XRD measurements on Si (111) peaks for the samples (a) Si 1, (b) Si 2, and (c) Si 3.
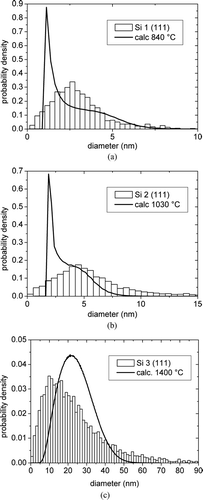
TABLE 4 Calculation results by the sectional model with aggregation after a reaction time of 9 ms.
A further source of uncertainty is represented by the procedure used for determining the CSD from the shape of the XRD peaks. According to the column-like model by Bertaut (CitationDi Nunzio, Martelli, and Ricci Bitti 1995), even in a large single-crystal particle, the scattering of X-rays is interpreted as the superposition of independent contributions coming from an ensemble of coherently diffracting domains that can be visualized as stacks of unstrained unit cells, each one with a different characteristic length. This aspect is particularly evident in the Si 3 sample () where macroscopic particles and crystallites have exactly the same size but the PSD and the CSD do not overlap perfectly.
Notwithstanding the oversimplifications in the aggregation rules illustrated above and the additional aspects related to the instrumental characterization of the powders, the present extension of the collisional coagulation model to polycrystalline aggregates clearly explains both the reason of the differences found between the TEM and XRD analysis and the behavior of the system with the reaction temperature.
CONCLUSIONS
A sectional coagulation model has been specifically developed to describe the evolution of silicon nanoparticles in an intermediate range of temperatures where, due to capillarity phenomena, solid and liquid particles coexist in the colliding population.
The model, showing good predicting capabilities both of the average particle size and of the average crystallite size, can explain the differences observed in the microstructural characterization of the powders by TEM (direct observation of macroscopic particles) and by XRD (determination of the crystallite size distribution from the analysis of line broadening).
The present formulation of coagulation and concurrent aggregation can be considered as a valuable starting point for further developments covering also the laser synthesis from gaseous precursors of ceramic nanoparticles, as for instance silicon carbide and silicon nitride.
Acknowledgments
The authors gratefully acknowledge Mr. D. Venditti of Centro Sviluppo Materiali for preparing the TEM specimens of Si nanopowders.
Related Research Data
REFERENCES
- Alchagirov , A. B. , Alchagirov , B. B. , Taova , T. M. and Khokonov , K. B. 2001 . Surface Energy and Surface Tension of Solid and Liquid Metals. Recommended values . Trans. JWRI , 30 : 287 – 291 . [CSA]
- Alymov , M. I. and Shorshokov , M. Kh. 1999 . Surface Tension of Ultrafine Particles . Nanostruct. Materials , 12 : 365 – 368 . [CSA] [CROSSREF]
- Ben David , T. , Lereah , Y. , Deutscher , G. , Kofman , R. and Cheyssac , P. 1995 . Solid-Liquid Transition in Ultra-Fine Lead Particles . Phil. Mag. A , 71 : 1135 – 1143 . [CSA]
- Bonnell , D. A. 2003 . Materials in Nanotechnology: New Structures, New Properties, New Complexity . J. Vac. Sci. Technol. A , 21.5 : 194 – 206 . [CSA] [CROSSREF]
- Borsella , E. 2000 . Si Nanocrystals and Erbium Co-Doped Glasses for Optical Amplifiers (SINERGIA Project) http://www.ist-sinergia.com
- Borsella , E. , Botti , S. , Cremona , M. , Martelli , S. , Montereali , R. M. and Nesterenko , A. 1997 . Photoluminescence from Oxidized Si Nanoparticles Produced by CW CO2 Laser Synthesis in a Continuous-Flow Reactor . J. Mater. Sci. Lett. , 16 : 221 – 223 . [CSA] [CROSSREF]
- Borsella , E. , Botti , S. , Giorgi , R. , Martelli , S. , Turtù , S. and Zappa , G. 1993 . Laser-Driven Synthesis of Nanocrystalline Alumina Powders from Gas Phase Precursors . Appl. Phys. Lett. , 63 : 1345 – 1347 . [CSA] [CROSSREF]
- Buffat , Ph. and Borel , J. -P. 1976 . Size Effect on the Melting Temperature of Gold Particles . Phys. Rev. A , 13 : 2287 – 2298 . [CSA] [CROSSREF]
- Cain , M. and Morrell , R. 2001 . Nanostructured Ceramics: A Review of Their Potential . Appl. Organom. Chem. , 15 : 321 – 330 . [CSA] [CROSSREF]
- Cannon , W. R. , Danforth , S. C. , Flint , J. H. , Haggerty , J. S. and Marra , R. A. 1982 . Sinterable Ceramic Powders from Laser-Driven Reactions. I. Process Description and Modelling . J. Am. Ceram. Soc. , 65 : 324 – 330 . [CSA] [CROSSREF]
- Cullis , A. G. , Canham , L. T. and Calcott , P. D. J. 1997 . The Structural and Luminescence Properties of Porous silicon . J. Appl. Phys. , 82 : 909 – 965 . [CSA] [CROSSREF]
- Dez , R. , Ténégal , F. , Reynaud , C. , Mayne , M. , Armand , X. and Herlin-Boime , N. 2002 . Laser Synthesis of Silicon Carbonitride Nanopowders; Structure and Thermal Stability . J. Eur. Ceram. Soc. , 22 : 2969 – 2979 . [CSA] [CROSSREF]
- Di Nunzio , P. E. and Martelli , S. 1999 . Size Distribution of Single-Crystal Nanoparticles by Monte Carlo Fitting of Wide-Angle X-Ray Scattering Peak Shape . J. Appl. Crystallogr. , 32 : 546 – 548 . [CSA] [CROSSREF]
- Di Nunzio , P. E. , Martelli , S. and Ricci Bitti , R. 1995 . A Monte Carlo Estimate of Crystallite-Size and Microstrain Distribution Functions from X-ray Line Broadening . J. Appl. Crystallogr. , 28 : 146 – 159 . [CSA] [CROSSREF]
- Friedlander , S. K. and Wu , M. K. 1994 . Linear Rate Law for the Decay of the Excess Surface-Area of a Coalescing Solid Particle . Phys. Rev. B , 49 : 3622 – 3624 . [CSA] [CROSSREF]
- Friedlander , S. K. 1977 . Smoke, Dust and Haze. Fundamentals of Aerosol Behavior , 175 New York, NY : John Wiley & Sons .
- Fuji , H. , Matsumoto , T. , Hata , N. , Nakano , T. , Kohno , M. and Nogi , K. 2000 . Surface Tension of Molten Silicon Measured by the Electromagnetic Levitation Method Under Microgravity . Metall. Mater. Trans. A , 31A : 1585 – 1589 . [CSA]
- Fuji , H. , Shiraki , A. , Kohno , M. , Matsumoto , T. and Nogi , K. 2001 . Measurement of Silicon Surface Tension Using the Oscillating Drop Method and the Sessile Drop Method . Trans. JWRI , 30 : 275 – 280 . [CSA]
- Guinier , A. 1956 . Theorie et Technique de la Radiocristallographie , 490 Paris : Dunod .
- Herlin-Boime , N. , Vicens , J. , Dufour , C. , Ténégal , F. , Reynaud , C. and Rizk , R. 2004 . Flame Temperature Effect on the Structure of SiC Nanoparticles Grown by Laser Pyrolysis . J. Nanoparticle Research , 6 : 63 – 70 . [CSA] [CROSSREF]
- Huisken , F. , Amans , D. , Ledoux , G. , Hofmeister , H. , Cichos , F. and Martin , J. 2003 . Nanostructuration with Visible-Light-Emitting Silicon Nanocrystals . New Journal of Physics , 5 : 10.1 – 10.10 . [CSA] [CROSSREF]
- Kirkey , W. D. , Cartwright , A. N. , Li , X. , He , Y. , Swihart , M. T. , Sahoo , Y. and Prasad , P. N. 2004 . Optical Properties of Polymer-Embedded Silicon Nanoparticles . Mat. Res. Soc. Symp. Proc. , 789 : N15.30.1 – N15.30.5 . [CSA]
- Kodas , T. T. and Hampden-Smith , M. J. 1999 . Aerosol Processing of Materials , 150 New York : Wiley-VCH .
- Lehtinen , K. E. J. and Zachariah , M. R. 2002 . Energy Accumulation in Nanoparticle Collision and Coalescence Processes . J. Aerosol Sci. , 33 : 357 – 368 . [CSA] [CROSSREF]
- Li , D. and Herlach , D. M. 1996 . High Undercooling of Bulk Molten Silicon by Containerless Processing . Europhys. Lett , 34 : 423 – 428 . [CSA] [CROSSREF]
- Mukherjee , D. , Sonwane , C. G. and Zachariah , M. R. 2003 . Kinetic Monte Carlo Simulation of the Effect of Coalescence Energy Release on the Size and Shape Evolution of Nanoparticles Grown as an Aerosol . J. Chem. Phys. , 119 : 3391 – 3404 . [CSA] [CROSSREF]
- Nanda , K. K. , Sahu , S. N. and Behera , S. N. 2002 . Liquid-Drop Model for the Size-Dependent Melting of Low-Dimensional Systems . Phys. Rev. A , 66 : 8 013208[CSA] [CROSSREF]
- Otto , E. and Fissan , H. 1999 . Brownian Coagulation of Submicron Particles . Adv. Powder Technol. , 10 : 1 – 20 . [CSA]
- Russell , K. C. , Lothe , J. and Pound , G. M. 1964 . “ Theory of Homogeneous Nucleation in Condensation ” . In Proc. Int. Symp. on Condensation and Evaporation of Solids , Edited by: Rutner , E. , Goldfinger , P. and Hirth , J. P. 503 – 520 . New York : Gordon & Breach . Dayton OH, Sept. 12–14 1962
- Talukdar , S. S. and Swihart , M. T. 2004 . Aerosol Dynamics Modeling of Silicon Nanoparticle Formation During Silane Pyrolysis: A Comparison of Three Solution Methods . Aerosol Sci. , 35 : 889 – 908 . [CSA] [CROSSREF]
- Veintemillas-Verdaguer , S. , Bomatí-Miguel , O. and Morales , M. P. 2002 . Effect of the Process Conditions on the Structural and Magnetic Properties of γ -Fe2O3 Nanoparticles Produced by Laser Pyrolysis . Scripta Mater. , 47 : 589 – 593 . [CSA] [CROSSREF]
- Wautelet , M. 2004 . Phase Stability of Electronically Excited Si Nanoparticles . J. Phys.: Condens. Matter , 16 : L163 – L166 . [CSA] [CROSSREF]
- Zachariah , M. R. and Carrier , M. J. 1999 . Molecular Dynamics Computation of Nanoparticle Sintering: Comparison with Phenomenological Models . J. Aerosol Sci. , 30 : 1139 – 1151 . [CSA] [CROSSREF]