Counterflow virtual impaction uses a flow of gas in a direction opposite the motion of the particles to separate them from gas and smaller particles. In the past such devices have used aircraft flight or wind tunnel flow to impart momentum to the particles. Here we describe the design and performance of an apparatus, termed a pumped counterflow virtual impactor (PCVI), which uses a vacuum pump to provide the flow. We show that this device is capable of inertial separation with a sub-micrometer cutoff diameter, particle enhancement approaching the ratio of the output to the input flow, and replacement of the ambient gas in the output flow with another gas that may be more suitable for downstream analysis techniques. Rejection of input gas and particles smaller than the cutoff diameter can exceed 99.9%.
INTRODUCTION
Separation of aerosol particles has been performed using conventional impactors for several decades (CitationBaron and Willeke, 2001 and references therein). An aerosol-laden input flow is turned in a manner such that particles with more than a specific inertial threshold cross the gas flow streamlines and impact on a surface where they can subsequently be analyzed. While lower inertia particles may not precisely follow flow streamlines they do not impact the surface. A related technique entrains high inertia particles in a secondary, or minor, flow instead of impacting them on a surface (CitationHounam and Sherwood 1965; CitationDzubay and Stevens 1975). Termed virtual impactors and dichotomous samplers, these devices have the benefit of allowing subsequent analysis of the concentrated particles, often in real-time, without the artifacts associated with a surface-mounted sample. The technique of virtual impaction replaces the solid surface, or plate, of a conventional impactor with an orifice. As the input flow is turned, typically by vacuum pumping, high inertia particles cross the gas streamlines and pass through an orifice, thus entering a smaller output flow. CitationLoo and Cork (1988) showed that four critical design dimensions in a virtual impactor are the input, or jet, orifice diameter, the collection orifice diameter, the shape of the collection orifice, and the axial alignment of input and collection orifices.
A counterflow virtual impactor for an airborne platform was described by CitationOgren et al. (1985). A flow of gas was directed out of a forward pointing inlet on the aircraft. Only particles or cloud droplets with sufficient inertia could penetrate this flow and enter the sampling region. The rate of the counterflow, coupled to aircraft velocity and altitude, set the cutoff diameter. The technique is thus termed counterflow virtual impaction and an instrument of this type is known as a counterflow virtual impactor (CVI). CVIs have allowed for sampling cloud element number and residue and condensed water content by eliminating the more numerous interstitial (unactivated) aerosol particles (CitationOgren et al. 1985; CitationHeintzenberg et al. 1996; CitationStröm and Ohlsson 1998; CitationTwohy and Gandrud 1998; CitationCziczo et al. 2004). Counterflow virtual impaction has also been employed to study surface fogs and clouds by using a wind tunnel to impart a relative velocity between the impactor and cloud element (CitationNoone et al. 1988; CitationHeintzenberg et al. 1989; CitationSchwarzenböck and Heintzenberg 2000).
Here we present a method for using a vacuum pump to produce a jet of air to replace the relative velocity traditionally generated by aircraft flight or wind tunnels in counterflow virtual impaction. Alternatively, the device may be viewed as a virtual impactor with the addition of a counterflow region. We term the device a pumped counterflow virtual impactor (PCVI). We show that this PCVI is capable of generating cutoffs at sub-micrometer aerodynamic diameter. The number density of inertially separated particles in the output flow can be enhanced by a factor approaching the ratio of the input to the output flow. To our knowledge this is the first demonstration of a counterflow virtual impactor for inertial separation of particles in a laboratory.
In the PCVI the gas in the output flow is composed almost completely of added gas rather than the input air. This is important for several reasons. In traditional virtual impactors a fraction of the input flow forms the output flow. The small particles in this fraction of the flow are thus transferred to the output (CitationBaron and Willeke 2001). The replacement of input gas in a counterflow virtual impactor essentially eliminates this process. If desired, the added gas can be of low relative humidity (RH) such that condensed-phase water is evaporated from the particles or cloud droplets (CitationTwohy et al. 2003). When the PCVI is used to separate ice crystals, the added flow can be warm, dry air to evaporate ice for subsequent analysis of ice crystal residue (CitationCziczo et al. 2003). If zero air or pure inert gas is used for the added flow then a total sulfur, nitric acid, or water measurement in the output flow can represent that species present only in particles larger than the impactor cutoff diameter. This would allow, for example, use of a total sulfur detector to measure sulfate even in the presence of SO2. Some plasma and atomic emission analysis techniques could benefit from the replacement of air by a noble gas.
APPARATUS DESCRIPTION
Design
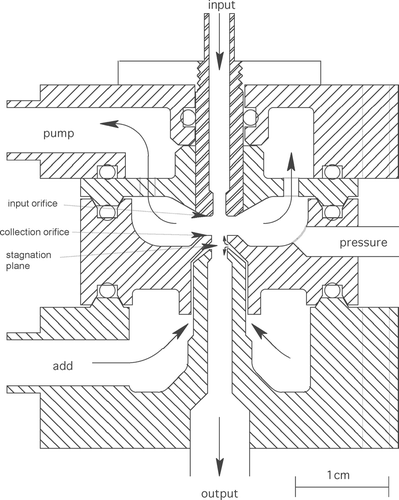
A cross section of the PCVI described here is shown in . An input flow containing a polydisperse distribution of aerosol particles enters the apparatus through the input orifice. The flow is turned such that gas and low inertia particles are pumped away while high inertia particles follow their original trajectory. To this point the description is fundamentally the same as that of a traditional virtual impactor. The pumped counterflow virtual impactor deviates from this in that a second flow of particle-free gas is added to the system. Assuming the add flow is greater than the output flow, it splits into a flow in the direction opposite the input (the counterflow) and a flow into which the retained high inertia particles are entrained (the output). The counterflow has the effect of providing a controllable means of keeping low inertia particles from entering the collection orifice and becoming entrained in the output flow. The region at which the add flow splits is a surface of zero velocity, termed the stagnation plane, which represents the distance to which a particle must penetrate so as to not be rejected. The gap from the input to the collection orifice is an annulus through which rejected particles and gas are pumped from the system.
FIG. 1 Cross-section of the laboratory counterflow virtual impactor. A polydisperse distribution of aerosol particles is present in the input flow. Inertial separation is achieved by directing a counterflow opposite the particle velocity vector. Only those particles with sufficient inertia are able to pass through the counterflow and beyond a region of zero flow velocity, termed a stagnation plane. The stagnation plane is defined as the surface where the flow added to the PCVI splits into the counterflow and the output flow, the later replacing the input gas as the medium into which the high inertia particles are entrained. The input gas, counterflow, and low inertia particles are removed from the system by a vacuum pump.
Varying terminology has been used in previous publications on counterflow virtual impaction. We note that inlet and total are sometimes used instead of input, major for what we term pump flow, and sample or minor for output flow. Furthermore, counterflow is sometimes defined as the sum of the output and counterflow (i.e., the add flow as defined here). Terminology borrowed from conventional impactors, such as defining the collection orifice as the “plate” and the distance to it as “jet-to-plate,” is sometimes used for virtual impactors despite the absence of a physical plate.
shows our current design. Some of the data in this paper were obtained with prototype with similar orifice dimensions and spacing but a different mechanical design that included an asymmetric introduction of the add flow (CitationBoulter 2002). In addition, an error was discovered in the revised design after the first field experiments at Storm Peak (CitationCziczo et al. 2003). Two o-ring grooves had not been cut deeply enough so that the pieces were not properly aligned by metal-to-metal contact. The resulting possibility of axial misalignment does not affect the CitationDeMott et al. (2003) Storm Peak results (it would have merely made fewer particles available for chemical analysis) but it makes some early tests of the PCVI difficult to interpret. Unfortunately it has not been possible to repeat all experiments on the most current device because of either borrowed equipment or changes in personnel. Data obtained with earlier versions of the PCVI are indicated in the figures.
Complete construction dimensions of the laboratory counterflow virtual impactor described here are available upon request. Some critical dimensions are the input orifice diameter, 1.37 mm and the collection orifice diameter, 1.68 mm. In the revised design, three shapes of the collection orifice facing the input orifice were tested. The smallest cutoff diameter at a given pressure and the best transmission above that diameter were for a simple flat top. Consequently this collector was used for all particle transmission experiments described herein. However, we do not view these shaped collector evaluation experiments as definitive because the collector shapes were compared before the o-ring grooves were fixed. The flat top may have the best performance or it may simply be the most tolerant of misalignment. The input-to-collector distance can be varied using a threaded screw to move the location of the input tube relative to the body of the PCVI. All particle transmission experiments described herein were performed with an input to collector distance of 1.50 mm. No differences were observed for a variation of this distance from 0.5 to 3.0 mm. Below 0.5 mm the input pressure was observed to increase and the sharpness of the cutoff was lost, indicative of insufficient pumping through a reduced annular space. Above 3 mm the pressure remained steady but the cutoff sharpness was lost. This may be indicative of misalignment of the PCVI as the distance between input and collector was increased or the onset of flow turbulence.
There are a number of design issues that require further description. First, some preliminary flow modeling showed that it is not easy to produce uniform add and pump flows rather than jets directed from the input or to the exhaust fittings. For this reason a pressure drop and a plenum is provided for each of these flows. For the pump flow the pressure drop is from a set of holes drilled in a plate. For the add flow a narrow annulus provides a pressure drop (). In each case there are two fittings on opposite sides of the plenum rather than a single, asymmetric fitting. The tightest mechanical tolerance on the PCVI is concentricity. The input and collection orifices need to be aligned to within a small fraction of their diameter, and the annulus on the add flow needs to have a uniform gap in order to achieve symmetric flow. But very tight cylindrical fits can often bind and gall. Instead, two sets of conical tapers, integrated with the o-ring grooves, are used to hold the axial alignment of the pieces within 0.03 mm. To minimize accumulation of machining tolerances, as many critical alignments as possible are referenced to the central piece of the PCVI (with the o-ring grooves).
A design tradeoff is the distance between the plane of the collection orifice and the stagnation plane. A short distance is desirable to attain a small cutoff diameter. But if this distance is too short, there will not be enough distance to form a counterflow that is not penetrated by eddies or non-uniform flow. Another design choice is the use of a slot rather than a frit to introduce the add flow. A frit (CitationOgren et al. 1985) provides a non-turbulent flow and the stagnation plane can be moved by changing the flow. To us, a minimum cutoff diameter was more desirable than a variable cutoff diameter. Also, the dimensions are substantially smaller than the aircraft CVI and it would be difficult to fabricate and mount such a small frit. We therefore used a narrow slot rather than a frit to introduce the add flow, as has also been done by CitationDhaniyala et al. (2003). Optimizing the geometry of this slot would be a good candidate for future flow modeling.
Performance
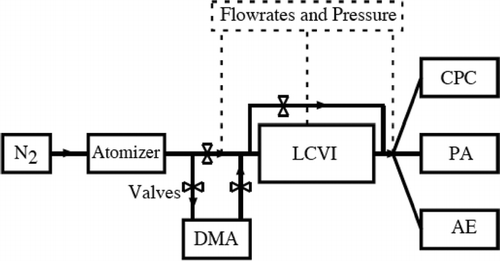
A schematic of the setup used to test the performance of the PCVI is shown in . A 1-jet BGI Collison atomizer was used to produce aerosols from a 20 weight percent solution of ammonium nitrate (ρ = 1.725 g cm−3) dissolved in distilled water. Ammonium nitrate particles are spherical over a wide range of humidity (CitationCziczo and Abbatt 2000). A total number density of about 106 cm−3 in nitrogen was produced with aerodynamic diameters ranging from 0.1 to 4.5 μ m. System relative humidity was 50 ± 10%. A valved bypass allowed for number density and size distribution measurements in both the PCVI input and output flows. Except as described later, number density was determined using a TSI Model 3020 condensation particle counter (CPC). The size distribution was recorded using a Climet Model 208 white light optical particle counter (OPC) equipped with a multichannel analyzer (Ortec TRUMP-PCI-2K). Pressure and flow rate were measured upstream, downstream, and within the PCVI. We reference the system pressure to the annular region within the PCVI, located between the input and collection orifices ().
FIG. 2 Schematic diagram of the setup used to determine PCVI performance during these studies. Particles were generated in a nitrogen atmosphere using a 1-jet BGI Collison atomizer from a solution of ammonium nitrate in distilled water. Input aerosol size selection, when required, was accomplished using a NOAA-designed differential mobility analyzer (DMA). Separation conditions were ascertained with flow rate and pressure measured upstream, downstream, and within the PCVI. Valves in the flow system permitted particle size and number measurements upstream and downstream of the PCVI using a TSI Model 3020 condensation particle counter (CPC), a Climet model 208 optical particle counter (OPC), and a NOAA-designed aerosol electrometer (AE).
Pressures as low as 50 mbar were investigated in order to explore the possibility of cutoff diameters well below 1 μ m (CitationSioutas et al. 1994). Cutoff diameters were observed using the OPC from ∼2.5 μ m particle diameter to its lower size limit, 0.35 μ m. For smaller cutoffs the input aerosol was size selected at ∼ 0.1 micron increments using a NOAA-designed differential mobility analyzer (DMA). At pressures near 40 mbar the TSI CPC performance is degraded (CitationDreiling and Jaenicke 1988; CitationZhang and Liu 1990). Particle number was therefore determined in both the input and output flow using either a NOAA-designed aerosol electrometer or a low-pressure condensation nucleus counter (CitationWilson et al. 1983).
The observed 50% cutoff diameter (the size at which 50% of particles were transmitted into the output flow), as a function of the pressure in the PCVI, is presented in and . Note that OPC and electrometer experiments were both run at a system pressure of about 300 mbar to show that they led to comparable results.
FIG. 3 50% cutoff aerodynamic diameters and Stokes numbers as a function of pressure. The solid squares are experiments performed using NaCl particles in the prototype PCVI and the open symbols experiments using ammonium nitrate particles in the revised design as shown in . Error bars show the nearest discrete sizes transmitted above and below the cutoff diameter when a DMA was used to select particles. The three data points marked with arrows denote experiments described further in .
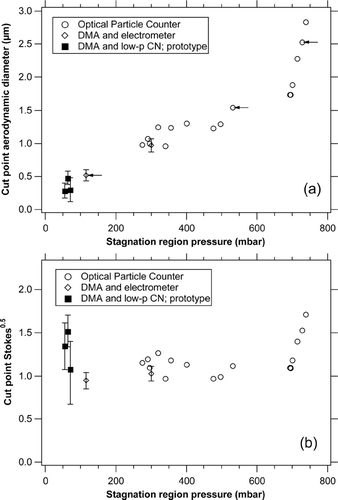
TABLE 1 Data for the PCVI experiments. Flows are volumetric in liters per minute at the PCVI pressure measured at the port shown in . The 50% cutoff aerodynamic diameter is given as CutPt50 and the corresponding square root of the Stokes number by √Stk50
In the aerodynamic diameter was calculated from an iterative solution to
Equations (1)–(3) depend on the gas mean free path and viscosity. An important detail is estimating the proper temperature and pressure to use when calculating gas properties in the impaction region. For our calculations the temperature was set to room temperature because adiabatic cooling in the input nozzle should be approximately balanced by adiabatic heating as the flow slows near the stagnation plane. The add flow is also near room temperature. Except for the input orifice, the pressure drops in the PCVI are relatively small. An examination of shows that the output line pressures were generally larger than the pressures measured at the PCVI pressure port closer to the impaction region (). This is because the output line is better positioned than the PCVI pressure port to capture the dynamic pressure from the high speed flow coming to a stop. The stagnation zone pressure was therefore estimated as the output line pressure plus a calculated pressure drop in that line of between 0.25 and 1 mbar, depending on the output flow rate.
Except at the high-pressure extreme, the 50% cutoff diameter is consistent with approximately unity values of the root of the Stokes number. The deviation to larger Stokes numbers above 650 mbar may be because the necked-down region of the input tube was not quite long enough to bring large particles up to full gas velocity when operating at high pressures. There is a subtle point here. The change in Stokes number is not simply because larger particles are harder to accelerate. All else being equal, the distance to accelerate a particle should be the same as to stop it. The stopping distance for a particle at the cutoff diameter is independent of pressure because it is set by the physical dimensions of the impactor and the position of the stagnation plane. What breaks the symmetry of the acceleration and stopping distances is that the pressure in the acceleration region (the input nozzle) is different than the pressure in the stopping region (the collection orifice). It is the pressure drop in the PCVI coupled with the pressure dependence of the stopping distance that must be the cause of the observed change in the Stokes number above 650 mbar.
The transmission efficiency as a function of particle aerodynamic diameter, is shown in for three typical experiments. These experiments are marked in by arrows. A transmission efficiency of unity is defined as the number density of particles in the input flow multiplied by the ratio of the output to the input flow (i.e., the transmission curves are particle number density in the output flow divided by the number density in the input flow multiplied by the flow ratio). As shown in , which details the experimental conditions, the flow enhancement ratio varied from ∼5 to 20. The noise observed in the transmission curves can be attributed to the method used to measure particle number density. To avoid instrument-to-instrument biases a single optical particle counter and CPC were used to determine the input and output concentrations which means that measurements were not made simultaneously. Thus, the temporal variability of the atomizer used for particle production is reflected in these curves. In practice, ∼85% transmission was attained (see Limitations and Uncertainties).
FIG. 4 PCVI collection efficiency as a function of particle aerodynamic diameter for three experiments. A collection efficiency of unity is defined as a particle density equal to the particle number density in the input flow times the ratio of the input flow to the output flow. The smallest cutoff diameter, performed at a pressure of ∼100 mbar, corresponds to an experiment using an aerosol electrometer where only transmission at discrete sizes, corresponding to the points on the curve, were measured. The other two experiments, performed at pressures of ∼530 and ∼730 mbar, respectively, used the optical particle counter to continuously measure the full particle size distribution.
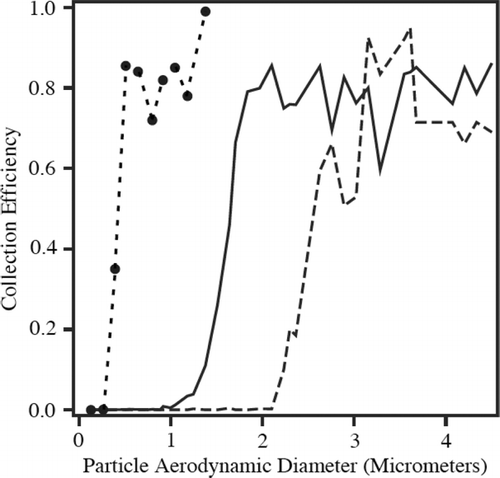
The experiment with the smallest cutoff diameter shown in was performed with the aerosol electrometer. The points on this curve correspond to measurements at discrete particle sizes using the DMA. The error bars in reflect the uncertainty of the cutoff diameter due to the bin width. The higher size-resolution mid- and high cutoff diameter experiments were performed with the optical particle counter and are indicative of the sharpness of the cutoffs and the rejection efficiency of the PCVI. In the middle case, a 50% cutoff aerodynamic diameter of ∼1.50 μ m, particles less than 1.0 μ m diameter were transmitted with an efficiency of less than 0.002%. This value is again calculated by comparing the number of particle with a diameter less than 1.0 μ m in the input flow to those in the output flow multiplied by the ratio of the output to the input flow. This value should be considered an upper limit due to possible under-sizing by the optical counter of a few super-micrometer particles properly transmitted through the PCVI.
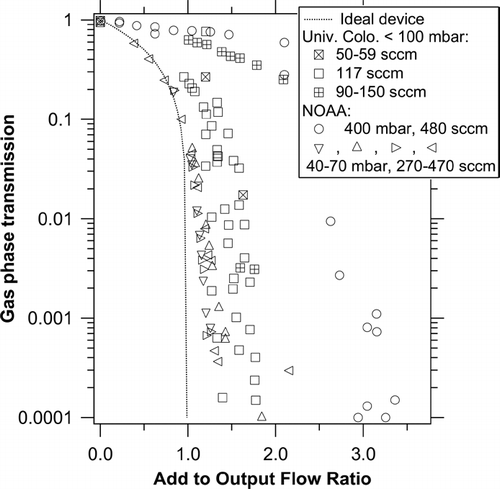
The process of gas rejection () was investigated using the earlier PCVI prototype (CitationBoulter 2002). Dilute NO in nitrogen was injected into the input flow of the PCVI, and was detected alternately in the input and output flows utilizing the well-established chemiluminescence of NO with ozone. The degree to which NO from the input flow was rejected from the outlet flow was determined from the resulting chemiluminescence intensities. By increasing the add flow rate to attain maximum input gas rejection, a decrease in NO concentration of approximately four orders of magnitude was achieved, limited by the dynamic range of the chemiluminescence detector. Under some flow conditions, significantly larger add flows were required to increase the gas rejection to a similar degree. The cause is not certain but could conceivably be due to turbulence near the stagnation plane. It should be noted that these values relate to gas concentrations only and do not account for any enhancement factor inherent in the particle transmissions described above. In , the thin curve indicates ideal gas rejection, with dilution increasing up to the point that the add flow equals the output flow followed by zero transmission beyond that point.
FIG. 5 Transmission of input flow constituents as a function of add flow. The measurements correspond to a ratio of NO chemiluminescence intensity between the input and output flows, using the prototype rather than the final design. The PCVI pressures and output flows are indicated in the legend for separate sets of experiments at the University of Colorado and NOAA. Most transmission values below about 0.0005 are upper limits. The thin curve shows the ideal performance with dilution up to the point that the add flow equals the output flow followed by zero transmission above that. Evidently there were two flow regimes, one with excellent performance and another, possibly turbulent, regime where a considerable counterflow was needed before the input gas was kept out of the output flow.
Limitations and Uncertainties
These studies were initially undertaken to prove that a laboratory counterflow virtual impactor was capable of separating super-micron ice crystals from unactivated sub-micron interstitial aerosol (CitationCziczo et al. 2003) and to investigate gas rejection efficiency (CitationBoulter 2002). Experiments were continued to quantify the cutoff diameter given various system conditions. Extensive theoretical and computational fluid dynamic calculations were not undertaken as have been performed by previous workers (CitationLin and Heintzenberg 1995; CitationLaucks and Twohy 1998). We briefly attempted to model the PCVI with FloWorks, but that particular software did not converge to physically plausible solutions for the counterflow region.
The cause of the imperfect transmission of particles through the PCVI described here, when compared to an ideal enhancement as the ratio of the output to the input flow, has not been resolved. CitationLoo and Cork (1988) describe transmission with a few percent loss for virtual impactors. Our best results had losses of about 15%. Possible reasons are particle losses when measuring particle number density before the PCVI, imperfect alignment of the PCVI, and flow irregularities such as turbulence or eddies within the system.
At the low pressure limit the difficulty in measuring the output aerosol concentration limited experimentation to find the lowest practical cutoff diameter. A low-pressure CPC was tried when the cutoff diameter was below the minimum size limit of the OPC, but the CPC required less flow than the output of the PCVI. It proved surprisingly difficult to pick off a representative portion of the flow, apparently because particles were not uniformly distributed across a cross-section of the flow coming out of the PCVI. The aerosol electrometer solved this problem by using all of the output flow but its noise limits made it more suitable for checking a few pressures than mapping out the entire pressure curve. Particle generation and transmission set the effective upper limit for experiments at high pressure. It seems likely that the cutoff could be extended to smaller sizes given a redesign of the testing system described in . It would probably be helpful to extend the acceleration region, which is the necked-down portion of the input tube. This would ensure that particles were fully accelerated to the gas velocity at all operating pressures.
SUMMARY
We have shown the design and performance of a pumped counterflow virtual impactor for the separation of particles according to their inertia. A vacuum pump is used to replace the flow velocity generated by aircraft motion or wind tunnels in traditional CVIs. The capabilities of the PCVI described here include 50% cutoff aerodynamic diameters from less than 0.3 to 3.0 μ m with corresponding system pressures from 50 to 800 mb. Except for unexplained particles losses of about 15%, the transmission of particles larger than the cutoff was enhanced by a factor of the ratio of the input to the output flow, ∼5 to 20 times. Particles much smaller than the cutoff were eliminated with an efficiency exceeding 99.99%. Furthermore, the input gas was replaced by the gas added to the system with an efficiency exceeding 99.9% and possibly much better under favorable flow conditions.
This device has been successfully used to separate super-micrometer ice crystals generated by a continuous flow diffusion chamber from un-activated aerosol particles for analysis using single particle mass spectrometer (CitationCziczo et al. 2003). We observe that this is only a single application of a versatile device. As an example, the ability of the PCVI to replace the input atmosphere allows for the measurement of species such as organics, sulfur and nitrate in only those particles larger than the impactor cutoff diameter while rejecting gas phase forms of those species.
Acknowledgments
This work was supported by NOAA climate and global change funding. We wish to thank J. Birks, S. Brooks, P. DeMott, B. Lerner, J. Ogren, and A. Prenni for related experiments and useful discussions, M. Schein for mechanical design, and C. Brock for help with the electrometers and condensation nucleus counters.
Notes
*Estimated from correlations generated from experiments when both the PCVI and outlet pressures were measured.
Related Research Data
REFERENCES
- Baron , P. A. and Willeke , K. 2001 . Aerosol Measurement: Principles, Techniques, and Applications, , 2nd Edition , 230 – 254 . New York : Wiley-Interscience .
- Boulter , J. E. 2002 . Development of a Low Pressure “Counterflow Exchanging Virtual Impactor” for Aerosol Analysis , Ph.D. Thesis 22 – 86 . University of Colorado .
- Cziczo , D. J. , DeMott , P. J. , Brock , C. , Hudson , P. K. , Jesse , B. , Kreidenweis , S. M. , Prenni , A. J. , Schreiner , J. , Thomson , D. S. and Murphy , D. M. 2003 . A Method for Single Particle Mass Spectrometry of Ice Nuclei . Aerosol Sci. Technol. , 37 : 460 – 470 . [CSA]
- Cziczo , D. J. and Abbatt , J. P. D. 2000 . Infrared Observations of the Response of NaCl, NH4HSO4, MgCl2, NH4HSO4, and NH4NO3 Aerosols to Changes in Relative Humidity from 298 to 238 K . J. Phys. Chem. A. , 104 : 4825 – 4835 . [CROSSREF] [CSA]
- Cziczo , D. J. , Murphy , D. M. , Hudson , P. K. and Thomson , D. S. 2004 . Single Particle Measurements of the Chemical Composition of Cirrus Ice Residue During CRYSTAL-FACE . J. Geophys. Res. , doi: 10.1029/2003JD004032[CSA]
- DeMott , P. J. , Cziczo , D. J. , Prenni , A. J. , Murphy , D. M. , Kreidenweis , S. M. , Thomson , D. S. , Borys , R. and Rogers , D. C. 2003 . Measurements of the Concentration and Composition of Nuclei for Cirrus Formation . Proc. Nat. Acad. Sci. , 100 : 14655 – 14660 . [INFOTRIEVE] [CROSSREF] [CSA]
- Dhaniyala , S. , Flagan , R. C. , McKinney , K. A. and Wennberg , P. O. 2003 . Novel Aerosol/Gas Inlet for Aircraft-Based Measurements . Aerosol Sci. Technol. , 37 : 828 – 840 . [CROSSREF] [CSA]
- Dreiling , V. and Jaenicke , R. 1988 . Aircraft Measurement with Condensation Nuclei Counter and Optical Particle Counter . J. Aerosol Sci. , 19 : 1045 – 1050 . [CROSSREF] [CSA]
- Dzubay , T. G. and Stevens , R. K. 1975 . Ambient Air Analysis with Dichotomous Sampler and X-ray Fluorescence Spectrometer . Environ. Sci. Technol. , 9 : 663 – 668 . [CROSSREF] [CSA]
- Heintzenberg , J. , Okada , K. and Strom , J. 1996 . On the Composition of Non-Volatile Material in Upper Tropospheric Aerosols and Cirrus Crystals . Atmos. Res. , 41 : 81 – 88 . [CROSSREF] [CSA]
- Heintzenberg , J. , Ogren , J. A. , Noone , K. J. and Gardneus , L. 1989 . The Size Distribution of Submicrometer Particles Within and About Stratocumulus Cloud Droplets on Mt. Areskutan, Sweden . Atmos. Res. , 24 : 89 – 101 . [CROSSREF] [CSA]
- Hounam , R. F. and Sherwood , R. J. 1965 . The Cascade Centripeter: A Device for Determining the Concentration and Size Distribution of Aerosols . J. Amer. Indust. Hyg. Assoc. , 26 : 122 – 131 . [CSA]
- Laucks , M. L. and Twohy , C. H. 1998 . Size-Dependent Collection Efficiency of an Airborne Counterflow Virtual Impactor . Aerosol Sci. Technol. , 28 : 40 – 61 . [CSA]
- Lin , H. and Heintzenberg , J. 1995 . A Theoretical Study of the Counterflow Virtual Impactor . J. Aerosol Sci. , 26 : 903 – 914 . [CROSSREF] [CSA]
- Loo , B. W. and Cork , C. P. 1988 . Development of High Efficiency Virtual Impactors . Aerosol Sci. Technol. , 9 : 167 – 176 . [CSA]
- Noone , K. J. , Ogren , J. A. , Heintzenberg , J. , Charlson , R. J. and Covert , D. S. 1988 . Design and Calibration of a Counterflow Virtual Impactor for Sampling of Atmospheric Fog and Cloud Droplets . Aerosol Sci. Technol. , 8 : 235 – 244 . [CSA]
- Ogren , J. A. , Heintzenberg , J. and Charlson , R. J. 1985 . In-Situ Sampling of Clouds with a Droplet to Aerosol Converter . Geophys. Res. Lett. , 12 : 121 – 124 . [CSA]
- Rader , D. J. 1990 . Momentum Slip Correction Factor for Small Particles in Nine Common Gases . J. Aerosol Sci. , 21 : 161 – 168 . [CROSSREF] [CSA]
- Schwarzenböck , A. and Heintzenberg , J. 2000 . Cut Size Minimization and Cloud Element Break-Up in a Ground-Based CVI . J. Aerosol Sci. , 31 : 477 – 489 . [CROSSREF] [CSA]
- Sioutas , C. , Koutrakis , P. and Burton , R. M. 1994 . Development and Evolution of a Low Cutpoint Virtual Impactor . Aerosol Sci. Technol. , 21 : 223 – 235 . [CSA]
- Ström , J. and Ohlsson , S. 1998 . In-Situ Measurements of Enhanced Crystal Number Densities in Cirrus Clouds Caused by Aircraft Exhaust . J. Geophys. Res. , 103 : 11355 – 11361 . [CROSSREF] [CSA]
- Twohy , C. H. and Gandrud , B. W. 1998 . Electron Microscope Analysis of Residual Particles from Aircraft Contrails . Geophys. Res. Lett. , 25 : 1359 – 1362 . [CROSSREF] [CSA]
- Twohy , C. H. , Strapp , J. W. and Wendisch , M. 2003 . Performance of a Counterflow Virtual Impactor in the NASA Icing Research Tunnel . J. Atmos. Oceanic Tech. , 20 : 781 – 790 . [CROSSREF] [CSA]
- Wilson , J. C. , Blackshear , E. D. and Hyun , J. H. 1983 . The Function and Response of an Improved Stratospheric Condensation Nucleus Counter . J. Geophys. Res. , 88 : 6781 – 6785 . [CSA]
- Zhang , Z. Q. and Liu , B. Y. 1990 . Dependence of the Performance of TSI 3020 Condensation Nucleus Counter on pressure, Flow Rate, and Temperature . Aerosol Sci. Technol. , 13 : 493 – 504 . [CSA]