Abstract
Laboratory experiments and theoretical calculations were made to characterize the performance of a Single Particle Soot Photometer (SP2) manufactured by Droplet Measurement Technologies (DMT), which was designed to measure the mass and the mixing state of individual black carbon (BC) or elemental carbon (EC) particles, based on the laser-induced incandescence (LII) technique. In this study, graphite was used as a surrogate of EC. Graphite particles with mass equivalent diameters of 110–200 nm were layered with organic liquids (glycerol and oleic acid) to produce coated graphite with diameters up to 650–800 nm. These were sampled by the SP2 to measure the waveforms (i.e., time development) of the LII and scattering signals. The peak temperature and the peak LII signal of graphite particles were independent of the coating thickness or the coating material to within experimental errors. These results indicate that the mass of EC can be measured by using peak LII signal without interference by the coating conditions. It was also shown that the difference between the times of the scattering and LII peaks can be used as an indicator of coating on EC with thicknesses larger than about 100–200 nm. LII and scattering waveforms were calculated using a newly developed theoretical model that takes into account the physical processes controlling the temperature and evaporation rate of the coated graphite particle in the laser beam. The calculations reproduced the general features of observed waveforms of LII and scattering signals, providing a firm theoretical basis for the interpretation of the SP2 data.
1. INTRODUCTION
Elemental carbon (EC) is produced by incomplete combustion of carbon-based fuels, principally fossil fuels and biomass (e.g., CitationStreets et al. 2003; CitationBond et al. 2004). Generally, EC is also referred to as black carbon (BC). EC has been identified as making important contributions to the radiative heating of the atmosphere (e.g., CitationHaywood et al. 1997; CitationMyhre et al. 1998; CitationJacobson et al. 2001). It can also contribute to climate forcing by changing snow and ice albedos (CitationHansen and Nazarenko 2004). EC particles have been shown to be agglomerates of spherical graphitic carbon with primary diameters of 15–50 nm. Usually, EC particles have organic carbon (OC) coatings upon emission (e.g., CitationSeinfeld and Pandis 1998; CitationPark et al. 2004a, Citation2004b). EC particles are further coated with various non-refractory compounds (inorganic and organic) by condensation and coagulation as they age in the atmosphere (e.g., CitationRiemer et al. 2004). Size distributions of EC near emission sources (Tokyo) were measured by CitationKondo et al. (2006) using a calibrated Scanning Mobility Particle Sizer combined with a heated inlet. A majority of the EC mass concentration was in diameters between 50–200 nm, peaking at around 130 nm. Optical properties of EC, usually represented by the mass-normalized absorption cross section (m2/g), depend on how the EC is distributed by size. Furthermore, experiments (e.g., CitationSchnaiter et al. 2005; CitationMikhailov et al. 2006) and theoretical calculations (e.g., CitationFuller et al. 1999) have shown that the absorption cross section increases strongly when EC particles are internally mixed (e.g., coated by non-refractory materials). Therefore it is important to measure the size distributions and mixing states of EC for an improved estimate of its climate impact of EC. The Single Particle Soot Photometer (SP2) (Droplet Measurement Technologies (DMT), Boulder, CO) was designed for measurements of the size-segregated concentration of EC by laser-induced incandescence (LII) using continuum laser (CitationStephens et al. 2003; CitationBaumgardner et al. 2004; CitationSchwarz et al. 2006). The scattering waveforms measured by the SP2 can be used to diagnose the mixing state of EC (CitationSchwarz et al. 2006; CitationGao et al. 2006). Studies of the effect of internal mixing of EC particles on quantitative measurements by LII are limited because the majority of previous LII studies focus on measurements in the vicinity of combustion sources (e.g., burner flame, mobile exhaust) where EC is rarely internally mixed with non-refractory materials (e.g., CitationEckbreth 1977; CitationMelton 1984; CitationMichelsen 2003; CitationMichelsen et al. 2003). In addition, prior to the SP2, all LII studies used pulsed lasers and required high concentrations of EC particles, in contrast to the particle-by-particle approach used in the SP2.
Some observational results of EC in the free troposphere using the LII technique have been reported (CitationBaumgardner et al. 2004; CitationSchwarz et al. 2006). Interpretation of these measurements necessitates an improved understanding of possible interferences from the coating by non-refractory materials on the LII response. CitationSlowik et al. (2006) and CitationGao et al. (2006) first reported the relationship between the EC mixing state and the LII and scattering signals. According to CitationSlowik et al. (2006), the EC particles were coated by either oleic acid (liquid) or anthracene (solid) to thicknesses of up to 100 nm. It was found that (1) the peak intensity of LII was independent of coating thickness, (2) the colour temperature of the LII did not change with coating, and (3) the waveform of the scattering signal changed with the increasing coating thickness. For applications of the SP2 instrument to atmospheric measurements, data for a wider range of coating thickness are desired.
The objective of this study is to fully characterize and interpret the relationships between the LII and scattering signals of the SP2 instrument and the properties of the non-refractory coating on EC particles. We used commercially available graphite particles as a surrogate of EC and have developed a new system using a Tandem Differential Mobility Analyzer (TDMA) for aerosol coating to generate layers of known size. We have also developed a new theoretical model that calculates time-dependent LII signals of the particle consisting of absorbing core and non-absorbing shell. The model calculations are used for the interpretation of some representative experimental data.
2. DMT-SINGLE PARTICLE SOOT PHOTOMETER (SP2)
2.1. Instrument Configuration
The operational principle of the SP2 has been described in previous studies (CitationStephens et al. 2003; CitationBaumgarder et al. 2004; CitationSchwarz et al. 2006; CitationSlowik et al. 2006; CitationGao et al. 2006). The schematic diagram of the SP2 is depicted in .
FIG. 1 Schematic diagram of the single-particle soot photometer (SP2). Although the axis of the aerosol jet is perpendicular to the plane containing the APDs and the beam of the YAG laser, it is drawn in parallel for simplicity.
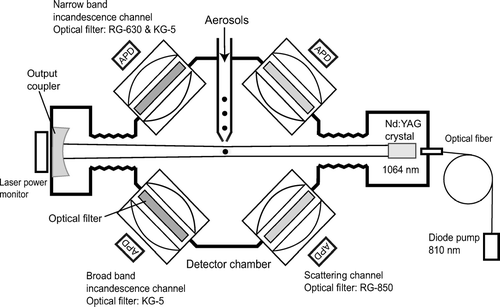
An air jet containing sample aerosol intersects an intense (∼ 1 MW cm− 2), Nd:YAG, intra-cavity, continuous laser beam (λ = 1064 nm) pumped by a diode laser. The laser is in a TEM00 mode, with a Gaussian intensity distribution (CitationStephens et al. 2003; CitationSchwarz et al. 2006). Aerosol particles elastically scatter light in the laser beam and, if they contain light absorbing material at the wavelength of the incident light, like EC, they are also heated as they absorb the laser radiation and eventually incandesce and vaporize due to evaporation at high temperatures. The mass of EC with diameters between about 150–1000 nm is derived by measuring the intensity of the LII signal from individual particles. Non-light absorbing aerosols, such as sulfate, nitrate, and organics, elastically scatter laser light without evaporation during laser irradiation. The size of non-light absorbing aerosol with diameter of 250–1000 nm can be measured by the intensity of scattering. EC particles coated by non-light absorbing material scatter laser light more efficiently than uncoated EC due to the larger scattering cross section (CitationSlowik et al. 2006). We can constrain the chemical composition of an incandescing particle based on the temperature at the point of peak LII intensity because it is a proxy of the boiling point of the composition (CitationStephens et al. 2003; CitationBaumgardner et al. 2004; Schwarz et al. Citation2006). Scattering signals, in comparison with the LII signals, are also used for assessing the coating state of EC particles (CitationSchwarz et al. 2006; CitationGao et al. 2006).
The laser beam power is monitored by a detector that measures a small fraction of the light that passes through the output coupler with an efficiency of 15 part per million (ppm). The light detection system consists of four detectors; one for scattered light, two for LII, and one for redundancy. Each detector system consists of an avalanche photo-diode (APD) (Perkin Elmer C30916E), a complex lens to focus light onto the APD, and optical filters. The broadband and narrowband LII channels are equipped with band pass filters for wavelength regions of λ = 350–800 nm (Schott KG5) and λ = 630–800 nm (Schott KG5 and RG630), respectively. The scattering channel uses a low pass filter that rejects light at λ < 850 nm (Schott RG850). The solid angle Δ Ω (str) of light collection for the lens system is calculated as
FIG. 2 Spherical coordinates of the laser cavity of the SP2. The θ -plane contains the APDs and the beam of the YAG laser. The ϕ-plane contains the aerosol jet and it is perpendicular to the beam of the YAG laser.
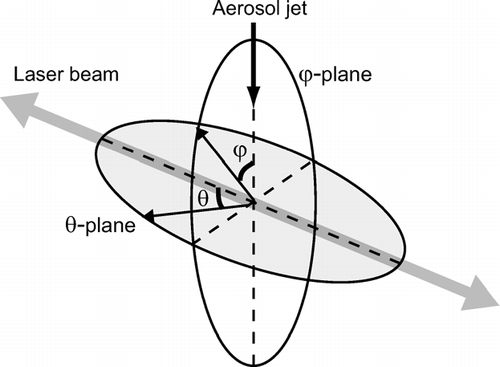
The ϕ -plane is parallel to the aerosol jet and perpendicular to the laser beam. The laser beam and four detectors are located in the θ-plane. The amplified voltage signal is digitized by an A-D converter at a sampling rate of 5 MHz (i.e., time resolution of 0.2 μ s) for each channel. The duration of the light pulse is equal to the transit time of a particle in the laser beam, which is typically about 10 μ s. The time resolution of 0.2 μ s for sampling is adequate for recording the temporal evolution of LII and scattering intensities of single particles.
2.2. Formulation of the LII and Scattering Signals
First of all, we give formulations of SP2 signals for systematic interpretation of experimental data and modeling results presented in this paper. The output signals (V) for the broadband and narrowband LII channels, S bb(t) and S nb(t), respectively, at a time t are expressed as a function of a particle diameter (D p ), emissivity (ϵ, particle temperature (T), responsivity of the APD (η), and mathematical constants (s bband s nb). In the case of a spherical particle, S bb(t) and S nb(t) are written as
The blackbody temperature of an incandescing particle is determined by the ratio of the LII intensity at different wavelengths. LII signals from broadband (S bb) and narrowband (S nb) channels represent radiances at λ = 350–800 nm and λ = 630–800 nm, respectively. The S bb/S nb ratio is expressed as follows.
Assuming that ϵ is independent of wavelength within the region of λ = 350–800 nm, Equation (Equation5) can be approximated by the liner relationship
Possible errors in determining T caused by the assumption of constant ϵ are assessed for the case of spherical graphite particles. shows spectral emissivities of spherical graphite particles for several diameters calculated using a Mie-scattering code of CitationBohren and Huffman (1983). The spectral hemispherical emissivity of a flat surface (i.e., infinite particle diameter) was calculated according to CitationModest (2003), and is also shown for reference. We used the spectral refractive index of graphite by CitationBorghesi and Guizzetti (1991) for these calculations. The refractive index of graphite depends only weakly on λ for λ = 350–800 nm (CitationBorghesi and Guizzetti 1991). The ϵ depends on the size parameter of the particle (π D p /λ) (CitationBohren and Huffman 1983). Because of this effect, ϵ depends on λ more strongly for smaller D p as seen in . ϵ is proportional to D p for D p /λ ≪ 1 and independent of D p for π D p /λ ≫ 1. For π D p /λ ≪ 1, the LII intensity of Equation (2a) is proportional to D p 3, consistent with the observed S bb peak -EC mass linear relationship discussed above. Relationships between S bb/S nb and T for particles with different diameters, including a flat surface, are calculated by Equation (Equation5) using these ϵ values and are shown in .
FIG. 3 (a) Spectral emissivity of graphite particles: dependence on particle diameter. (b) Relationship between detected intensity ratio of broadband to narrowband channel and temperature: dependence on particle diameter. Average values of measured S bb/S nb at incandescence peak for graphite particles with diameters of 110 and 200 nm are also shown.
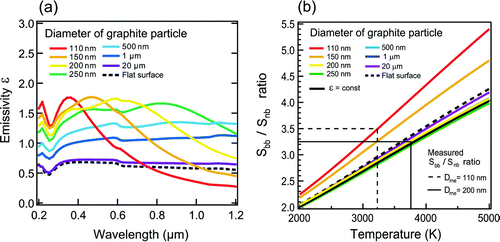
The S bb/S nb values measured for graphite particles with mass equivalent diameters (D me) = 110 and 200 nm are also shown for reference. The uncertainty of emissivities due to non-sphericity of the graphite particles (discussed in section 3.1) are not quantified. For D p > 200 nm, the dependence of ϵ on λ is weak and therefore the S bb/S nb−T relationship does not depend on D p . For D p < 200 nm, ϵ depends more strongly on λ, leading to deviations of the S bb/S nb-T relationship from that for D p > 200 nm. For D p = 110 nm, the deviation amounts to ∼ 700 K. It is noted that the observed S bb/S nb ratios decrease somewhat with the increase in diameter. Therefore, dependencies of the predicted S bb/S nb-T relationship and the observed S bb/S nb ratios need be considered in estimating T.
The output signal (V) of the scattered light S sc is expressed as
3. LABORATORY EXPERIMENTS
3.1. Characterization of Graphite Particles
Colloidal graphite particles were used as a surrogate for EC in order to investigate the effects of mixing state on incandescence and scattering signals obtained by the SP2. The thermo-chemical and optical properties of graphite particles are better understood than those of other materials, including glassy carbon and flame-generated soot. However, the morphology (shape of individual particles; aggregate or non-aggregate) of graphite particles is poorly known. Knowledge of particle morphology is important for the coating experiment, because irreversible changes in the morphology of soot occur by condensation of liquid compounds (CitationMikhailov et al. 2006). In addition to this, mass equivalent diameters (D me) need to be measured so as to uniquely define the volume of compounds that coat the non-spherical particles.
First of all, we measured the shapes of a representative sample of graphite particles using a transmission electron microscope (TEM). For this purpose, graphite particles were generated by atomizing a 50 mL ethanol solution in which 0.1 g of colloidal graphite (stock# 41773, Alfa Aesar, Inc., Ward Hill, MA, USA) was dispersed. After atomization, the graphite particles were passed through a thermo-denuder (inner diameter = 9 mm and total length = 1.2 m) consisting of a heated tube maintained at 400°C and an activated charcoal tube, as shown in .
FIG. 4 Schematics of the laboratory experiment for collecting the TEM samples ([1]) and measuring the mass-mobility relationship ([1]+[2]) of colloidal graphite particles.
![FIG. 4 Schematics of the laboratory experiment for collecting the TEM samples ([1]) and measuring the mass-mobility relationship ([1]+[2]) of colloidal graphite particles.](/cms/asset/9029cb42-57c5-44de-92e6-6f305a2c1873/uast_a_219894_o_f0004g.gif)
The air flow rate was maintained at 5–12 cm3 s−1. The thermo-denuder removed ethanol and the dispersing agent (isopropanol) contained in colloidal graphite. Then, the graphite particles were size-selected by a differential mobility analyzer (DMA; TSI model 3081). Both size-selected and unselected graphite particles were collected on collodion films with a Cu-grid for TEM analysis downstream and upstream of the DMA, respectively. The TEM images of the collected particles were obtained by a JEM-400 TEM (JEOL Ltd., Japan) operated at 400 kV at the Center of Advanced Technology of Aoyama Gakuin University in Kanagawa, Japan. shows the TEM image of the graphite particles with mobility diameter (D mob) of 200 nm. is the image of size-unselected particles.
FIG. 5 TEM images of colloidal graphite (Alfa Aesar, Inc, Stock# 41773) particles collected on collodion films with Cu-grid. (a) Collected downstream of the DMA with a transmission mobility diameter of 200 nm. (b) Collected downstream of thermo-denuder prior to sizing by DMA.
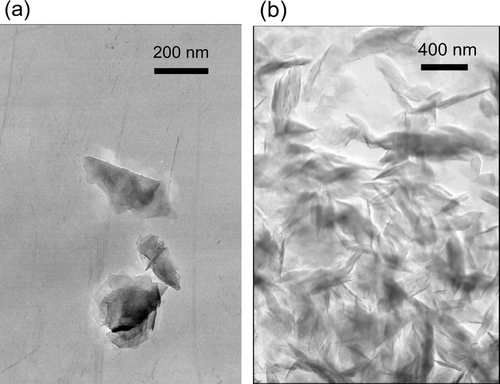
As shown by these images, graphite particles were non-spherical. However, they were not branched-aggregates, unlike combustion-generated soot. Therefore, graphite particles will change their shapes very little with the condensation of volatile compounds.
Secondly, we measured D me using the DMA-APM (Aerosol Particle Mass analyzer) system (e.g., CitationMcMurry et al. 2002) shown in . The APM measured masses of graphite particles that were mobility size selected by the DMA. For these measurements, the flow rates of the sample air and the sheath air of DMA were maintained at 5 and 100 cm3s−1, respectively. This sheath/sample flow ratio leads to a D mob-transmission width of 5%. The D mob values were set to 150, 200, and 250 nm. Detailed descriptions of the APM are given elsewhere (CitationEhara et al. 1996; CitationMcMurry et al. 2002). APM model 302 (KANOMAX, Inc., Osaka, Japan) was used for this study. The radius of the inner (r 1) and outer (r 2) electrodes of the APM model 302 are 50 mm and 52 mm, respectively. The rotational speed (ω) of the APM cylinder was varied between 3000 and 4000 rpm, and the voltage of the electrode (V APM) was scanned from 25 to 900 V, depending on D mob (150–250 nm). During the APM voltage scan, the number concentration of particles downstream of the APM was measured by using a condensation particle counter (CPC; TSI model 3022A) to obtain mass distribution of the particles. The central mass m cen is calculated by equating the centrifugal force and electric forces accelerating a particle in the annular gap
shows the number concentrations of graphite particles as a function of m cen for D mob = 150, 200, and 250 nm.
FIG. 6 Mass spectra of colloidal graphite particles with mobility diameters of (a) 150 nm, (b) 200 nm, and (c) 250 nm.
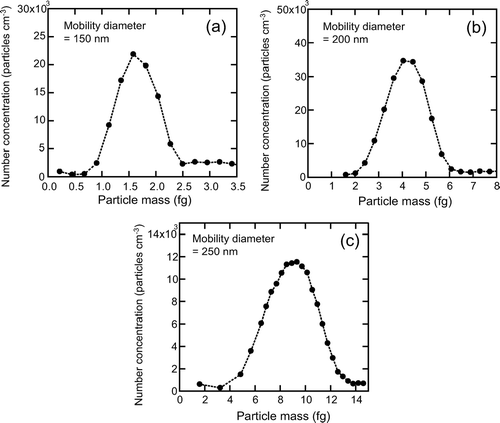
The peaks of the masses for these D mob values were 1.65, 4.20, and 8.94 fg, respectively. D me was calculated by using the mass-D mob relationship, assuming that the bulk density of graphite at room temperature is 2.26 g cm−3 (CitationMichelsen 2003). The D me for particles with D mob = 150, 200, and 250 nm were derived to be 112, 153, and 196 nm, respectively.
3.2. Experimental Setup
This study uses a core-shell model () for quantitative expression of the mixing state of coated particles. As discussed in section 2.2, a particle can be identified as EC by the T peak and the mass is measured by the S bb peak essentially for uncoated EC particles. However, effects of the coating on EC on T peak and S bb(t) are poorly understood, especially when thickness exceeds 100 nm. We conducted laboratory experiments to quantify possible interference of the coating on these parameters. For this purpose, we used a simple apparatus by which core particles were coated by low vapor pressure liquid compounds, as depicted in .
FIG. 7 Model of internally mixed particle of core-shell morphology: Definition of core diameter (D c ) and particle diameter (D p ).
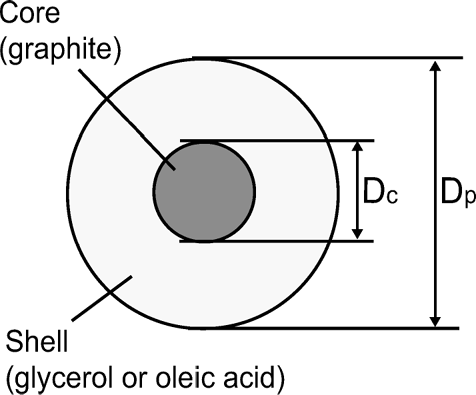
FIG. 8 Schematic diagram of the coating apparatus.
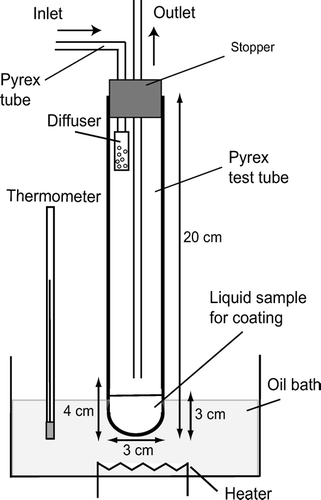
Core particles (PSL or graphite) were generated by an atomizer (Model 3076 (PSL) and Model 9302 (graphite), TSI, Inc., Shoreview, MN, USA). They were introduced to a Pyrex test tube partially filled by liquid organic material; glycerol (B.P. = 290°C) and oleic acid (B.P. = 360°C) were used for the present study. These organic liquids were vaporized by heating to about 100°C then re-condensed onto the core particles. The flow rate of air containing the core particles was 12 cm3 s−1, and the number concentration of the particles was maintained at about 103 particles cm−3. We first used PSL as core particles in order to characterize the performance of the coating apparatus. A core diameter (D c ) of 150 nm was chosen for this test. The size distributions of the coated particles were measured with a Scanning Mobility Particle Sizer (SMPS) consisting of a TSI model 3081 DMA and a TSI model 3022A CPC. shows the measured size distributions as a function of the particle diameter (D p ) for two oil bath temperatures.
FIG. 9 Size distributions of oleic acid-coated PSL particles: Dependence on oil bath temperature of the coating apparatus.
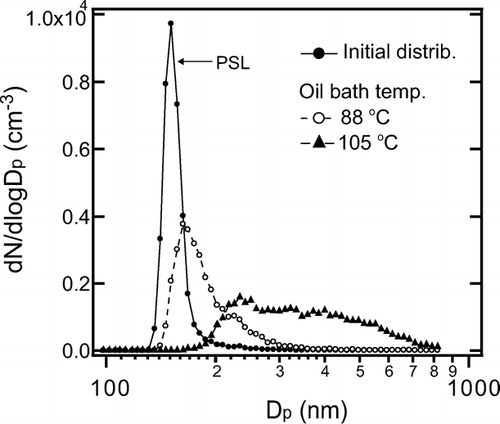
The initial size distribution of PSL (D c = 150 nm) is also shown for reference. The size distribution of the coated particles was adjusted by controlling the oil bath temperature. It was found that coated particles with D p < 800 nm were generated by maintaining the oil bath temperature at 70 ± 5°C and 100 ± 5°C for glycerol and oleic acid, respectively. At these oil bath temperatures, particles with diameters smaller than 150 nm were not observed, indicating that new particle formation by homogeneous nucleation of the organic vapor did not occur. We generated graphite particles coated by organic materials with fixed D c and D p using the system, schematically shown in .
FIG. 10 Schematics of the laboratory experiment for measuring LII and scattering signals of SP2 for organic-coated graphite particles.
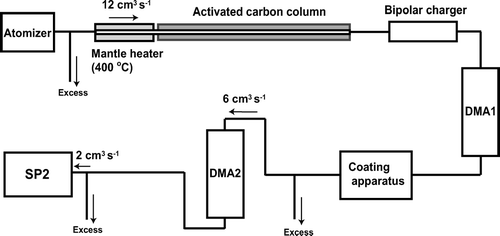
These graphite particles were size selected by the DMA 1 (TSI model 3081). D mob of selection were 150, 200, and 250 nm in this study. For graphite particles, we defined the graphite core diameter as D c = D me (= 112, 153, and 196 nm) calculated from D mob, as discussed in section 3.1. For simplicity, we used approximate D c values of 110, 150, and 200 nm, which differ from the above values by 2%. The mono-disperse graphite particles with a diameter of D c were introduced to the apparatus for coating by glycerol or oleic acid. Before being sampled by the SP2, the coated particles were size selected (D p ) again by the second DMA (DMA 2, TSI model 3081), which was operated at an aerosol flow rate of 6 cm3 s−1. Sheath/sample flow ratios of DMA 1 and DMA 2 were maintained at 9–18, depending on the selection diameter. In this range of sheath/sample flow ratios, the size transmission width of the DMA is estimated to be narrower than ±6%. It was found that the size distribution and number concentration of coated particles did not change within the measurement uncertainties during transport through the 3.8 mm inner diameter copper tubes between DMA 2 and SP2. Coated particles with D c = 110, 150, and 200 nm and D p < 800 nm were measured by the SP2. For uncoated graphite particle, D p is defined as D p = D c . Doubly charged particles were easily discriminated from singly charged particles and were rejected because both D c and D p of doubly charged particles were about twice as large as those of singly charged particles. In previous studies, coated particles with fixed D p were generated by controlling the vapor pressures of condensable gases or the residence time of core particles within the vapor (CitationCruz and Pandis 1998; CitationHansson et al. 1998; CitationJoutsensaari et al. 2001; CitationKatrib et al. 2004). For the present study, D p was directly controlled by the DMA with a good accuracy, as described above. It should be noted that both glycerol and oleic acid are resistant to pyrolysis. Possible effects of pyrolysis on LII signals would be smaller than those for organic compounds that pyrolyze without vaporization (e.g., sugar, humic acid).
4. EXPERIMENTAL RESULTS
4.1. Waveforms of LII and Scattering Signals
shows the measured S bb(t) and S sc(t) for individual glycerol-coated graphite particles with D c = 150 nm and D p = D c , 300, 400, and 500 nm. The coating thicknesses defined as Δ D p = D p − D c , were 0, 150, 250, and 350 nm, respectively. Here, we introduce the symbol S sc peak to denote the maximum value of S sc(t). For , we selected the data with average S bb peak and S sc peak (within 5% of the average values for 103 particles sampled). The absolute times when the incandescing particles encounter the laser beam cannot be determined; t = 0 in does not necessarily correspond to the time when the particle was located at the center of the laser beam. As shown in , S bb peak did not significantly depend on D p as discussed in more detail in section 4.4. However, the width (FWHM) of S bb(t) decreased by 50% with an increase in D p from D c () to 500 nm (). The decrease of the width is likely due to faster sublimation of graphite at larger Δ D p as discussed in section 5.2. The S sc peak strongly depended on D p as did the time difference (Δ t) between the time (t S ) of the S sc(t) = S sc peak and the time (t I ) of S bb(t) = S bb peak, as shown in . For a thin coating with Δ D p = 150 nm, S sc(t) showed a single peak near t I with Δ t = 0–1 μs, similarly to the uncoated particles with Δ D p = 0 nm ( and ). In this case, the scattering peak was due to the scattering by uncoated graphite, after the coating completely evaporated.
FIG. 11 D p dependence of waveforms of LII and scattering signals of glycerol-coated graphite particle of D c = 150 nm. The times for peaks of LII (t I ) and scattering (t S ) are also shown. (a) D p = D c (uncoated graphite), (b) D p = 300 nm, (c) D p = 400 nm, and (d) D p = 500 nm.
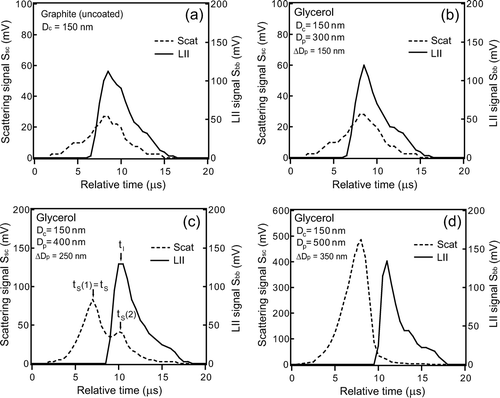
For ΔD p = 250 nm (D p = 400 nm), a scattering peak was observed at t = t S (1), 3–4 μs prior to t I as shown in . For this Δ D p , evaporation rate of the coated materials was slower and the scattering cross section of coated particle was larger than that for Δ D p = 150 nm. The first scattering peak at t = t S (1) is due to the scattering by the coated material. S sc (t) also showed a second peak at t = t S (2), close to t I , indicating that this peak was due to scattering by the core. For Δ D p = 350 nm, only the first scattering peak was observed, with S sc peak several times higher than that for Δ D p = 250 nm (). In this case, the second peak by the core was not seen because it was much weaker than the first peak. shows the S bb(t) and S sc(t) measured for oleic acid-coated graphite particles with D c = 150 nm and with (a) D p = 300 nm and (b) D p = 400 nm.
FIG. 12 Waveforms of LII and scattering signals of oleic acid-coated graphite particles of D c = 150 nm. (a) D p = 300 nm and (b) D p = 400 nm. The times for peaks of LII (t I ) and scattering (t S ) are also shown.
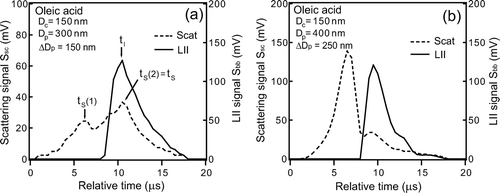
In contrast to glycerol coating, even for Δ D p = 150 nm, the scattering peak by the coated material was observed at t = t S (1) (). The first scattering peak at t = t S (1) was smaller than the second peak at t = t S (2). Furthermore, for Δ D p = 250 nm, S sc peak for oleic acid coating was about 2 times larger than that for glycerol coating. Refractive indices of glycerol and oleic acid differ only by about 1% ( and ), leading to only 5% difference in the scattering cross sections. It is likely that the larger S sc peak for oleic acid was due to the slower evaporation. The slower evaporation of oleic acid may be due to its higher boiling point.
TABLE 1b The parameters and functions of glycerol used in LII modeling
TABLE 1c The parameters and functions of oleic acid used in LII modeling
4.2. Time Delay of LII Peak
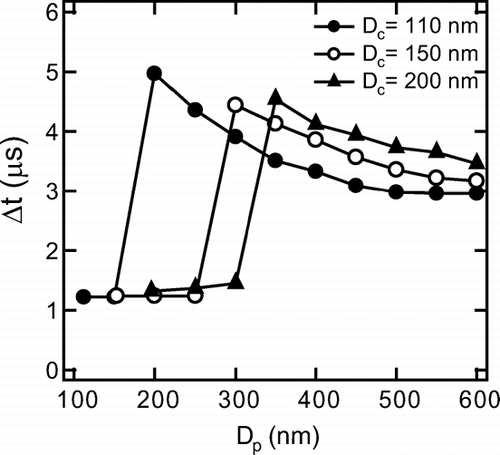
As discussed in section 4.1, the time delay of the LII peak (Δ t = t I −t S ) is an indicator of coating state. For thin-coated graphite particles, it is difficult to routinely extract information of coating state from the first scattering peak with sufficiently high signal-to-noise ratios when the S sc(t) signal is weak, although with visual inspection, it will be possible to use the information of the first peak, at least in laboratory studies. The fluctuation of the S sc(t) for ambient EC particles was larger than that for graphite particles probably because of the presumably irregular shapes of ambient EC. Thus, the practical use of the first scattering peak is more limited for ambient EC if the first scattering peak was comparable or smaller than the second peak. Therefore, in the present study, we defined Δ t = t I −t S only for the largest scattering peak (S sc peak) in the S sc(t) signal. shows Δ t as a function of D p for D c = 110, 150, and 200 nm.
FIG. 13 Scattering peak-to-LII peak time delay (Δ t) for organic-coated graphite particles of D c = 110, 150, and 200 nm. Each data point is average value of 103 particles. (b) Scattering peak-to-LII peak time delay (Δ t) for internally mixed ambient EC of D c = 150, 200, and 250 nm. Each data point is the average value of 103 particles.
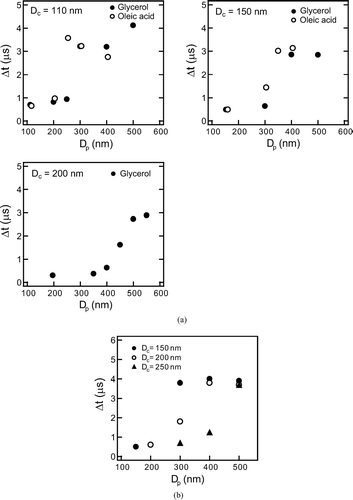
For each D c , Δ t showed a discontinuous increase with the increase in D p . If the scattering peak by uncoated graphite (second peak) is larger than that by coated graphite particle (first peak), Δ t is close to zero (0-1 μ s) as in the case of (D c , D p ) = (150 nm, 300 nm) shown in . If two scattering peak heights become equal, Δ t changes discontinuously by definition. This transition in Δ t was observed for organic-coated graphite for each D c as shown in where Δ t was 0–1 μ s (short-Δ t) for thin-coating and 3–4 μ s (long-Δ t) for thick-coating. For D c = 110 nm, as an example, transition of Δ t occurred at Δ D p = 170 nm (D p = 280 nm) for glycerol and Δ D p = 120 nm (D p = 230 nm) for oleic acid. Here, the threshold Δ D p for Δ t-transition, denoted as Δ D p * hereafter, was defined as Δ D p , where the short-Δ t and long-Δ t were observed with the same frequency. For D c = 110–200 nm, the transition from short-Δ t to long-Δ t occurred at Δ D p * ∼ 150–250 nm for glycerol-coated graphite and at Δ D p * ∼ 100–150 nm for oleic-acid coated graphite. For oleic-acid, the Δ D p * values were smaller than glycerol by about 50 nm, because of the slower evaporation rate mentioned in section 4.1. The Δ D p * gives a measure of the minimum detectable thickness of coating on the graphite.
The Δ D p * was also measured for EC particles coated by non-refractory compounds in ambient air in the suburbs of Tokyo, Japan in the summer of 2004. For this measurement, the D p of coated EC particles was selected by DMA (Model 3081, TSI inc.) after drying the aerosol flow by using a diffusion dryer (Model 3062, TSI inc.). The D c of the EC particles was defined as mass equivalent diameter with a bulk density of 1.77 g/cm3 (CitationPark et al. 2004b). The mass of EC particles was measured by using calibrated S bb peak-EC mass relationship obtained by sampling ambient EC particles. For this calibration, the EC mass was selected by using a system consisting of an inlet heated at 400°C, a DMA, and an APM (CitationKondo et al. 2006). The results for D c = 150, 200, and 250 nm are shown in .
The Δ D p * of the coated EC in ambient air was about 100–200 nm, similar to that of organic-coated graphite particles for D c = 110–200 nm, and the values of short-Δ t and long-Δ t were 0–1 μ s and 3–4 μ s, respectively. These observations, together with the laboratory experiments demonstrate that the Δ t is an indicator of coating on EC with Δ D p > about 100–200 nm for D c = 150–250 nm.
We also examine the dependence of the Δ D p -Δ t relationship on laser power with laboratory experiment. For D c = 110 nm and Δ D p = 290 nm, and for D c = 150 nm and Δ D p = 350 nm, the long-Δ t values decreased (increased) by only about 0.5 μ s with changes of laser power by +(−)40% from normal operating values (i.e., I 0 = 0.47–0.85 MW/cm2). For uncoated or thin-coated graphite with D c = 110–200 nm, the short-Δ t was stable from 0–1 μ s, depending little on the change of the laser power. For field measurements, the laser power was tuned to within ± 15% of the normal operating values (0.65 ± 0.1 MW/cm2). This ± 15% variability should not influence the Δ D p * values derived above.
4.3. Dependence of T peak and S bb peak on Coating
The peak temperatures (T peak) of coated graphite particles were determined from the measured S bb peak/S nb peak using the S bb/S nb-T relationship shown in . and show T peak of coated graphite with D c = 110 and 200 nm, as a function of D p .
FIG. 14 D p dependence of particle temperature at the time of the LII peak for organic-coated graphite particles of (a) D c = 110 nm and (b) D c = 200 nm.
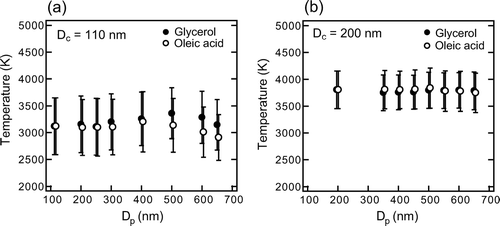
Each data point represents the average value of data from about 103 particles and the vertical bars represent 1σ. For uncoated graphite with D c = 200 nm and Δ D p = 0 nm, the T peak was 3800 ± 300 K (± 1σ). The average T peak value changed only to within ± 3% for glycerol and oleic acid-coated particles with Δ D p ≤ 450 nm (D p ≤ 650 nm). Similarly, for uncoated particles with D c = 110 nm and 150 nm (not shown), T peak were 3100 ± 500 K and 3500 ± 200 K, respectively, and changed only to within 10 and 5% by coating with Δ D p ≤ 500–600 nm. The observed changes in the average T peak up to ∼ 200 K with the increase in coating with Δ D p up to 500–600 nm were much smaller than the difference of the boiling points between graphite (4100 K) and metals; the B.P. of iron, niobium, and aluminum are 3130 K, 5010 K, and 2790 K, respectively (Gale and Totemeier 2004). These results indicate that graphite can be discriminated from other metals by using T peak, independent of coating on graphite with Δ D p ≤ 500–600 nm. For graphite particles with D c ∼ 200 nm, the constant emissivity assumption is generally valid, as discussed in section 2.2 (see also ) and the T peak value for D c = 200 nm was about 3800 K in this study. This value is consistent with the T peak of various carbon particles (including graphite) reported by CitationSchwarz et al. (2006) (∼3700–4300 K) estimated by using λ -independent emissivity.
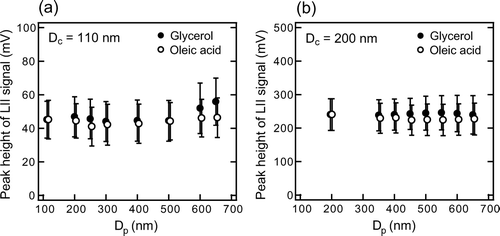
and show the measured S bb peak of coated graphite of D c = 110 and 200 nm as a function of D p . The S bb peakwas stable to within ± 10% for Δ D p ≤ 450–550 nm. Similar results were obtained for D c = 150 nm with Δ D p ≤ 650 nm (not shown). CitationSchwarz et al. (2006) and CitationSlowik et al. (2006) reported the S bb peak of flame-generated EC did not change with coating of oleic acid or anthracene up to 100 nm thickness. The present experiments, together with their results, indicate that the EC mass-S bb peak relationship has no interference from coatings with Δ D p up to ∼600 nm.
FIG. 15 D p dependence of peak intensity of LII signal of organic-coated graphite particles of (a) D c = 110 nm and (b) D c = 200 nm.
4.4. Waveforms of Very Thick-Coated Graphite
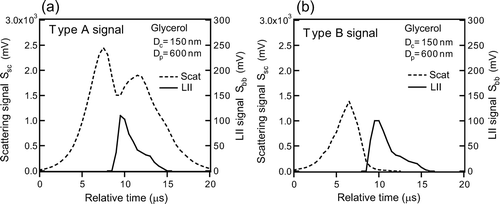
For very thick-coated graphite particles, high intensities of S sc(t) lasted even after the decay of S bb(t) (Type A), depending on Δ D p . is an example of the Type A particle for glycerol-coated graphite particle with (D c , D p ) = (150 nm, 600 nm). The width of S sc(t) of the Type A particles was much larger than that for the particles discussed in section 4.1 (Type B) as shown in .
FIG. 16 Waveforms of LII and scattering signals of thick-coated graphite: (a) Type A and (b) Type B signal for glycerol-coated graphite particles with D c = 150 nm and D p = 600 nm.
The type A and the type B were clearly separated by the FWHM of the Gaussian-fitting of S sc(t). Type A (B) particles were defined as those with FWHM larger (smaller) than 6 μ s. Another feature of the Type A particles is that S sc(t) had two peaks. The fraction of Type A particles increased with the increase in D p , as shown in .
FIG. 17 Count fractions of Type A signals of organic-coated graphite particles with D c = 110, 150, and 200 nm plotted versus D p .
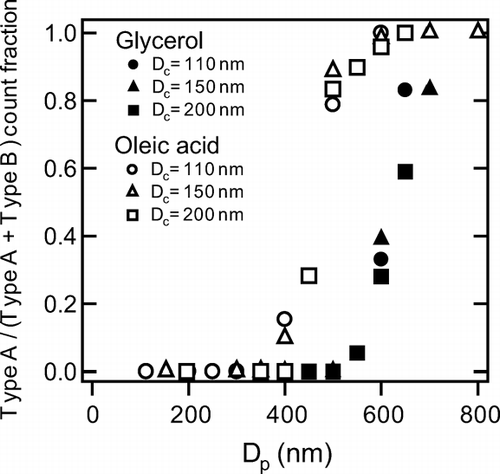
At a D p of about 400 nm (500 nm) for oleic acid (glycerol) coating, the fraction of Type A rapidly increased irrespective of D c at 110–200 nm. For oleic acid coating, the fraction of Type A particle started to increase at D p about 150 nm smaller than that for glycerol. The difference in the heat transfer properties (e.g., thermal diffusivity) may cause this difference.
The S sc(t) for Type A particles can be explained by the breakup of an internally mixed particle (CitationGao, R. S., private communication, 2006). We consider a coated particle in which the graphite core is eccentrically positioned and hypothesize that: (1) the evaporation rate of coating material in the laser beam is faster on the surface closer to the graphite core than the surface on the opposite side, because the heat flux supplied by thermal conduction from the graphite core is larger; the first peak of the S sc(t) () occurs in this period, (2) the coated particle breaks up into a graphite particle and a remaining organic particle, and (3) the graphite particle immediately heats up to vaporization temperature and incandesces. The organic particle no longer evaporates and continues to move inward with respect to the Gaussian laser beam, resulting in the second peak of the S sc(t) (). In this case, the position of the second scattering peak is considered to be the center of the Gaussian beam.
5. MODEL
5.1. Model Description
In this section, we discuss important features of the observed S bb(t) and S sc(t) of organic-coated graphite particles by comparing them with theoretical calculations. A time-dependent LII model was developed to analyze the dependence of S bb(t) and S sc(t) on D c , D p , and coating material. There are a number of studies on the modeling of the physical processes (e.g., temporal development of temperature and evaporation rate) controlling the LII signal for uncoated soot or graphite (CitationSchulz et al. 2006, and references therein). LII and scattering signals obtained by the SP2 have been modeled by CitationStephens et al. (2003), accounting for only uncoated graphite particles.
This is the first study of modeling of the LII and scattering signals of internally mixed particles. Here, details of the LII model used in this study are described. Energy transfer processes that determine the internal energy of a coated graphite particle are the heating of the particle by light absorption and cooling by (1) heat conduction to ambient air, (2) radiative emission (incandescence), and (3) evaporative heat loss. First, changes in temperature, T(t), are calculated from energy conservation. The evaporation rate of particles is calculated assuming equilibrium vapor pressures at the particle surface followed by diffusion of the vapor to the surrounding air. T(t) and D p (t) are calculated by solving the simultaneous equation for energy and mass conservation at each time step. Equating the rate of change of the internal energy to the sum of the rates of heating and cooling, we obtain energy conservation equation
TABLE 1a The parameters and functions of graphite used in LII modeling
Rewriting Equation (Equation17), the rate of D p change is given by
Several simplifications have been made to describe the physical process in the present model. Processes controlling the time development of particle temperature and evaporation of coated graphite particle are more complex than the expressions described above. First of all, heat transfer (i.e., conduction, convection) inside particle should be considered, because thermal conductivities of volatile compounds are generally smaller than those of graphite by orders of magnitude; hence, the homogeneous temperature assumption used in most of the previous LII models for graphite or soot (CitationStephens et al. 2003; CitationSchulz et al. 2006, and references therein) will be unrealistic for coated graphite particles. Secondly, phase transitions of the coating materials during the laser heating of the graphite core are complicated. In addition to the vaporization on the particle surface, a liquid-to-gas phase transition in the coating material may occur on the surface of graphite core due to the rapid heating. As a result, bubbles may form inside the particle leading to explosive desorption of coating material from graphite. In fact, CitationUeno and Shoji (2001) reported the generation of bubbles and shockwaves in water caused by rapid vaporization induced by nanosecond pulsed laser heating of a water-metal interface. Finally, the graphite core is not generally located concentrically inside the internally mixed particle. The temperature distribution in the coated particle will depend on the position of the core. An eccentrically positioned heat source can cause a break up of the particle, as discussed in section 4.4. In the present study, we attempt to obtain the general features of LII and scattering waveforms by using the simplified model without including these complexities.
5.2. Predicted Waveforms of LII and Scattering
The calculated S bb(t), S sc(t), T(t), and D p (t), corresponding to the experimental conditions ( and ) are shown in . and show results for uncoated graphite with D c = 150 nm for α = 0.26 and 0.9. and show results for graphite coated with glycerol or oleic acid with (D c , D p ) = (150 nm, 400 nm) for α = 0.26. For coated graphite, only the results for α = 0.26 are shown because the dependence of temperature and diameter on α is generally unaltered by coating on graphite. It can be seen that the shape, especially the widths, of the calculated S bb(t) and S sc(t) generally agree with those observed ( and ), although the absolute time is unknown for the observations. The most notable point is that the first scattering peak of the coated particle increases with the increase in Δ D p from 0 to 250 nm ( and ), similar to the observations ( and ). The mechanism causing the observed shape (i.e., width, relative position of peaks) of S sc(t) and S bb(t) for coated graphite can be interpreted based on the model results, as detailed below.
FIG. 18 Calculated results for organic-coated graphite particles. Time development of particle diameter and temperature for (a) uncoated graphite with (D c , D p ) = (150 nm, D c ) and (b) glycerol or oleic acid-coated graphite with (D c , D p ) = (150 nm, 400 nm). LII and scattering waveforms for (c) uncoated graphite with (D c , D p ) = (150 nm, D c ) and (d) glycerol or oleic acid coated graphite with (D c , D p ) = (150 nm, 400 nm). For uncoated graphite particles, calculated results with different thermal accommodation coefficients α are shown to demonstrate the dependence of the calculated results on α.
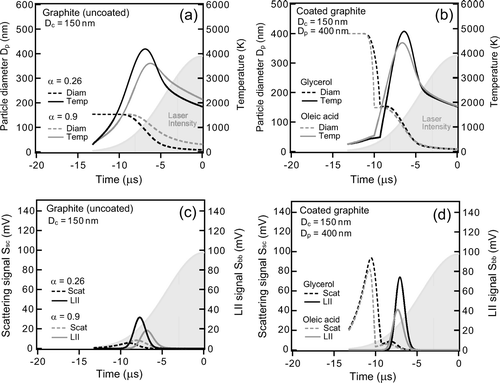
The laser intensity I(t) increases with t, although D p (t) and scattering cross section decreases due to evaporation. Eventually S sc(t), which is proportional to the product of I(t) and the scattering cross section (Equation (Equation7)), reaches a local maximum value. The non-refractory coating of graphite delays the heating of graphite because of the heat loss caused by coating evaporation, as can be seen from the calculated T(t). Therefore, incandescence occurs at locations further inside the laser beam. The evaporation of the graphite particle occurs faster due to stronger I(t), leading to a narrower shape of S bb(t), explaining the observed feature discussed in section 4.1. The calculated Δ t for a glycerol-coated graphite particles is plotted as a function of D p in for D c = 110–200 nm.
FIG. 19 Calculated scattering peak-to-LII peak time delay (Δ t) for glycerol-coated graphite particles of D c = 110, 150, and 200 nm plotted versus D p .
The calculated short-Δ t and long-Δ t were about 1 μ s and 3–4 μ s, respectively in agreement with the observations. This agreement is a direct consequence of the relative peak position of S bb(t) and S sc(t). The calculated Δ D p * was 100–150 nm, in moderate agreement with the experimental data, although the slight decrease in the calculated long-Δ t with the increase in Δ D p was not observed. This strongly supports the interpretation of the experimental data, discussed in sections 4.1–4.2.
There are some discrepancies between experimental data and the model. As shown in , the T(t) and D p (t) are quite sensitive to the assumed value of α . This dependence is a result of the dominance of conductive cooling compared to evaporative and radiative heat loss, i.e., conduction contribute ∼60%, evaporation ∼ 35% and radiation ∼5% for –10 μ s < t < −5 μs). The onset of evaporation is faster for α = 0.26 than that for 0.9 because the increase in evaporative heat loss compensates for the decrease in conductive heat loss. In and , peak temperature changed from 3800 K to 4200 K and S bb peak increased by a factor of 1.5 as α decreased from 0.9 to 0.26. For coated graphite, the model predicted that T peak and S bb peak systematically increase with Δ D p and that they depend significantly on the coating material, in contradiction to the observed results discussed in section 4.2. In addition to this, the calculated S sc peak for glycerol is higher than that for oleic acid, again in contradiction to the observations. The assumptions included in the model discussed in section 5.1 may partly contribute to these discrepancies.
6. SUMMARY AND CONCLUSIONS
We made laboratory experiments to evaluate the relationship between the key parameters measured by the SP2 and EC mixing states. These parameters are peak temperature (T peak), peak LII intensity (S bb peak), and the time delay of the LII peak (Δ t), which are directly related to the determination of the mass of individual EC particles and their mixing states. The measurements were made using graphite particles with core diameters (D c ) of 110–200 nm coated with organic species (glycerol and oleic acid) with thicknesses (Δ D p ) of 100–650 nm. The T peak and S bb peak were observed to depend little on the coating thickness and were close to those for uncoated graphite. The experimental results provide a strong basis to use T peak for constraining chemical composition of incandescing particles and to use S bb peak for measurement of the mass of EC contained in individual particle by the SP2, free of influence by coatings of non-refractory components.
Significant increase in Δ t was detectable for coated particles with Δ D p above certain thresholds (Δ D p *) with sufficiently higher scattering signal levels by coated materials. The increase in Δ t occurred abruptly at Δ D p *, which depended on the core diameter and coating materials to some extent; Δ D p * ∼ 100–200 nm for D c = 110–200 nm. Similar results were obtained for EC particles in ambient air sampled in the suburbs of Tokyo. These results demonstrate that mixing states of EC particles in ambient air can be classified into two categories using the discrete levels of Δ t; thin-coated EC (Δ D p < Δ D p *) or thick-coated (Δ < eqid26 > D p *) EC.
These experimental data were interpreted by using a newly developed theoretical model taking into account physical processes controlling the temperature change and evaporation rate of the coated graphite and assuming homogeneous particle temperature, an equilibrium phase transition at the particle surface, and a concentrically stratified spherical morphology. The features of the waveforms of incandescence and scattering signals of coated graphite particles were in general well reproduced by this model, strongly supporting the validity of the physical interpretation of the SP2 data given in this study.
Acknowledgments
This work was supported by the Ministry of Education, Culture, Sports, Science, and Technology (MEXT), the Japanese Science and Technology Agency (JST), and the global environment research fund of the Japanese Ministry of the Environment (C-051). We are indebted to S. Nakamura for taking TEM images of colloidal graphite particles. We thank Y. Komazaki, N. Takegawa, Y.Miyazaki, M. Koike, and M. Watanabe for assistance in the experiments and giving us useful comments. We also thank D.W. Fahey, J. P. Schwarz, R. S. Gao, J. R. Spackman, G. L. Kok, and D. G. Baumgardner for very stimulating discussions and sharing their works prior to publication.
REFERENCES
- Baumgardner , D. , Kok , G. and Raga , G. 2004 . Warming of Arctic Lower Stratosphere by Light Absorbing Particles . Geophys. Res. Lett. , 31 : L06117
- Bohren , C. F. and Huffman , D. R. 1983 . Absorption and Scattering of Light by Small Particles , New York : John Wiley .
- Bond , T. C. , Streets , D. G. , Yarber , K. F. , Nelson , S. M. , Woo , J.-H. and Klimont , Z. 2004 . A Technology-Based Global Inventory of Black Carbon and Organic Carbon Emissions from Combustion . J. Geophys. Res. , 109 : D14203 doi: 10.1029/2003JD003967
- Borghesi , A. and Guizzetti , G. 1991 . “ Graphite (C) ” . In Handbook of Optical Constants of Solids II , Edited by: Palik , E. D. 449 New York : Academic Press .
- Cruz , C. N. and Pandis , S. N. 1998 . The Effect of Organic Coatings on the Cloud Condensation Nuclei Activation of Inorganic Atmospheric Aerosol . J. Geophys. Res. , 103 ( D11 ) : 13,111 – 13,123 .
- Devienne , F. M. 1967 . “ Accommodation Coefficients and the Solid-Gas Interface ” . In The Solid-Gas Interface , Edited by: Flood , E. A. Volume 2 , 818 New York : Marcel Dekker .
- Eckbreth , A. C. 1977 . Effects of Laser-Modulated Particulate Incandescence on Raman Scattering Diagnostics . J. Appl. Phys. , 48 : 4473 – 4479 .
- Ehara , K. , Hagwood , C. and Coakley , K. J. 1996 . Novel Method to Classify Aerosol Particles According to Their Mass-to-Charge Ratio—Aerosol Particle Mass Analyzer . J. Aerosol Sci. , 27 : 217 – 234 .
- Fried , L. E. and Howard , W. M. 2000 . Explicit Gibbs Free Energy Equation of State Applied to the Carbon Phase Diagram . Phys. Rev. B , 61 : 8734 – 8743 .
- Fuller , E. N. , Schettler , P. D. and Giddings , J. C. 1966 . New Method for Prediction of Binary Gas-Phase Diffusion Coefficients . Ind. Eng. Chem. , 58 : 19 – 27 .
- Fuller , K. A. , Malm , W. C. and Kreidenweis , S. M. 1999 . Effects of Mixing on Extinction by Carbonaceous Particles . J. Geophys. Res. , 104 ( D13 ) : 15,941 – 15,954 .
- Gale , W. F. and Totemeier , T. C. , eds. 2004 . Smithells Metals Reference Book, 8th ed. , Oxford , , UK : Elsevier Butterworth-Heinemann .
- Gao , R. S. , Schwarz , J. P. , Kelly , K. K. , Fahey , D. W. , Watts , L. A. , Thompson , T. L. , Spackman , J. R. , Slowik , J. G. , Cross , E. S. , Han , J.-H. , Davidovits , P. and Worsnop , D. R. 2006 . A Novel Method for Estimating Light-Scattering Properties of Soot Aerosols Using a Modified Single-Particle Soot Photometer . Aerosol Sci. Technol. , submitted
- Hansen , J. and Nazarenko , L. 2004 . Soot Climate Forcing via Snow and Ice Albedos . Proc. Natl. Ac. Sci. , 101 : 423 – 428 .
- Hansson , H.-C. , Rood , M. J. , Koloutsou-Vakakis , S. , Hämeri , K. , Orsini , D. and Wiedensohler , A. 1998 . NaCl Aerosol Particle Hygroscopicity Dependence on Mixing with Organic Compounds . J. Atmos. Chem. , 31 : 321 – 346 .
- Haywood , J. M. , Roberts , D. L. , Slingo , A. , Edwards , J. M. and Shine , K. P. 1997 . General Circulation Model Calculations of the Direct Radiative Forcing by Anthropogenic Sulfate and Fossil-Fuel Soot Aerosol . J. Clim. , 10 : 1562 – 1577 .
- Jacobson , M. Z. 2001 . Strong Radiative Heating due to the Mixing State of Black Carbon in Atmospheric Aerosols . Nature , 409 : 672 – 695 .
- Jaluria , Y. and Torrance , K. E. 2003 . Computational Heat Transfer, , 2nd edition , New York : Taylor & Francis .
- 2001 . Handbook of Oil Chemistry, 4th ed. Lipid and Surfactants , Tokyo , , Japan : Maruzen . Japan Oil Chemists' Society
- Joutsensaari , J. , Vaattovaara , P. , Vesterinen , M. , Hämeri , K. and Laaksonen , A. 2001 . A Novel Tandem Differential Analyzer with Organic Vapour Treatment of Aerosol Particles . Atmos. Chem. Phys. , 1 : 51 – 61 .
- Katrib , Y. , Martin , S. T. , Hung , H.-M. , Rudich , Y. , Zhang , H. , Slowik , J. G. , Davidovits , P. , Jayne , J. T. and Worsnop , D. G. 2004 . Products and Mechanisms of Ozone Reactions with Oleic acid for Aerosol Particles having Core-Shell Morphologies . J. Phys. Chem. A , 108 : 6686 – 6695 .
- Kondo , Y. , Komazaki , Y. , Miyazaki , Y. , Moteki , N. , Takegawa , N. , Kodama , D. , Deguchi , S. , Nogami , M. , Fukuda , M. , Miyakawa , T. , Morino , Y. , Koike , M. , Sakurai , H. and Ehara , K. 2006 . Temporal Variations of Elemental Carbon in Tokyo . J. Geophys. Res , 111 D12205 doi:10.1029/2005JD006257
- Leider , H. R. , Krikorian , O. H. and Young , D. A. 1973 . Thermodynamic Properties of Carbon up to the Critical Point . Carbon , 11 : 555 – 563 .
- Leroy , O. , Perrin , J. , Jolly , J. , Péalat , M. and Lefebvre , M. 1997 . Thermal Accommodation of a Gas on a Surface and Heat Transfer in CVD and PECVD Experiments . J. Phys. D: Appl. Phys. , 30 : 499 – 509 .
- Liu , F. , Daun , K. J. , Snelling , D. R. and Smallwood , G. J. 2006 . Heat Conduction from a Spherical Nano-Particle: Status of Modelling Heat Conduction in Laser-Induced Incandescence . Appl. Phys. B , 83 : 355 – 382 .
- McCoy , B. J. and Cha , C. Y. 1974 . Transport Phenomena in the Rarefied Gas Transition Regime . Chem. Eng. Sci. , 29 : 381 – 388 .
- McMurry , P. H. , Wang , X. , Park , K. and Ehara , K. 2002 . The Relationship between Mass and Mobility of Atmospheric Particles: A New Technique for Measuring Particle Density . Aerosol Sci. Technol , 36 : 227 – 238 .
- Melton , L. A. 1984 . Soot Diagnostics based on Laser Heating . Appl. Opt. , 23 : 2201 – 2208 .
- Michelsen , H. A. 2003 . Understanding and Predicting the Temporal Response of Laser-Induced Incandescence from Carbonaceous Particles . J. Chem. Phys. , 118 : 7012 – 7045 .
- Michelsen , H. A. , Witze , P. O. , Kayes , D. and Hochgreb , S. 2003 . Time-Resolved Laser-Induced Incandescence of Soot: The Influence of Experimental Factors and Microphysical Mechanisms . Appl. Opt. , 42 : 5577 – 5590 .
- Mikhailov , E. F. , Vlasenko , S. S. , Podgorny , I. A. , Ramanathan , V. and Corrigan , C. E. 2006 . Optical Properties of Soot-Water Drop Agglomerates: An Experimental Study . J. Geophys. Res. , 111 D07209 doi:10.1029/2005JD006389
- Modest , F. M. 2003 . Radiative Heat Transfer, 2nd edition, , New York : Academic Press .
- Myhre , G. , Stordal , F. , Restad , K. and Isaksen , I. S. 1998 . Estimation of the Direct Radiative Forcing due to Sulfate and Soot Aerosols, Tellus . Ser., B , 50 : 463 – 477 .
- Omel'chenko , F. S. 1962 . On the Heat Capacity of Glycerol, Izv. Vysshikh. Uchebn. Zaved. . Pishchevaya Tekhnol. , : 97 – 98 .
- Park , K. , Kittelson , D. B. and McMurry , P. H. 2004a . Structural Properties of Diesel Exhaust Particles Measured by Transmission Electron Microscopy (TEM): Relationships to Particle Mass and Mobility . Aerosol Sci. Technol. , 38 : 881 – 889 .
- Park , K. , Kittelson , D. B. , Zachariah , M. R. and McMurry , P. H. 2004b . Measurement of Inherent Material Density of Nanoparticle Agglomerates . J. Nanoparticle Res. , 6 : 267 – 272 .
- Pinnick , R. G. , Pendleton , J. D. and Videen , G. 2000 . Response Characteristics of the Particle Measuring Systems Active Scattering Aerosol Spectrometer Probes . Aerosol Sci. Technol. , 33 : 334 – 352 .
- Press , W. H. , Flannery , B. P. , Teukolsky , S. A. and Vetterling , W. T. 1992 . Numerical Recipes in FORTRAN 77, , 2nd ed. , New York : Cambridge University Press .
- Riemer , N. , Vogel , H. and Vogel , B. 2004 . Soot Aging Time Scales in Polluted Regions during Day and Night . Atmos. Chem. Phys. , 4 : 1885 – 1893 .
- Schnaiter , M. , Linke , C. , Möhler , O. , Naumann , K.-H. , Saathoff , H. , Wagner , R. , Schurath , U. and Wehner , B. 2005 . Absorption Amplification of Black Carbon Internally Mixed with Secondary Organic Aerosol . J. Geophys. Res. , 110 (D19204)
- Schulz , C. , Kock , B. F. , Hofmann , M. , Michelsen , H. , Will , S. , Bougie , B. , Suntz , R. and Smallwood , G. 2006 . Laser-Induced Incandescence: Recent Trends and Current Questions . Appl. Phys. B , 83 : 333 – 354 .
- Schwarz , J. P. , Gao , R. S. , Fahey , D. W. , Thomson , D. S. , Watts , L. A. , Wilson , J. C. , Reeves , J. M. , Baumgerdner , D. G. , Kok , G. L. , Chung , S. H. , Schluz , M. , Hendricks , J. , Lauer , A. , Kärcher , B. , Slowik , J. G. , Rosenlof , K. H. , Thompson , T. L. , Langford , A. O. , Lowenstein , M. and Aikin , K. C. 2006 . Single-Particle Measurement of Mid Latitude Black Carbon and Light-Scattering Aerosols from the Boundary Layer to the Lower Stratosphere . J. Geophys. Res. , 111 D16207 doi:10.1029/2006JD007076
- Seinfeld , J. H. and Pandis , S. N. 1998 . Atmospheric Chemistry and Physics: From Air Pollution to Climate Change , New York : John Wiley .
- Sherman , F. S. 1963 . “ A Survey of Experimental Results and Methods for the Transition Regime of Rarefied Gas Dynamics ” . In Rarefied Gas Dynamics , Edited by: Lauermann , J. A. Volume II , 228 – 260 . New York : Academic Press .
- Slowik , J. G. , Cross , E. , Han , J. , Davidovits , P. , Onasch , T. B. , Jayne , J. T. , Williams , L. R. , Canagaratna , M. R. , Worsnop , D. R. , Chakrabarty , R. K. , Arnott , W. P. , Schwarz , J. P. , Gao , R. S. , Fahey , D. W. and Kok , G. L. 2006 . Intercomparison of Instruments Measuring Black Carbon Content and Optical Properties of Soot Particles . Aerosol. Sci. Technol. , submitted
- Snelling , D. R. , Liu , F. , Smallwood , G. J. and Güider , Ö. L. Evaluation of the Nanoscale Heat and Mass Transfer Model of LII: Prediction of the Excitation Intensity . 34th Natl. Heat Transfer Conf. pp. 1 – 9 . NHTC2000-12132
- Stephens , M. , Turner , N. and Sandberg , J. 2003 . Particle Identification by Laser-Induced Incandescence in a Solid-State Laser Cavity . Appl. Opt. , 42 : 3726 – 3736 .
- Streets , D. G. , Bond , T. C. , Carmichael , G. R. , Fernandes , S. D. , Fu , Q. , He , D. , Klimont , Z. , Nelson , S. M. , Tsai , N. Y. , Wang , M. Q. , Woo , J.-H. and Yarber , K. F. 2003 . An Inventory of Gaseous and Primary Aerosol Emissions in Asia in the Year 2000 . J. Geophys. Res. , 108 ( D21 ) : 8809
- Stull , D. R. 1947 . Vapor Pressure of Pure Substances Organic Compounds . Ind. Eng. Chem. , 39 : 517 – 540 .
- 1993 . Handbook of Chemistry, , Basic 4th ed. , Tokyo , , Japan : Maruzen . The Chemical Society of Japan
- Ueno , I. and Shoji , M. 2001 . Thermal-Fluid Phenomena Induced by Nanosecond-Pulse Heating of Materials in Water . J. Heat Transfer , 123 : 1123 – 1132 .
- Wainner , R. T. 1999 . An Analytical and Quantitative Analysis of the Laser-Induced Incandescence of Soot , Ph.D. thesis in Aerospace Engineering Georgia Institute of Technology .
- Weast , R. C. , ed. 1988 . CRC Handbook of Chemistry and Physics, , 68th ed. , Cleveland , OH, USA : Chemical Rubber Company .