Abstract
Scanning electrical mobility spectrometers (SEMS) are commonly used for near real-time ultrafine particle size distribution measurements. Analysis of SEMS measurements to calculate particle size distributions requires detailed understanding of instrument characteristics and operation. Varying instrument designs are used in the different commercial SEMS systems, and data analysis with these instruments requires accurate knowledge of their relative performance. In this study, an experimental approach to evaluate and reconcile differences between different SEMS instruments is established. This approach is used to characterize the relative performance of two SEMS systems—TSI's SMPS 3936-L22 and MSP's WPS XP1000—for particle sizes in the range of 20 to 300 nm. In these tests, the instruments were operated under a low flowrate condition with aerosol and sheath air flows of 0.3 and 3 LPM, respectively. Measurements show that the particle sizing characteristics of the instruments are very consistent with each other over the entire range of particle sizes studied. Particle number characteristics are dependent on the treatment of particle losses in the system and accounting of non-idealities of transfer function. The number concentrations reported by two instruments are generally consistent with each other and with an upstream reference counter for particle sizes larger than ∼ 90 nm. For smaller particles, the low flowrate operation of the two systems results in significant penetration losses. A net particle detection efficiency (NPDE) factor for the two systems was determined from experiments with monodisperse aerosol. This factor is seen to be effective in characterizing and reconciling measurements made with these two SEMS instruments.
INTRODUCTION
The Differential Mobility Analyzer (DMA) was developed as an electrical technique for particle characterization by Knutson and Whitby (Citation1975a,Citationb) and has been a fundamental tool to extract or classify a narrow range of particle sizes from a polydisperse particle size distribution. The DMA operates by classifying particles based on their electrical mobility. Traditional DMA designs have two concentric cylinders maintained at an electric potential difference. Charged particles are introduced near the outer cylinder and drawn towards the central rod by the applied electric field. Flow between the concentric cylinders acts to move the particles in the axial direction while the balance of the electric and drag forces determines the radial particle velocity. For a given set of DMA operating conditions, particles of a narrow range of electrical mobilities will exit the sampling port in the inner cylinder near the base of the instrument. With the introduction of a continuous flow condensation particle counter (CPC; CitationAgarwal and Sem 1980) and automated computer control (CitationFissan et al. 1983; CitationTenBrink et al. 1983), the DMA became a standard for sizing aerosol particles in the range of 3 nm to 1 μ m (e.g., CitationWoo et al. 2001; CitationJeong et al. 2004).
In the initial application of DMA for particle sizing, the central rod voltage was sequentially stepped to output different sizes and the resultant particle concentrations were measured by a CPC. This measurement technique was called the differential mobility particle sizer (DMPS) and required significant time at each voltage setting to achieve steady-state conditions, making this approach very time consuming. For faster particle size distribution measurements, CitationWang and Flagan (1990) introduced a scanning technique, called the scanning electrical mobility sizer (SEMS), where the central rod voltage is exponentially ramped resulting in a continuous change in extracted particle size. With exponential ramping, classified particles traverse the same paths in the DMA and hence avoid sampling biases because of the velocity profile in the DMA. Again, a downstream particle counter is used to count the number of exiting particles. The scanning technique reduces the time for size distribution measurement from ∼ 30 minutes to ∼ 5 minutes or less.
The quality of SEMS measurements is dependent on the accuracy of its components: the DMA and the CPC. The performance of a DMA is characterized by its transfer function that determines the fraction of particles of different electrical mobilities exiting the DMA for a selected mean electrical mobility diameter (CitationKnutson and Whitby 1975a). The DMA transfer function characteristics are dependent on the its geometry, operating conditions, manufacturing non-idealities, and the diffusion coefficients of the classified particles (CitationStolzenburg 1988; CitationFissan et al.1996; CitationChen et al. 1998; CitationFlagan 1999). For accurate SEMS measurements, the DMA transfer function must be well characterized.
SEMS measurements are also affected by the time response and efficiency of the counter downstream of the DMA. Typically, SEMS instruments use a single particle counter, such as a CPC. The CPC counts all particles above a critical size and has a size-dependent efficiency in the vicinity of the critical size. The size-dependent counting efficiency of the CPC and its response rate influences the lower measurement size limit of the SEMS system and its maximum scan rate (CitationRussell et al. 1995; CitationCollins et al. 2002).
The accuracy of particle size distributions obtained from SEMS measurements depends on the accuracy of inversion of the DMA-CPC measurements, accounting for DMA transfer function, particle charging characteristics, CPC time constant, and counting efficiency, and in minimizing/accounting for the plumbing losses and transport delays in the system.
Commercial SEMS systems are now widely deployed for a range of field and laboratory experiments, such as to: characterize ambient ultrafine particle distributions; study atmospheric aerosol transformations; and understand new particle formation processes (e.g., CitationTuch et al. 1997; CitationLaakso et al. 2003; CitationStanier et al. 2004). Commercial systems are often deployed in parallel measurements at different locations. Integration or reconciliation of their data requires prior knowledge of possible differences between these instruments. In particular, commercial SEMS systems have differing designs of DMAs and CPCs, and any effect that these differences may have on the reported size distributions must be understood for their effective deployment in parallel studies.
In this paper, an experimental approach to determine relative performance of SEMS instruments is introduced. This experimental approach will be used to characterize the relative performance of two commercial SEMS systems: the SMPS 3936-L22 (TSI Inc, MN) and the WPS XP1000 (MSP Inc, MN). The TSI SMPS and MSP WPS systems have identical operating principles with a cylindrical DMA for mobility classification and a CPC for counting the classified particles. The WPS also has a laser particle spectrometer for large particle (∼ 0.3 to 10 μ m) size distribution measurements, but that instrument was not used in this study. The systems are both user-friendly, self-contained systems with some differences in setup and options available.
The TSI 3936 SMPS requires the user to select scan parameters via software on an external computer and this automates the hardware control, data collection, and inversion and reports the number size distributions of the sampled aerosol. The 3936 series can be configured with one of two central columns: the 3081 long column DMA for size distribution measurements in the range of 10 nm −1 μ m range, or the 3085 short column for measurements in the 2–150 nm range. In the present study, the 3081 long column is used. The SMPS 3936 has a TSI 3080 electrostatic classifier platform that includes a Kr85 charger, a large particle impactor, a HV supply, and a DMA flow control unit. The Aerosol Instrument Manager (AIM) v5.5 software on a user-supplied PC is used to operate the system. The TSI 3936 SMPS interface also provides user control over the lower and upper sizes to be scanned, the total scan time, and the number of scans. The system always samples at predetermined channel resolution (64 channels per size decade). The aerosol flows (monodisperse and polydisperse) are determined by the CPC while the sheath flow can be selected by the user.
The WPS is a stand-alone, self-contained system with a built-in computer for system operation and control. In the WPS, the following parameters can be selected: the scan range, scan time, number of channels per scan, number of scans, and wait time between scans. The WPS typically operates at a sample flowrate of 0.3 LPM with a sheath flow of 3 LPM. All of the scan functions are fully automated and the data is collected by the on-board computer. For post-processing, the data can be downloaded to a different computer and analyzed with the WPS software (WPS Commander software Version 2.1, MSP Inc.) to apply the multiple-charge correction and obtain normal and log-normal fit parameters for the collected data.
In this study, a simple experimental approach is introduced to characterize the relative performance of the two SEMS systems. Relative measurements made by the two instruments are compared and their differences are reconciled with a newly introduced net system efficiency factor. This approach permits accurate reconciliation of data obtained from different SEMS instruments in integrated or collaborative studies.
EXPERIMENTS AND RESULTS
The experimental methodology for SEMS testing had three steps. (1) Comparison of the CPC characteristics; (2) Comparison of sizing accuracy of the SEMS instruments; and (3) Determining size-dependent particle penetration efficiencies of the two systems.
Experiments to characterize and compare the performance of SEMS systems require generation of particles of known size and relatively stable number concentrations. Two techniques were used to generate the test particles: a nebulizer with 0.1% dioctyl sebacate (DOS) in isopropanol; and a spark discharge aerosol generator (Palas GFG 1000, Karlsruhe, Germany). Particles from the nebulizer were typically larger than 50 nm, while carbon particles produced by the spark discharge generator were smaller than ∼90 nm (CitationRoth et al. 2004; CitationMesserer et al. 2003; CitationEvans et al. 2003). For particles larger than ∼ 10 nm, the CPC counting efficiencies are largely independent of particle composition and shape (CitationHeim et al. 2004). This permits the use of carbon particles from the spark generator for instrument performance measurements in the nanoparticle size range. For most experiments, the particles were size-classified upstream of the test systems using a DMA (TSI 3071). This DMA was tested for sizing accuracy using NIST-certified 100.2 and 269 nm PSL particles and NIST-traceable 240 nm PSL particles (Duke Scientific, CA), although the exact performance of this system should not matter for relative performance evaluation of the two SEMS systems. The monodisperse particles from the DMA were sent to the downstream instruments through a three-way splitter (Swagelok 1/4″ union cross). Filtered air is used as make-up flow to obtain the desired total flowrate for the test instruments. For accurate comparison of instruments it is critical that the test particle concentrations are uniform and consistent over the experimental duration.
Initial tests were conducted to determine the accuracy of the three-way splitter operation. For this test, the three CPCs used in the subsequent comparison measurements (TSI 3010, TSI 3022A, and WPS CPC) were connected to three ports of the flow splitter. The flows from the splitter were, therefore, at the same ratio as that used for the subsequent SEMS comparison experiments. Initial tests showed that the particle concentrations from the different splitter sampling ports were not identical; suggesting poor mixing of the generated particles with the make-up air. To overcome this nonuniformity, a mixing tube was placed in the flow upstream of the splitter. The mixing tube consisted of a twisted wire placed in a 1/4″ stainless steel tube to introduce turbulence and promote mixing. To test uniformity of particle concentrations from the splitter, measurements were made with the three CPCs connected to the different ports in all six location combinations (). The ratio of CPC concentrations recorded at different flow-splitter locations are largely invariant (), thus confirming that the test aerosol is well-mixed prior to reaching the splitter ports. The measurements were repeated at different particle concentrations to ensure that the mixing state was consistent.
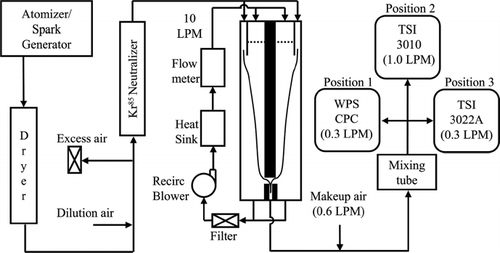
FIG. 1 Schematic diagram of the experimental setup to determine the relative performances of the CPCs.
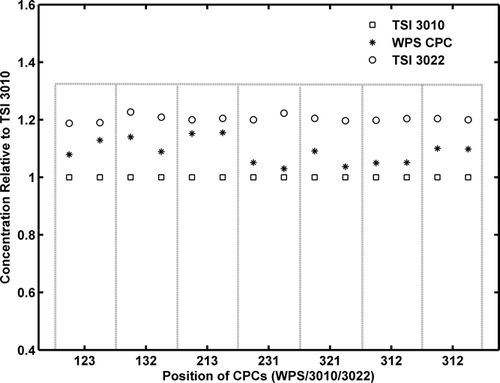
FIG. 2 Relative concentration readings of the CPCs at various positions on the flow-splitter. Two readings were recorded for each configuration.
CPC Performance Comparisons
The counting efficiency and response rate of CPCs can directly affect the size distributions reported by the SEMS systems. The WPS CPC has been newly introduced and its performance characteristics have not been independently established. The size-dependent counting efficiency of the WPS CPC was determined in comparison to the TSI 3022A CPC used in the TSI SMPS system and the TSI 3010 CPC used as a reference counter for subsequent SEMS comparison measurements. The time response characteristics of the WPS CPC was experimentally determined and compared to that of TSI 3010 CPC.
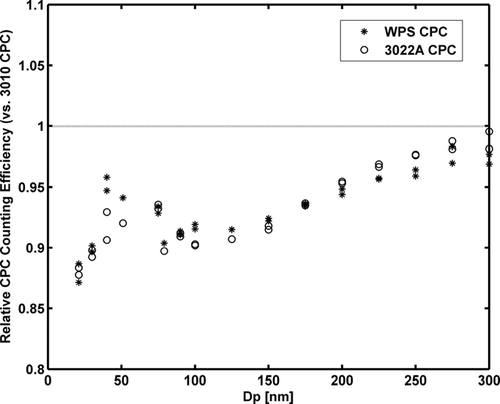
As there are no standard techniques to generate a known concentration of particles, a relative counting efficiency experiment was performed to enable reconciliation of differences in the SEMS measurements because of different CPC sensitivities. The particle counting efficiencies of WPS CPC and the reference CPC (TSI 3010) were obtained in comparison to the measurements of the CPC in the TSI 3936-L22 SMPS (TSI 3022A) using the experimental setup shown in . The number concentrations of monodisperse particles were measured by the individual CPCs for simultaneous 30 second intervals. The number concentrations of the test aerosol ranged from 500–7000 cm− 3. The relative efficiencies of the CPCs are then obtained for a range of particle sizes (). The detection efficiencies of the WPS CPC and the SMPS CPC (TSI 3022A) are within ∼ 3% of each other. Both these CPCs have a counting efficiency that is slightly different from that of the TSI 3010 CPC, with the difference increasing with decreasing particle size. The particle sizes set by the upstream DMA were varied randomly to avoid any possible systematic errors. To account for the relative differences between the CPC counting efficiencies, the ratio of the TSI 3010 CPC to the WPS CPC was used to normalize the WPS measurement, while the ratio of the TSI 3010 CPC to the SMPS CPC (TSI 3022A) was used to normalize the SMPS measurements.
FIG. 3 CPC concentration readings normalized to the TSI 3010 CPC. Two readings are shown for each diameter.
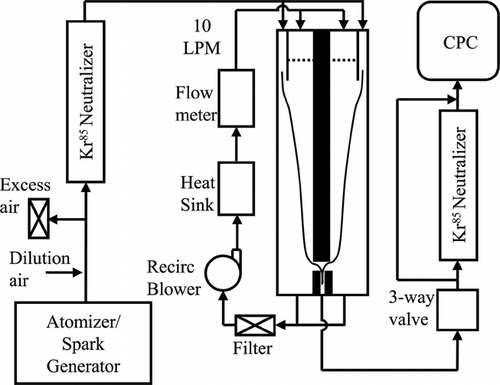
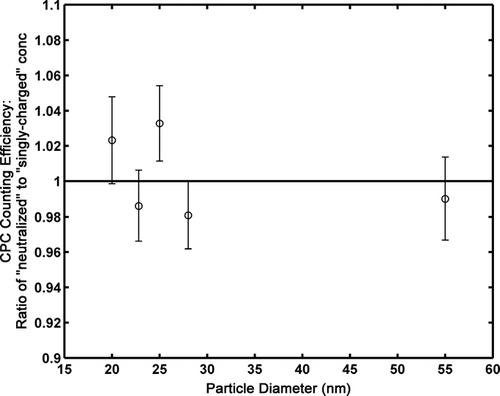
Recently it was reported that the CPC counting efficiencies were dependent on the charge state of the particles (CitationLiu and Deshler 2003). In that study, the CPC counting efficiency of monodisperse particles from the DMA were seen to be higher if a neutralizer is used upstream of the CPC. To determine if this effect is important for our study, the counting efficiency of the TSI 3010 CPC, used as a reference CPC for our measurements, was obtained as a function of particle charge state using the experimental setup shown in . Monodisperse aerosol particles were generated with the combination of the Palas Carbon generator and a DMA and sent to the TSI 3010 CPC. A 3-way valve is used to switch the CPC input flow between “neutralized” and “singly-charged” particles. A TSI 3077 Kr85 neutralizer (10/2000) is used in this study.
FIG. 4 Schematic diagram of the experimental setup to determine the relative TSI 3010 CPC counting efficiency dependence on the charge state of the test aerosol.
The valve was switched at a frequency of 1 minute and particle concentrations were recorded by TSI's AIM software at 1-second intervals. At least 10 data sets were obtained for a chosen particle diameter and the data was recorded for 5 particle diameters ranging from 20 to 55 nm. Particle concentrations over the 1-minute interval were averaged and sequential data sets of “neutralized” and “singly-charged” particle concentrations were used to calculate CPC counting efficiency dependence on particle charge state. The mean value of CPC counting efficiency was obtained considering all data sets for one particle diameter. The CPC counting efficiency as a function of particle diameter is plotted in , with the error bars showing one standard deviation of the data set. The counting efficiencies for both CPCs are close to unity with small standard deviations possibly because of fluctuations in particle number concentration during the analysis period. These results indicated that the performance of the reference TSI 3010 CPC was largely independent of the particle charge state under our experimental conditions. Thus, in subsequent experiments, the TSI 3010 CPC was used for upstream reference measurements without a neutralizer in place.
FIG. 5 The ratio of “neutralized” to “singly-charged” particle concentrations as a function of particle diameter for TSI 3010 CPC.
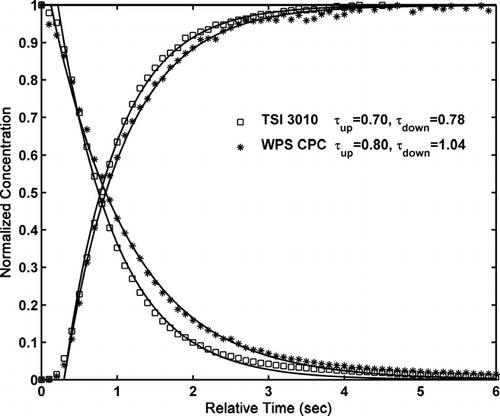
CPC Time Response
Time response of a CPC must be characterized for effective inversion of SEMS data and to determine the fastest scan rate possible with the SEMS instruments (CitationCollins et al. 2002). The response of the two CPCs, TSI 3010, and the WPS CPC, to a step change in particle concentration was studied. The CPC response, C(t), over time (t) was modeled as an exponential decay for input concentration stepping down from an initial concentration C0 to 0 as shown in Equation (Equation1) (CitationRussell et al. 1995).
FIG. 6 Schematic diagram of the experimental setup to determine the time response of TSI 3010 and WPS CPCs.
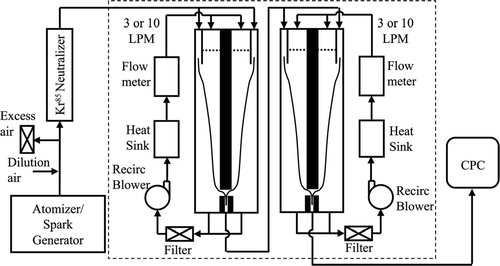
FIG. 7 The response of TSI 3010 and WPS CPCs to a step change in concentration. The solid lines are best fit curves for trends based on Equations (1) and (2) for response in the range of 5–95%. The time t = 0 is arbitrarily chosen.
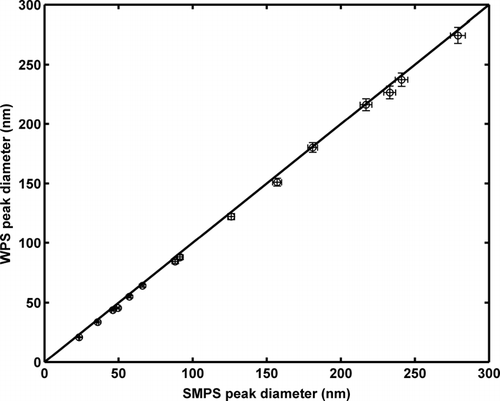
Comparison of Mean Particle Diameters
The performance of the central column of the SMPS 3936-L22 (TSI Inc, MN) and the WPS XP1000 were compared to determine the sizing accuracy of the two SEMS instruments. An experimental setup similar to that shown in was used for this study, with the SEMS instruments replacing the CPCs downstream of the splitter. Particles from the upstream source DMA, operated with a sheath air of 10 LPM and aerosol flow of 1 LPM, were sent to the two SEMS instruments. The peak sizes obtained from the scans of the two instruments were compared.
The comparison results are shown in . The errors bars in the plot represent the width of a measurement channel for the instruments. The mean particle sizes reported by the two SEMS units were in good agreement with each other over the entire range of sizes tested. Any discrepancies between the systems are within one measurement channel width.
FIG. 8 Comparison of peak sizes measured by the TSI SMPS 3936 L22 and WPS XP 1000 systems.
Quantifying System Penetration
In addition to CPC and central column characteristics, the final distributions reported by the SEMS instruments are also affected by particle transport losses in the systems, non-ideal size distribution broadening unaccounted for by the inversion routines, internal losses because of electric field non-uniformities, and so on. Here, a single parameter, called the net particle detection efficiency (NPDE), was defined to account for all non-idealities in the SEMS instruments. NPDE was defined as the ratio of integrated particle concentration obtained from a SEMS scan to the total upstream concentration measured by a reference CPC. The NPDE factor captures the performance of the integrated SEMS instrument and depends on the characteristics of the individual components in the SEMS system, the instrument operating conditions, and the data analysis procedure. This parameter is similar in concept to the particle loss function of CitationReineking and Porstendörfer (1986) for a TSI 3071 DMA column. CitationReineking and Porstendörfer (1986), however, defined the loss function to only account for losses through the central column and the charger. CitationReineking and Porstendörfer (1986) analyzed the loss function using a TDMA setup without a radiation source in the neutralizer upstream of the second DMA. The raw concentration reported by the second DMA at the peak size was then compared to the total concentration measured at the entrance to the second DMA. For a flat size distribution upstream of the first DMA and for ideal transfer functions for both DMAs (i.e., a transfer function height of 1.0 and a halfwidth of 0.1), the number concentration downstream of the second DMA at the same selected size for both DMAs will be 2/3 of the concentration entering the second DMA. While this experiment would have been relatively simple to recreate, the determined loss function would not have accounted for possible errors in the calculation of the particle size distribution because of the non-idealities in the SEMS data inversion.
The experimental setup shown in was used to determine NPDE for the two systems. An upstream source DMA was stepped to output particles of different mobility diameters and the WPS and SMPS systems were run in a scan mode over the entire size range (typically 10 to 500 nm). The SMPS and WPS scans were run with parameters that result in nearly identical channel sizes (TSI SMPS—64 channels per decade; WPS SMS—96 channels for 10–500 nm size range), scan times, and flow rates (aerosol flow 0.3 LPM, sheath flow 3 LPM). The test parameters and instrument details are listed in . Based on the CPC response times of ∼ 1 and 1.85 seconds for the WPS CPC and TSI 3022A CPC (CitationQuant et al. 1992), respectively, the scan times required for accurate size distribution measurements with the SEMS instruments can be determined using the analysis of CitationCollins et al. (2002). For 96 measurement channels over a particle size range of 10–500 nm, a scan time of 288 seconds is seen to be appropriate. For this scan time, concentration measurements for particles larger than 20 nm in diameter, have an error less than 2% because of smearing associated with a CPC of time constant of 1.85 seconds or less. Upstream of the test SEMS systems, the particle concentrations were monitored by the reference CPC (TSI 3010) and the measurements were recorded in a computer using a data acquisition system. The SMPS and WPS instruments were operated with their standard neutralizers (Kr85 and Po210, respectively) in place. For all tests, the upper size limit of the scans was extended to match the cut size of the impactor in the systems. This setting ensures that the multiple charge correction in the calculation of particle size distributions can be accurately included.
FIG. 9 Schematic diagram of the experimental setup used to characterize the particle penetration efficiency through the SEMS systems as a function of particle size.
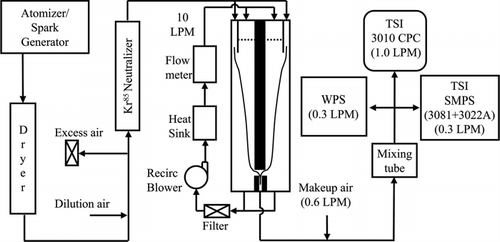
TABLE 1 Details of the instruments and the test conditions used in the SEMS comparison experiments
The SEMS systems calculated the final reported concentration values (dN/dDp) from the channel CPC concentration measurements (RCPC) using Equations (3) and (4) (Wang and Flagan Citation1990), as
The NPDE of the SEMS instruments were then calculated as the ratio of the SEMS integrated concentration to the total upstream concentration:
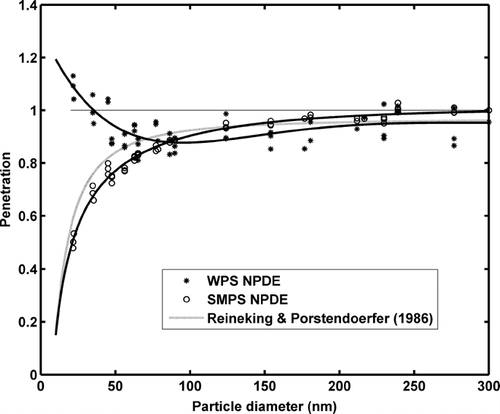
The NPDE values (Equation Equation6) were determined as a function of particle size for the two systems (). For Dp > 90 nm, the NPDE values of WPS and SMPS are ∼ 0.9–1. For smaller particle sizes, the TSI SMPS is seen to have lower penetration than expected. The trend for the measured SMPS NPDEs was largely consistent with DMA penetration efficiencies obtained by CitationReineking and Porstendörfer (1986). This suggests that there were significant diffusional losses in the DMA column because of the low flowrate operation of the SMPS system. Similarly with the WPS, significant penetration losses are expected in the DMA column for smaller particle sizes. The WPS software, however, attempts to correct for the losses in the data analysis software with a size-dependent penetration factor (WPS manual, MSP Inc.). For smaller particle sizes, it was observed that the integrated WPS reported concentrations were greater than the reference CPC concentrations, resulting in NPDE values greater than 1. This suggests that the WPS DMA penetration factor overcorrects for penetration losses at the smallest sizes. The WPS penetration factor can be software adjusted, but for this study, the factory defaults were used. Any changes to these parameters must be reported by the researchers for reproducibility. Thus, it is critical that the particle penetration characteristics in either instrument be accurately accounted for in the data analysis, especially for nanoparticle measurements and under low flowrate operation.
FIG. 10 Net particle detection efficiencies (NPDEs) of the two SEMS systems as a function of particle diameter. The solid lines are best fits. Two readings are shown at each particle diameter.
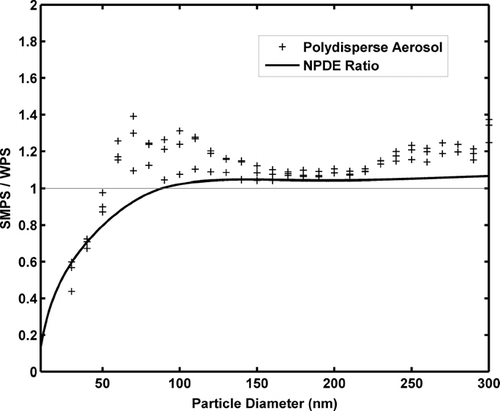
To compare the relative performance of the two SEMS systems after accounting for the calculated NPDEs, size distribution measurements of polydisperse aerosol obtained by nebulizing 0.1% dioctyl sebacate (DOS) in isopropanol were made with the two instruments. The DOS particles are ideal for comparison tests as they are spherical in shape and do not bounce from the cut-off impactor. Also, easy volatilization of the carrier solution (isoproponal) prior to classification, ensures that the particle sizes are unchanged inside the DMA. Effective solvent volatilization also minimizes the presence of residual particles in the size distribution. The scan parameters for the two systems were again chosen to be identical to each other (64 channels per decade, total scan time of 288 s). The average size distributions from three measurements of the nebulized solution show that the generated aerosol has a mean size ∼ 170 nm, with a small concentration of particles with diameters < 50 nm.
A direct comparison of the ratio of concentrations reported by the two SEMS systems as a function of particle size for the polydisperse DOS aerosol is complicated by small shifts in the reported size distributions. In size ranges where the aerosol distribution has a large gradient, a shift of one particle size bin in the reported values can result in a large concentration ratio. Here, the peak of DOS size distributions reported by the two SEMS systems were matched prior to calculating their concentration ratios (). As predicted by the TDMA experiments, the reported concentrations differed with decreasing size because of diffusional losses in the DMA column under the low flow rate operation. The ratio of measured SMPS and WPS NPDEs are seen to be largely in agreement with the ratio of polydisperse aerosol concentration measurements by the two systems. Some differences are observed in intermediate sizes because of possible small shifts in size bins and low particle concentration in the ultrafine size range. In general, pre-determined NPDE factors can be used to account for diffusional losses and other non-idealities in SEMS measurements, and help reconcile data from different instruments.
FIG. 11 Ratio of WPS and SMPS concentrations (+) obtained from experiments with DOS polydisperse aerosol as a function of particle size. The concentration ratio is consistent with the ratio of measured WPS and SMPS NPDEs (solid line).
CONCLUSIONS
An experimental approach to characterize and compare the performance of different SEMS instruments was established. This approach is used to determine the relative performances of two commercial SEMS instruments—the MSP WPS and TSI SMPS. The performance of the new WPS CPC was determined for a particle size range of 20–300 nm. The WPS CPC has a time constant of 0.80–1.04 seconds. The WPS and TSI SMPS 3936 are consistent in their reporting of particle sizes. A new performance factor, NPDE, is defined to determine the accuracy of concentrations measured by the SEMS instruments. This factor is based on the final reported concentrations and hence accounts for all non-idealities in a SEMS system. For the TSI SMPS, particle transport losses because of the low flowrate mode operation, resulted in under-reporting of concentrations in the nanoparticle size range. The measured NPDE for the SMPS system compare reasonably with the penetration efficiency determined by CitationReineking and Porstendörfer (1986). In the WPS, a correction factor was used to account for the penetration losses. This study suggests that the final WPS reported concentrations are slightly higher than expected and discrepancy increases at the smallest sizes. Differences in measurements of polydisperse aerosol particle size distributions with different SEMS systems are seen to be largely reconciled using their relative NPDE values obtained with experiments using monodisperse aerosol. Relative NPDE values can, thus, potentially be used to reconcile measurements made with multiple SEMS systems containing different CPCs or DMA columns, and operated at different flowrates or scan times.
Acknowledgments
The authors thank Paul Leslie of TSI Inc. for arranging a long-term loan of the TSI 3936 SMPS system and Keung-Shan Woo of MSP Inc for discussions and help with the WPS system and its data analysis. We also thank Richard Flagan and the reviewers for their helpful comments. The equipment used in this project was provided as part of the NYSTAR Center for Environmental Quality Systems under NYSTAR Contract No. C000068.
REFERENCES
- Agarwal , J. K. and Sem , G. J. 1980 . Continuous Flow, Single-Particle-Counting Condensation Nucleus Counter . J. Aerosol Sci. , 11 : 343 – 357 .
- Chen , D. R. , Pui , D. Y. H. , Hummes , D. , Fissan , H. , Quant , F. R. and Sem , G. J. 1998 . Design and Evaluation of a Nanometer Aerosol Differential Mobility Analyzer (Nano-DMA) . J. Aerosol Sci. , 29 : 497 – 509 .
- Collins , D. R. , Flagan , R. C. and Seinfeld , J. H. 2002 . Improved Inversion of Scanning DMA Data . Aerosol Sci. Technol. , 36 : 1 – 9 .
- Evans , D. G. , Harrison , R. M. and Ayres , J. G. 2003 . The Generation and Characterisation of Elemental Carbon Aerosols for Human Challenge Studies . J. Aerosol Sci. , 34 : 1023 – 1041 .
- Flagan , R. C. 1999 . On Differential Mobility Analyzer Resolution . Aerosol Sci. Technol. , 30 : 556 – 570 .
- Fissan , H. J. , Helsper , C. and Thielen , H. J. 1983 . Determination of Particle Size Distribution by Means of an Electrostatic Classifier . J. Aerosol Sci. , 14 : S354 – 357 .
- Fissan , H. , Hummes , D. , Stratmann , F. , Buscher , P. , Neumann , S. , Pui , D. Y. H. and Chen , D. 1996 . Experimental Comparison of Four Differential Mobility Analyzers for Nanometer Aerosol Measurements . Aerosol Sci. Technol. , 24 : 1 – 13 .
- Heim , M. , Kasper , G. , Reischl , G. P. and Gerhart , C. 2004 . Performance of a New Commercial Electrical Mobility Spectrometer . Aerosol Sci. Technol. , 38 ( S2 ) : 3 – 14 .
- Jeong , C. H. , Hopke , P. K. , Chalupa , D. and Utell , M. 2004 . Characteristics of Nucleation and Growth Events of Ultrafine Particles Measured in Rochester, NY . Environ. Sci. Technol. , 38 : 1933 – 1940 .
- Knutson , E. O. and Whitby , K. T. 1975a . Aerosol Classification by Electric Mobility: Apparatus, Theory, and Applications . J. Aerosol Sci. , 6 : 443 – 451 .
- Knutson , E. O. and Whitby , K. T. 1975b . Accurate Measurement of Aerosol Electric Mobility Moments . J. Aerosol Sci. , 6 : 453 – 460 .
- Laakso , L. , Hussein , T. , Aarnio , P. , Komppula , M. , Hiltunen , V. , Viisanen , Y. and Kulmala , M. 2003 . Diurnal and Annual Characteristics of Particle Mass and Number Concentrations in Urban, Rural and Arctic Environments in Finland . Atmos. Environ. , 37 : 2629 – 2641 .
- Liu , P. S. K. and Deshler , T. 2003 . Causes of Concentration Differences Between a Scanning Mobility Particle Sizer and a Condensation Particle Counter . Aerosol Sci. Technol. , 37 : 916 – 923 .
- Messerer , A. , Niessner , R. and Pöschl , U. 2003 . Thermophoretic Deposition of Soot Aerosol Particles Under Experimental Conditions Relevant for Modern Diesel Engine Exhaust Gas Systems . J. Aerosol Sci. , 34 : 1009 – 1021 .
- Quant , F. R. , Caldow , R. , Sem , G. J. and Addison , T. J. 1992 . Performance of Condensation Particle Counters with Three Continuous Flow Designs . J. Aerosol Sci. , 23 : S405 – S408 .
- Reineking , A. and Porstendörfer , J. 1986 . Measurements of Particle Loss Functions in a Differential Mobility Analyzer (TSI, Model 3071) for Different Flow Rates . Aerosol Sci. Technol. , 5 : 483 – 486 .
- Roth , C. , Ferron , G. A. , Karg , E. , Lentner , B. , Schumann , G. , Takenaka , S. and Heyder , J. 2004 . Generation of Ultrafine Particles by Spark Discharging . Aerosol Sci. Technol. , 38 : 228 – 235 .
- Russell , L. M. , Flagan , R. C. and Seinfeld , J. H. 1995 . Asymmetric Instrument Response Resulting from Mixing Effects in Accelerated DMA-CPC Measurements . Aerosol Sci. Technol. , 23 : 491 – 509 .
- Stanier , C. O. , Khlystov , A. Y. and Pandis , S. N. 2004 . Ambient Aerosol Size Distributions and Number Concentrations Measured during the Pittsburgh Air Quality Study (PAQS) . Atmos. Environ. , 38 : 3275 – 3284 .
- Stolzenburg , M. 1988 . An Ultrafine Aerosol Size Distribution Measuring System , Minneapolis : University of Minnesota . Ph.D. thesis
- TenBrick , H. M. , Plomp , A. , Spoelstra , H. and van de Vate , J. F. 1983 . A High Resolution Electrical Mobility Aerosol Spectrometer (MAS) . J. Aerosol Sci. , 14 : 589 – 597 .
- Tuch , T. , Brand , P. , Wichmann , H. E. and Hetder , J. 1997 . Variation of Particle Number and Mass Concentration in Various Size Ranges of Ambient Aerosols in Eastern Germany . Atmos. Environ. , 31 : 4193 – 4197 .
- Woo , K. S. , Chen , D. R. , Pui , D. Y. H. and McMurry , P. H. 2001 . Measurement of Atlanta Aerosol Size Distributions: Observations of Ultrafine Particle Events . Aerosol Sci. Technol. , 34 : 75 – 87 .
- Wang , S. C. and Flagan , R. C. 1990 . Scanning Electrical Mobility Spectrometer . Aerosol Sci. Technol. , 13 : 230 – 240 .