Abstract
The Feldberg Aerosol Characterization Experiment (FACE-2004) took place from July 13–August 4, 2004 at the Taunus Observatory on the “Kleiner Feldberg” (825 m a.m.s.l.) in Central Germany. The experiment included (amongst others) size-resolved chemical characterization of non-refractory aerosol components. One of the experiment's objectives was to better understand and to characterize recently developed aerosol measurement instrumentation by intercomparison with other co-located instruments. One of these instruments was the Aerodyne Time-of-Flight Aerosol Mass Spectrometer (ToF-AMS).
Here we compare the datasets obtained by the ToF-AMS with those obtained by the well-characterized co-located Quadrupole Aerosol Mass Spectrometer (Q-AMS). A good agreement between the recently developed ToF-AMS with the established Q-AMS is reported here for all species measured with the two instruments for a time period where both instruments operated under well-calibrated conditions. During measurements with reduced detector gain after a pump failure changed species concentrations were measured with the ToF-AMS that did not agree with those measured with the Q-AMS. These changes were different for the individual species and could be attributed to the influence of the ion detection threshold as was shown by model calculations.
For efficient and user-friendly processing of ToF-AMS raw data a data processing software package was developed. Since this is the first time this software was used for field data, it is described in some detail here.
INTRODUCTION
Our knowledge about the nature, sources, processes, and effects of aerosol particles is still incomplete. More detailed information about ambient aerosol concentration, chemical composition, and species-resolved size distributions is needed in order to understand their impact on atmospheric processes (for example, climate forcing and cloud formation), and on human health (e.g., CitationLohmann and Feichter 2005; CitationWichmann et al. 2000). One way to obtain this information is to measure and characterize the ambient aerosol. The technology to count, size, and determine the mass concentration of particles in real-time with high accuracy is well developed, but the chemical analysis of aerosol components is not as easily realized. In recent years, the Aerodyne Aerosol Mass Spectrometer (AMS) has been developed and characterized, which has the potential for quantitative measurements of chemical aerosol composition as well as chemically resolved size distributions by separated evaporation and ionization with subsequent mass spectrometric analysis of the molecular ions. The Q-AMS (Quadrupole Aerosol Mass Spectrometer) (e.g., CitationJayne et al. 2000; CitationJimenez et al. 2003; CitationAllan et al. 2003a; CitationAllan et al. 2003b) uses a quadrupole mass spectrometer as analyzer and is therefore not capable of obtaining complete mass spectra of individual particles. In order to further improve sensitivity and time resolution of the Aerosol Mass Spectrometer and to extend its capabilities to determine single particle information, the Time-of-Flight Aerosol Mass Spectrometer (ToF-AMS, CitationDrewnick et al. 2005; CitationDeCarlo et al. 2006) was developed recently. This instrument combines the well-characterized AMS particle collection, sizing and evaporation/ionization technology with state-of-the-art time-of-flight mass spectrometry. Until now, only qualitative, but not satisfactory quantitative agreements of the two instruments were reported (CitationDrewnick et al. 2005).
The Feldberg Aerosol Characterization Experiment 2004 (FACE-2004) took place on the “Kleiner Feldberg” in Taunus from July 13 to August 17 2004 with the intensive phase from July 20 until August 4 (CitationDusek et al. 2006). The measurements were performed at the Taunus Observatory (Kleiner Feldberg, 825 m a.m.s.l., 50°13′25″N, 8°26′56″E) in central Germany.
The major objectives of the experiment were: (1) Physical and chemical characterization of the aerosol in central Europe in urban, rural, and remote air masses by state-of-the-art aerosol instrumentation; (2) Test and comparison of new and established measurement technology; (3) Investigation of links between aerosol properties in closure and model studies; and (4) Investigation of aerosol nucleation properties.
In this article we focus on the datasets obtained by two aerosol mass spectrometers, a ToF-AMS and a Q-AMS, in order to characterize the ToF-AMS and to demonstrate its capabilities and limitations. In this context, the FACE campaign provided a dataset that can be used to better understand the ToF-AMS performance under ambient atmospheric conditions during typical ground-based campaign operation. In addition to these aspects, emphasis is placed upon the analysis of ToF-AMS data and the data processing algorithms and software that was specifically developed for this purpose and is now used by multiple ToF-AMS user groups worldwide.
INSTRUMENT DESCRIPTION AND FIELD DEPLOYMENT
Only a short description of the two instruments will be given here as a detailed description of the Q-AMS can be found in CitationJayne et al. (2000) and CitationJimenez et al. (2003), and of the ToF-AMS in CitationDrewnick et al. (2005).
Both instruments have an identical vacuum system with an aerosol sampling chamber, a particle sizing chamber, a particle evaporation and ionization chamber, and a detection chamber. While the sampling, sizing, and evaporation/ionization techniques are identical in both instruments, the ion analysis technique is different: the Q-AMS uses a Balzers quadrupole mass spectrometer (QMG 422), whereas the ToF-AMS uses a compact Tofwerk orthogonal extraction time-of-flight mass spectrometer (TOF MS, e.g., CitationSteiner et al. 2001). A schematic of both instruments is shown in .
FIG. 1 Schematic of the Aerosol Mass Spectrometers. The lower part shows the vacuum system that is identical in both instruments, the upper parts show the mass analyzers and the detection system of Q-AMS (left) and ToF-AMS (right).
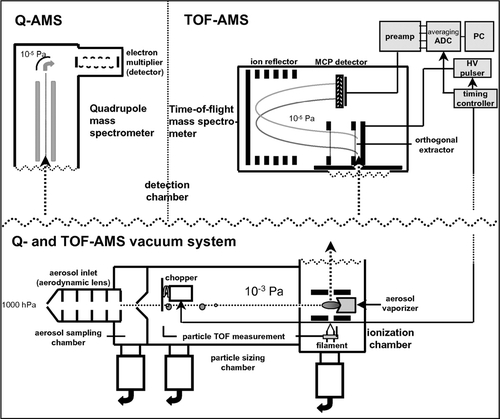
The aerosol is introduced into the instruments through a critical orifice and an aerodynamic lens assembly (CitationZhang et al. 2002; CitationZhang et al. 2004a). The 100 μ m critical orifice controls the inlet flow into the instrument to a nominal flow rate of 1.4 cm3/s. The aerodynamic lens focuses aerosol particles in the size range 50–600 nm with an efficiency of almost 100% into a narrow beam. After passing the sampling chamber the aerosol is directed through a skimmer into the particle sizing chamber, while most of the surrounding gas is pumped away. The last aperture of the aerodynamic lens works as a second critical orifice. Here the particles are accelerated to a size-dependent terminal velocity upon gas expansion into the vacuum chamber. At the front end of the particle sizing chamber the particle beam is modulated by a mechanical chopper at a frequency typically between 100 and 120 Hz. The duty cycles of the ToF-AMS and Q-AMS choppers are 1% and 2%, respectively. Aerodynamic particle size information can be obtained from the measured particle time-of-flight from the chopper to the vaporizer (see below) after calibration with particles of known size, density, and shape.
After traveling through the time-of-flight chamber the particle beam is directed onto the vaporizer, a conical porous tungsten surface typically heated to 400–700°C. Upon impaction onto this surface the non-refractory aerosol components flash-vaporize and the evolving vapor molecules are ionized by electron impact (E = 70 eV). The resulting positive ions are guided into the detection chamber which includes the mass spectrometer.
In the Q-AMS the ions are continuously guided into the quadrupole mass spectrometer which selects ions according to their mass-to-charge ratio (m/z) before their detection by an electron multiplier. In the ToF-AMS the ions are transferred into the source region of the time-of-flight mass spectrometer and accelerated orthogonally to their flight direction into the flight tube of the mass spectrometer by a pulsed electric field (pulsing frequency ∼ 83.3 kHz).
Both instruments can be operated in different modes of operation: in the MS or (average) mass spectrum mode the aerosol beam is alternately either permitted to reach the heater completely undisturbed or totally blocked by the chopper mechanism. When the particle beam is not blocked, mass spectra of the non-refractory aerosol components for an ensemble of particles are recorded together with the instrument background, while measuring with the beam blocked gives the background signal due to remaining air and vapor molecules only. In the Q-AMS a complete mass spectrum is scanned over a mass range of m/z 1–300 within 300 ms, with only one m/z being detected at any given time, while in the ToF-AMS a whole mass spectrum is acquired every 12 μ s.
In the P-TOF or particle time-of-flight mode the particle beam is chopped by the chopper wheel at a frequency of about 115 Hz. The mass spectrometer is synchronized with the opening of the chopper and the arrival times of the particles at the vaporizer are determined by time-resolved detection of the individual species. In the Q-AMS only selected m/z are detected in a given chopper cycle, while in the ToF-AMS complete mass spectra are recorded at each time step in every chopper cycle.
As mentioned before, the measurements were performed at the Taunus Observatory, which is operated by the Johann-Wolfgang-Goethe University of Frankfurt/Main. The measurement site consists of two sets of two stacked containers with a stairway in between and a platform on top.
The two aerosol mass spectrometers were deployed in one of the lower containers using a common inlet that separated into the two flows just in front of the instrument inlets. A PM1.0 cyclone (URG-2000-30EHB) was used as a size selecting inlet to remove supermicron particles. The inlet system had a total length of 6.6 m 1/2″ stainless steel tubing (ID = 12.7 mm) and 0.3 m 1/8″ stainless steel tubing (ID = 3.2 mm), a horizontal length of 0.6 m 1/2″ tubing and 0.25 m 1/8″ tubing and a total angle of curvature of 350° (1/2″) and 75° (1/8″). The height of the inlet above ground was 7.5 m. The volumetric flow rate through the 1/2” inlet was 16.3 l/min and 0.1 l/min through the 1/8″ inlet. Based on simple aerodynamic calculations for the individual loss mechanisms (CitationHinds 1999) the particle losses in the inlet system have been estimated to be less than 4% for particles between 50 nm and 1.3 μ m diameter, and less than 2% for particles with diameters between 100 nm and 900 nm.
During the FACE-2004 campaign both instruments were set to an alternate mode, switching between MS and PToF mode every 10 seconds. For both instruments the chopper frequency and vaporizer temperature were set to 115 Hz and 600°C, respectively. Average mass spectra and size distributions were saved to disk every 6 min for the Q-AMS and every minute until July 19 for the ToF-AMS. From July 19 until the end of the campaign the averaging time of the ToF-AMS was set to 5 minutes in order to save disk space. For the Q-AMS the following fragments were chosen to be measured in PToF mode: for nitrate m/z 30 (NO+) and 46 (NO2 +), for sulfate m/z 48 (SO+) and 64 (SO2 +), for ammonium m/z 15 (NH+), 16 (NH2 +) and 17 (NH3 +), for organics m/z 41, 43, 55, 57, 69, 71 (CnH2n + 1 and CnH2n - 1) and m/z 44 (CO2 +), and additionally m/z 18 (H2O+) and m/z 28 (N2 +).
For quality assurance, several calibrations have been performed before and during the campaign: for the ToF-AMS an ionization efficiency (IE) calibration was performed in the MPI laboratory directly before the campaign, as it was not possible to do this during the campaign with the used data acquisition software. For the Q-AMS an equivalent calibration was performed during the campaign on July 15. A particle size calibration was performed at the beginning of the campaign at the Taunus Observatory, on July 14, for both instruments simultaneously. For further information about how these calibrations are performed, see CitationJayne et al. (2000) and CitationDrewnick et al. (2005).
TOF-AMS DATA ANALYSIS
For analysis of the Q-AMS data, an existing data analysis tool box by James Allan (as described in CitationAllan et al. 2003a), was used. For the ToF-AMS data analysis an analysis software package has been developed using the IGOR Pro data analysis platform (version 5.04, WaveMetrics, Lake Oswego, USA). The individual data processing steps that are executed by this analysis program are illustrated in the flow chart shown in .
FIG. 2 Flow chart of the ToF-AMS data analysis procedure. Analysis of MS mode data is covered in the left column, of PToF mode data in the right column. Shown in the middle gray column are the corrections and calculations which are applied to both types of data.
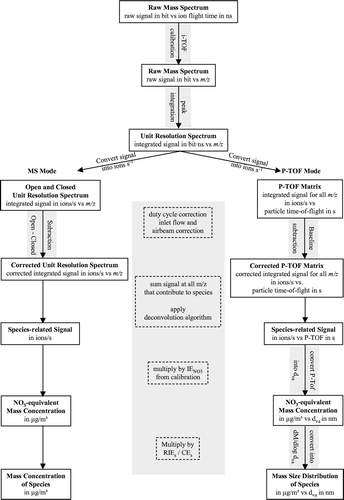
Since most of these individual steps have already been described in previous publications (e.g., CitationDrewnick et al. 2005; CitationAllan et al. 2003a), and since the ToF-AMS data analysis is similar to the Q-AMS data analysis, only a short description of the ToF-AMS data processing will be given here with emphasis placed on procedures which are different from Q-AMS data analysis.
Conversion of MS Signal into Mass Concentration of Individual Species
In order to convert the raw ToF-AMS mass spectrum ion currents into mass concentrations of the different chemical species, data analysis, and reduction consisting of several subsequent steps have to be performed. First, an accurate ion mass calibration (also called ion time-of-flight (IToF) calibration) of the raw spectra needs to be performed in order to be able to extract spectra of unit resolution in m/z space. As the ion flight time through the mass spectrometer is dependent on the applied voltages, which may slightly drift with changing ambient temperature, the software automatically performs an ion mass calibration for every mass spectrum individually.
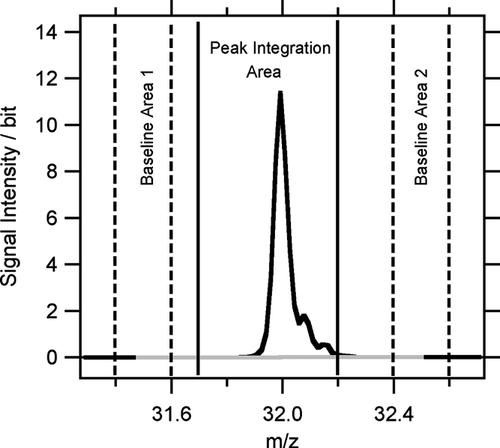
Unlike for a quadrupole mass spectrometer, where peak height is the relevant measure of the signal intensity, in a time-of-flight mass spectrometer the peak area is the physically meaningful value. In other words, extracting a unit resolution spectrum from a ToF-AMS raw spectrum is equivalent to calculating the peak areas at every m/z. There are different possible strategies of defining the peak integration borders. The algorithm used here uses an integration area of −0.3 to +0.2 m/z around the exact masses of the peaks. The area from –0.6 to −0.4 m/z before each m/z is used for baseline calculation. In order to account for possible baseline drifts over the peak, the baseline of each peak is defined as the average value of the baseline levels before and after the peak. The peak area is the sum of the measured value minus the average baseline value of all data points within the peak integration area (see ).
FIG. 3 Visualization of the peak integration algorithm. All points between the solid lines (−0.3 to +0.2 m/z around the exact m/z of a peak) belong to the peak integration area. In order to account for baseline drifts over the peak, the baseline of each peak is defined as the average value of the baseline range before (Baseline Area 1) and after (Baseline Area 2) the peak. The resulting area of the peak is calculated as the sum of all values within the integration area minus its average baseline value.
The unit resolution spectra need to be corrected for the ion-mass-dependent extraction efficiency into the time-of-flight mass spectrometer (duty cycle correction, CitationDrewnick et al. 2005). This is done by multiplying the signal at each m/z by the square root of a reference m/z divided by the actual m/z. The data processing software automatically applies this correction to each mass spectrum after integration of the raw spectrum. The reference m/z is user selectable; typically m/z 28 is used here.
The measured signal intensity can be converted from bits · ns into ions s− 1 according to Equations (Equation1) and (Equation2).
The conversion of the unit resolution spectra into mass concentrations of the individual species is equal to the procedure for the Q-AMS described in CitationJimenez et al. (2003) and CitationAllan et al. (2003a).
The species-related signal intensity is calculated by summing all signals at all m/z that contribute to this species and applying the deconvolution algorithm described in CitationAllan et al. (2004). Since fragmentation is a result of the flash vaporization and 70 eV electron impact ionization process and is not affected by the ion analysis and detection method, the algorithm by CitationAllan et al. (2004) can be applied to both Q-AMS and ToF-AMS data. The total species signal intensity is then converted into (nitrate-equivalent) mass concentrations by dividing with the ionization efficiency IE, the number of ions detected per molecule introduced into the instrument, obtained during an ionization efficiency calibration for the calibration species nitrate. As the ionization efficiencies of other species differ from the one obtained for the calibration species, the signal intensity of those species needs also to be multiplied by their relative ionization efficiency factor RIE (with respect to ammonium nitrate). This is equivalent to Q-AMS data processing and described in more detail in CitationJimenez et al. (2003) and CitationAlfarra et al. (2004). Several studies show that the AMS underestimates mass concentrations by approximately a constant factor. This is likely due to particle bounce from the vaporizer surface (CitationDeCarlo et al. 2005). In order to correct for this effect, the collection efficiency (CE) factor (defined as the number of detected particles divided by the number of particles passing through the inlet) is used (e.g., CitationDrewnick et al. 2005). It has been shown that a CE factor of 0.5 is a good estimate for most ambient data. Nevertheless, at high relative humidities or for liquid particles (like pure ammonium nitrate particles) particle bounce can be reduced which causes a CE factor greater than 0.5. Also, the CE factor can be different for different chemical species, if the particles are not internally mixed. For this study, however, we assumed internal mixture of the particles and a CE factor of 0.5 for all species was applied in the data processing software for both AMS types.
Calculation of Size Distributions
The PToF mode generates 260 mass spectra (this number can vary depending on the timing scheme used in the data acquisition software), each measured at a specific particle flight time in a chopper cycle. This results in a 2D matrix with complete mass spectra for each particle flight time in one chopper cycle in the columns and PToF distributions for individual m/z in the rows. Such a matrix is generated every time the data is stored onto the computer (usually a 1–10 minute averaging time is used for ambient measurements). The data analysis software then combines all of these 2D matrices into a single 3D matrix which gives the possibility to display time series of PToF distributions.
For conversion of the PToF mode data into size distributions, a baseline needs to be subtracted from all PToF distributions. This baseline is defined as the linear fit through the averages of several data points in the beginning and in the end of the PToF distribution, where no particle-related signal is expected (CitationAllan et al. 2003a). For m/z which have interferences of air beam species (which cause signal in the beginning of the distribution), only data points in the end of the distribution are used. The software package allows selecting which data points are used for baseline definition for each m/z individually. The procedures to convert raw mass spectra into mass concentrations of individual species described above can be used for PToF mode data as well as for MS mode data. This is a major difference to the Q-AMS data analysis, where only a limited number of m/z can be used for the calculation of the various species' size distributions, and is possible because PToF distribution data are obtained for all m/z in the ToF-AMS. However, the conversion of the measured particle flight times into particle vacuum aerodynamic diameters, as well as the conversion of mass concentrations into dM/dlog d va again is equivalent for both Q-AMS and ToF-AMS data.
As results of the data processing procedures described above, the ToF-AMS data processing software allows MS mode data to be displayed as average mass spectra for a selected time interval or as time series of the individual species' mass concentrations or of individual m/z. PToF mode data can be displayed as average size distributions of the individual species for a given time interval or as time series of size distributions of individual species (“image plots”). Since complete mass spectra are available for each size bin (i.e., each particle flight time) of the size distributions it is also possible to calculate and display average mass spectra for individual size ranges and user-selectable time intervals. The recently developed data analysis software package gives the user a large range of control options regarding the details of the individual analysis, correction, and visualization steps over a user-friendly interface that allows efficient analysis of ToF-AMS data.
RESULTS
Mass Concentration Data
The mass concentrations of nitrate, sulfate, ammonium, and total organics measured during FACE-2004 with both ToF-AMS and Q-AMS are plotted as time series in . In addition the total non-refractory mass concentration—the sum of these four species—is displayed. Both instruments show very similar trends with high and low mass concentration episodes, with the organics dominating the total aerosol most of the time. Within the first 10 days—except from July 20 18:00 h until July 21 10:00 h—both instruments agree well.
FIG. 4 Time series of non-refractory nitrate, sulfate, ammonium, total organics and total non-refractory mass concentrations, measured with ToF-AMS (upper panel) and Q-AMS (lower panel).
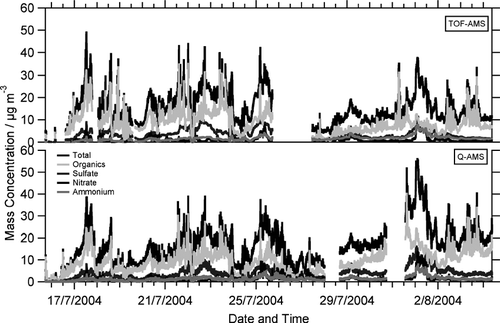
However, after a ToF-AMS pump failure on July 25 the ToF-AMS mass concentrations are significantly different, compared to the Q-AMS mass concentrations. Therefore we classify two different periods of the campaign: period I covers the time span before the pump failure (until July 25 17:00 h), period II covers the time span after the pump failure. In order to better compare ToF- and Q-AMS mass concentrations, correlations of 30-min averages have been calculated for nitrate, sulfate, ammonium, and total organics mass concentrations as shown in (data from period I in gray, data from period II in black). The solid lines are linear fits to the data of the periods before and after the ToF-AMS pump failure, period I and period II, respectively, the dashed line is the 1:1 line. The parameters of the linear fits are given in , with “recovery,” meaning the resulting slope of the linear regression when the intercept is forced to be zero.
FIG. 5 Correlations of ToF-AMS and Q-AMS mass concentrations for (a) nitrate, (b) sulfate, (c) ammonium, and (d) organics. Grey markers indicate data from period I (July 16–July 25 17:00 h), black markers from period II (July 27 12:00 h–August 4 9:00 h). The solid lines are linear fits for period I and II, the dashed line is the 1:1 line.
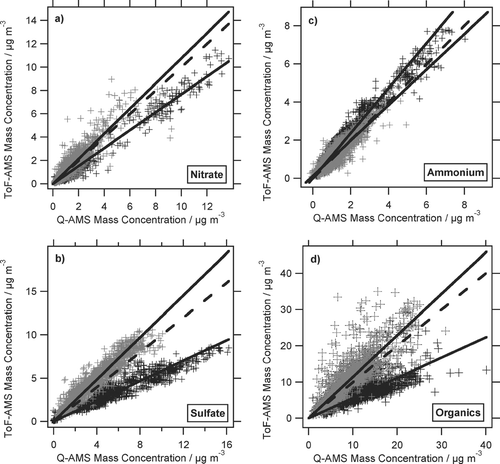
TABLE 1 Parameters of the linear fits in
For small intercept values this number directly gives information about the agreement between both instruments. During period I the two aerosol mass spectrometers show very good correlations for all species with slopes between 0.93 and 1.07 and correlation coefficients R2 between 0.69 and 0.83. Only the intercept of the linear fit to the organics is somewhat higher (1.14 μ g/m3). Calculating the “recoveries” for direct comparison of the two instruments results in slightly larger slopes, lying between 1.01 and 1.21. This comparison of the two Aerosol Mass Spectrometers is significantly better than the one performed during the PMTACS-NY 2004 campaign (see in Drewnick et al. 2005). It shows for the first time that the two instruments agree within the uncertainties of the instruments in the order of 10–20%. The lower correlation coefficient of the organics (compared to the other species) as well as the large intercept of this correlation are mainly due to the higher organic mass concentrations observed with the ToF-AMS but not with the Q-AMS late on July 18. Looking more closely at this time period, the unaveraged 1-min ToF-AMS data frequently show sharp peaks of high organic mass concentrations which are typically only one minute wide. Closer inspection of the related mass spectra reveals that these spikes are not due to instrument artefacts, but are caused by real aerosol material. The mass spectra of the spikes show a clear hydrocarbon-like organics pattern with no contribution from inorganic species. We therefore assume that these spikes are caused by individual or very few large particles consisting of pure hydrocarbon-like organic aerosol components, e.g., from a nearby contamination source. The exact origin of these particles could not be determined so far. The fact that these particles are measured by the ToF-AMS and not by the Q-AMS can be explained by the different mass spectra acquisition schemes of the two instruments: The QMS scans a mass range of 300 m/z in 0.3 s, using only the center 0.4 m/z per peak for signal measurement. Under the assumption that most of the signal of an organic particle is located in 5–10 m/z, the Q-AMS uses only 1/150 to 1/75 of the aerosol measurement time to detect the signal of such a particle. Since the particle evaporation time is in the order of 100 μ s (∼ 0.1 m/z scan range) the Q-AMS will only detect one out of 75–150 of such particle evaporation events. In contrast, the ToF-AMS measures 2–5 complete mass spectra during a particle evaporation event and thus will detect all particles that evaporate in the instrument during the aerosol measurement time. Thus the ToF-AMS is expected to measure ∼ 75–150 times more of such rare large particle evaporation events than the Q-AMS. This is in good agreement with ∼ 4 particle spikes observed in the Q-AMS and ∼ 300 spikes observed in the ToF-AMS during period I.
TABLE 2 Parameters of the average species-resolved size distributions, obtained by log-normal fits ( and ). Mode diameter values are given in nm; distribution widths are given as GSD
The linear fits for period II have similar good correlation coefficients R2 like the linear fits for period I, lying between 0.64 and 0.97, but the ToF-AMS concentrations of nitrate, sulfate, and organics are very low compared to those of the Q-AMS, while the ToF-AMS ammonium concentration exceeds those measured by the Q-AMS. The ToF-AMS pump failure–associated with excessive ion currents through the TOFMS—seems to have caused a damage of the MCP detector which resulted in significant reduction of signal intensities from the detector. Therefore the ToF-AMS single ion (SI) signal calibration performed in the beginning of the campaign is not valid anymore. Since it was not possible to recalibrate the ToF-AMS in the field, only period I can be used for meaningful quantitative data analysis and comparisons with other co-located instruments will only be made for period I.
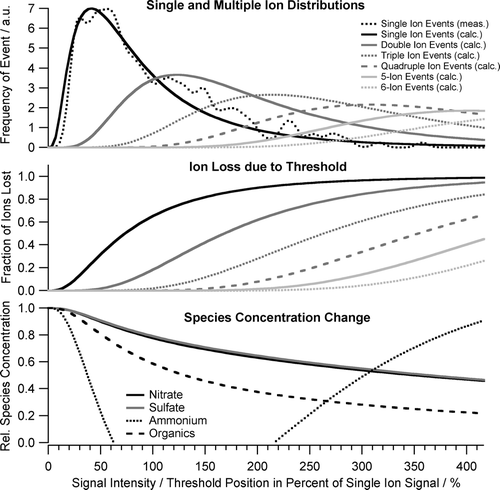
While the failure of a pump in the ToF-AMS resulted in the “loss” of a large fraction of the FACE data set, it provides some valuable insights into the details of ToF-AMS measurements and their sensitivity to detector performance. On first sight it is surprising that the apparent loss in MCP performance resulted in different reductions in measured mass concentrations for the individual species—or even in an increase in measured ammonium mass concentration. From a reduction in MCP gain one would expect a proportionate reduction in all signals in the mass spectrum, including the “air beam” signal at m/z 28, caused by the nitrogen that remains in the aerosol. Therefore one would expect no changes of species concentration after correction of all signals with the changed air beam intensity (air beam correction). However, looking at the details of ToF-AMS data acquisition it turns out that ion signals of different intensity (different number of ions reaching the detector at the same time, i.e., within the same mass spectrum at the same m/z) will be affected by changes of the detector performance to a different degree: In order to increase signal-to-noise ratio the ToF-AMS data acquisition system uses a user-defined signal threshold to discriminate low-intensity noise against larger intensity ion signals. During regular operation this threshold is set to a value at the lower end of the single ion signal intensity distribution and to a value above the large majority of the noise pulses. A reduction of the MCP performance—as experienced after the pump failure—will result in a decrease of the intensity of the single (and multiple) ion signals measured at the ToF-MS detector. As this reduction increases a larger and larger fraction of small ion signals (those being at the lower end of the ion signal intensity distribution, see , top trace) will fall below the threshold of the data acquisition card and consequently be lost for detection. Since it is conceivable that the individual species have different fractions of small ion signals one would expect different reductions in measured species concentrations for the species. And also a different reduction in measured air beam concentration, which is used to correct for detector gain changes. In order to verify if the observed changes in species concentration (compared to the Q-AMS measurements) can be explained by this mechanism the ion signal distribution (distribution of number of ions arriving at the detector at a certain m/z within an individual mass spectrum) for the observed mixture of species was modeled and the influence of reduced signal intensities on the measured mass spectra was calculated. Since in the data processing the signal levels were corrected for detector gain changes using the air beam signal (which is virtually not affected by threshold-related losses due to the large number of ions arriving simultaneously in the individual mass spectra) we only modeled the influence of an increase of ion detection threshold level (given in percent of average single ion signal level) on the measurement of individual species.
FIG. 7 Modeling input and output of threshold-related species concentration changes. Top panel: distributions of single and small multiple ion events as a function of ion signal intensity; middle panel: loss of single and small multiple ion events as a function of threshold position; lower panel: resulting modeled species concentration change as a function of threshold position. Signal intensity and threshold position are normalized to the average single ion signal intensity.
In a first step the distribution of ion signal intensities was modeled for the average conditions observed during period I. While gas phase related signals were homogeneously distributed over all mass spectra, signals originating from aerosol particles come in bunches, related to individual particles evaporating on the ToF-AMS vaporizer. Therefore the ion arrival distributions related to gas phase species and aerosol species were modeled individually and merged later.
For modeling the aerosol related ion arrival distribution for each individual m/z the average total non-refractory particle size distribution measured with the ToF-AMS during period I was used to derive the number of particles per size bin, necessary to generate the observed mass size distribution. For each m/z the observed number of ions per second was distributed proportionate over the calculated number distribution of particles. This resulted in average number of ions per particle for each m/z and particle size bin. For those particle size bins where less than one ion was observed per particle (and per m/z) the ion signal was set to a single ion and the observed number of particles was adjusted in order to match with the observed total number of ions per second in this size bin. Converting the distribution of particle sizes—and corresponding number of ions per particle—into a distribution of ion signal intensities for each m/z resulted in the particle-related ion arrival distribution for the average mass spectrum during period I. This distribution gives the frequency of single, double, and other multiple ion events for each m/z. After correcting for coincidences between the individual ion signals the assumed particle related ion distribution was obtained.
For the gas phase species the molecules arrive at the ionizer in a continuous stream instead of “chunks” like in the particle case. Therefore for these species and related m/z the ion distribution was calculated from the probability of finding different numbers of ions within a single mass spectrum for a given total number of ions and mass spectra per second.
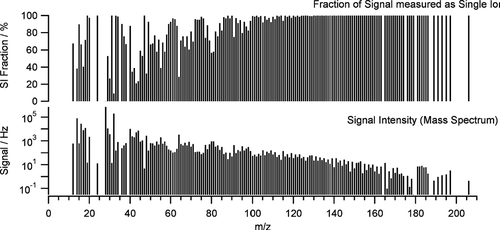
Finally the gas phase and particle related ion arrival distributions were merged, again correcting for coincidences between ion events of both distributions. This resulted in the average total measured ion arrival distribution for each individual m/z in the mass spectrum. For each m/z the fraction of the total ion signal that was located in single ion signals—i.e., arrived at the detector in form of individual ions per mass spectrum–was calculated. This fraction already gives some information about the sensitivity of the individual m/z on threshold-related small particle losses. The fractions of single ion signals are shown together with the average mass spectrum for period I in .
FIG. 6 Average mass spectrum in ions per second (lower graph) and average modeled fraction of signal arriving at the detector as single ions per mass spectrum (top graph). The larger the single ion signal fraction is the more sensitive the individual ions are to threshold-related small ion signal loss.
In order to derive information about the loss of ion signal due to different threshold values the intensity distribution of single and small multiple ion signals (2 to 6 ions) were calculated from the measured single ion signal intensity distribution from a calibration. This was done by folding the single ion signal intensity distribution with itself or with higher order ion intensity distributions up to the intensity distribution of the signal from 6 ions arriving at the detector at the same time (, top panel). The signal distributions are given as signal abundance over signal intensity, normalized to the average single ion intensity.
The fraction of the single and individual small multiple ion signals that are lost by an ion threshold were calculated from the fraction of the individual signals below the threshold value. In the middle panel of the fractional ion loss for each of the ion signals is plotted as a function of threshold position, again normalized to the average single ion signal.
Finally, by applying the fractional loss of the single and small multiple ion signals to the modeled ion arrival distributions of each m/z, the measured mass spectrum as a function of ion threshold is obtained. Using the standard data processing algorithms, the mass concentrations of the individual species are extracted from these mass spectra. In the lower panel of the mass concentrations for nitrate, sulfate, ammonium, and organics are calculated as a function of threshold position, normalized to a threshold position at zero percent of the average single ion signal.
For a threshold position around four times the average single ion signal (which, after applying the air beam correction, is equivalent to a decrease of the detector gain that brings down the average single ion signal to one fourth of the threshold level) one obtains changes of the species mass concentrations that agree with the observations in period II within 10%. Sulfate and nitrate concentrations are reduced to ∼ 60% of the initial values, organics is reduced to only 40% and for ammonium at large threshold values even an increase above the initial values is observed as in the comparison measurements. The differences in signal loss for nitrate/sulfate and organics can be easily explained by different fractions of the related m/z being single or small multiple ion signals. Nitrate and sulfate signals are concentrated onto few m/z, resulting in relatively large ion signals (many ions per mass spectrum) for these m/z. On the other hand, the organic signal is distributed over a large number of m/z having small signals, which are primarily found in single ions per mass spectrum (see , upper panel) and therefore are more susceptible to threshold-related small ion losses.
The situation for ammonium is slightly more complicated, because the ammonium-related signal intensity is calculated from the associated m/z signals by correction for large gas phase-related signals (CitationAllan et al. 2004). Therefore for ammonium most of the variation is caused by the influence of the ion threshold onto gas phase related signals like water vapor and air. Threshold-related changes in measured air and water vapor concentrations result in changes of calculated ammonium concentrations. For large reduction of the measured concentrations of these gas phase species the corrections to the ammonium related m/z are also reduced, finally resulting in increased calculated ammonium concentrations as observed during period II.
The calculations presented here were performed for variable threshold settings (relative to the average single ion signal). After the pump failure observed in the FACE campaign the threshold value did not change, but the signal intensity of the ion signals was reduced due to reduced MCP gain. This caused a reduction of the ion signals relative to the data acquisition threshold position with finally most of the small ion signals falling below the threshold. However, since in the data processing the resulting mass spectra are corrected to a constant air beam (signal at m/z 28), which is only slightly affected by threshold-related signal losses, the situation is equivalent to an increased threshold level (relative to single ion signal level) and the presented calculations are suited to explain the changes in the measured concentrations.
These results clearly show that large changes in detector performance of the ToF-AMS can result in unexpected changes of the measured species mass concentrations, which cannot be corrected for later using the air beam as a measure of detector gain. Due to the influence of the data acquisition threshold not only a proportional decrease in measured species concentrations is observed, but significant differences between the changes for individual species can occur. This is different to the Q-AMS, where excessive reduction in detector performance will result in proportional reduction in all ionic signals including the N2 + -signal (“air beam”) which can then be used to correct the particle mass concentrations. This is not the case in the ToF-AMS since the air beam is almost not affected by the threshold species concentrations. This shows that it is crucial for ToF-AMS operation to always keep the instrument within well calibrated conditions. Unfortunately this was not possible during the FACE 2004 campaign, since the data acquisition software did not allow to calibrate the single ion signal and to set the threshold easily in the field. However, the current ToF-AMS DAQ software enables the user to perform these processes also during field campaigns.
Size Distribution Data
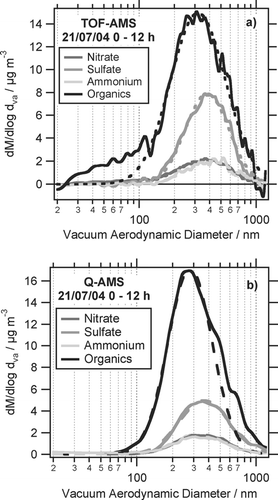
and show average size distributions of nitrate, sulfate, ammonium and organics, measured with the ToF-AMS and the Q-AMS for two different episodes during period I. Shown in is the average size distribution for July 20 0–12 h, in the average for July 21 0–12 h. Those episodes were chosen because both instruments were measuring during this time. In both periods the air came from south westerly directions, passing over the cities Mainz and Wiesbaden during the last hours before arriving at the measurement site. To be able to compare the size distributions of ToF-AMS and Q-AMS, for the calculation of the ToF-AMS organics size distribution only those m/z were used which were also scanned in the Q-AMS PToF mode. The deconvolution algorithm was applied to derive the organics components of these m/z. Using also other organics-related m/z for calculation of the ToF-AMS organic size distributions was used to check if the use of additional m/z would give additional information about the size distributions. This was not the case and showed that using the m/z scanned in Q-AMS PToF mode represent the organic size distributions well. The dashed lines in and show log-normal distributions fitted to the size distributions. The resulting fit parameters are given in .
FIG. 8 Average size distributions for July 20 of nitrate, sulfate, ammonium, and organics, measured with (a) ToF-AMS and (b) Q-AMS together with log-normal fits to the distributions.
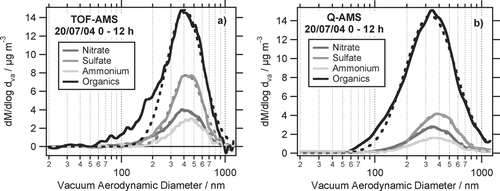
On both days the size distributions of both instruments are quantitatively very similar to each other, only the sulfate distribution is different in the ToF-AMS due to unknown reasons. The ToF-AMS mode diameters calculated from the log-normal fits are always slightly larger than the Q-AMS mode diameters (difference between 13 nm and 82 nm). Especially on July 21 the ToF-AMS organics size distributions extend to smaller particle sizes than the Q-AMS organics size distributions. As the size distributions for both ToF-AMS and Q-AMS are normalized to the mass concentrations obtained in MS mode of each instrument, this causes the ToF-AMS organics size distribution to be less intense than the Q-AMS organics size distribution. In addition, the observed higher sensitivity of the ToF-AMS for small particles causes the size distributions to be skewed towards smaller particles. This can be seen particularly in the organics size distributions and results in a shift of the maximum of the log-normal fits towards larger particles. In contrast to the calculated values in , the actual distribution maxima of the ToF-AMS and Q-AMS size distributions are very similar to each other and agree within their uncertainty of typically 20–30 nm.
To summarize, the size distributions of both instruments typically agree within their uncertainties and indicate small particles (d va < 150 nm) containing mostly organics.
CONCLUSIONS AND SUMMARY
The data sets of two Aerodyne Aerosol Mass Spectrometers—one Q-AMS and one ToF-AMS—obtained during the FACE-2004 campaign in summer 2004 have been compared. It was shown for the first time that the data obtained by the two instruments quantitatively agree when both instruments operate under well-calibrated conditions.
The mass concentration measurements of the two instruments show very good correlations with the slopes of the linear fits being near unity. However, a failure of one of the ToF-AMS pumps caused a damage of the MCP detector and consequently a reduction in detector gain. Therefore the single ion (SI) signal calibration conducted before the beginning of the campaign was not valid anymore and the data obtained after the pump failure could not be converted into correct mass concentrations. Model calculations of expected ion signal distributions and the influence of increased data acquisition threshold (or decreased single ion signal) explained the observed changes in measured species concentrations quantitatively. Different changes of measured mass concentrations for the individual species are due to different ion signal distributions, resulting in different losses of signal when the threshold cuts off small ion signals.
While most species showed relatively narrow correlations the organics correlation was somewhat broader. This was attributed to frequent spikes, mainly observed by the ToF-AMS and likely caused by few but very large organic particles of unknown origin. Due to the fact that the ToF-AMS measures several complete mass spectra during an individual particle evaporation event and the Q-AMS scans the mass spectra with a scan range of ∼ 0.1 m/z during such an event the Q-AMS measures only approximately one out of 75–150 of such large particle events, while the ToF-AMS detects all particles reaching the vaporizer.
The size distribution data of the two AMS instruments show good agreement in the averaged size distributions of individual species. Differences in the calculated mode diameters could be attributed to the higher sensitivity of the ToF-AMS in respect to small particles, causing the Q-AMS size distributions to be shifted towards larger particles. The actual distribution maxima of the ToF-AMS and Q-AMS size distributions agree very well within their uncertainties in the order of 20–30 nm. Both instruments indicate that small particles (d va < 150 nm) consisted predominantly of organics.
We thank the Johann-Wolfgang-Goethe University in Frankfurt/ Main for providing the facilities at the Taunus Observatory at Kleiner Feldberg. Special thanks goes to Heinz Bingemer for all the help and cooperation concerning this campaign. We thank the German Weather Service (DWD) for providing meteorological data as well as back trajectory calculations. Also, we would like to thank Jose-Luis Jimenez and Peter DeCarlo for providing the ToF-AMS data acquisition software. Silke Hings and Saskia Walter thank the International Max Planck Research School on Atmospheric Chemistry and Physics for funding of their participation in this work.
REFERENCES
- Alfarra , M. A. , Coe , H. , Allan , J. D. , Bower , K. N. , Boudries , H. , Canagaratna , M. R. , Jimenez , J. L. , Jayne , J. T. , Garforth , A. , Li , S. M. and Worsnop , D. R. 2004 . Characterization of Urban and Regional Organic Aerosols in the Lower Fraser Valley Using Two Aerodyne Aerosol Mass Spectrometers . Atmospheric Environment , 38 : 5745 – 5758 .
- Allan , J. D. , Jimenez , J. L. , Coe , H. , Bower , K. N. , Williams , P. I. , Jayne , J. T. and Worsnop , D. R. 2003a . Quantitative Sampling Using an Aerodyne Aerosol Mass Spectrometer, Part 1: Techniques of Data Interpretation and Error Analysis . J. Geophys. Res.—Atmospheres , 108 : 4090
- Allan , J. D. , Coe , H. , Bower , K. N. , Williams , P. I. , Gallagher , M. W. , Alfarra , M. R. , Jimenez , J. L. , Nemitz , E. , McDonald , A. G. , Canagaratna , M. R. , Jayne , J. T. and Worsnop , D. R. 2003b . Quantitative Sampling Using an Aerodyne Aerosol Mass Spectrometer, Part 2: Measurements of Fine Particulate Chemical Composition in Two UK Cities . J. Geophys. Res.—Atmospheres , 108 : 4091
- Allan , J. D. , Coe , H. , Bower , K. N. , Alfarra , M. R. , Delia , A. E. , Jimenez , J. L. , Middlebrook , A. M. , Drewnick , F. , Onasch , T. B. , Canagaratna , M. R. , Jayne , J. T. and Worsnop , D. R. 2004 . Technical Note: Extraction of Chemically Resolved Mass Spectra from Aerodyne Aerosol Mass Spectrometer Data . J. Aerosol Sci. , 35 : 909 – 922 .
- Allen , M. D. and Raabe , O. G. 1982 . Re-Evaluation of Millikan's Oil Drop Data for the Motion of Small Particles in Air . J. Aerosol Sci. , 13 : 6 – 547 .
- DeCarlo , P. , Slowik , J. G. , Worsnop , D. R. , Davidovits , P. and Jimenez , J. L. 2004 . Particle Morphology and Density Characterization by Combined Mobility and Aerodynamic Diameter Measurements. Part 1: Theory . Aerosol Sci. Technol. , 38 : 1185 – 1205 .
- DeCarlo , P. F. , Kimmel , J. R. , Trimborn , A. , Northway , M. J. , Jayne , J. T. , Aiken , A. C. , Gonin , M. , Fuhrer , K. , Horvath , T. , Docherty , K. , Worsnop , D. R. and Jimenez , J. L. 2006 . A Field-Deployable High-Resolution Time-of-Flight Aerosol Mass Spectrometer . Anal. Chem. , 78 : 8281 – 8289 .
- Drewnick , F. , Schwab , J. J. , Jayne , J. T. , Canagaratna , M. , Worsnop , D. R. and Demerjian , K. L. 2004 . Measurement of Ambient Aerosol Composition during the PMTACS-NY 2001 Using an Aerosol Mass Spectrometer. Part I: Mass Concentrations . Aerosol Sci. Technol. , 38 : 92 – 103 .
- Drewnick , F. , Hings , S. S. , DeCarlo , P. F. , Jayne , J. T. , Gonin , M. , Fuhrer , K. , Weimer , S. , Jimenez , J. L. , Demerjian , K. L. , Borrmann , S. and Worsnop , D. R. 2005 . A New Time-of-Flight Aerosol Mass Spectrometer (ToF-AMS)—Instrument Description and First Field Deployment . Aerosol Sci. Technol. , 39 : 637 – 658 .
- Dusek , U. , Frank , G. P. , Hildebrandt , L. , Curtius , J. , Schneider , J. , Walter , S. , Chand , D. , Drewnick , F. , Hings , S. , Jung , D. , Borrmann , S. and Andreae , M. O. 2006 . Size Matters More Than Chemistry for Cloud Nucleating Ability of Aerosol Particles . Science , 312 : 1375 – 1378 .
- Jayne , J. T. , Leard , D. C. , Zhang , X. , Davidovits , P. , Smith , K. A. , Kolb , C. E. and Worsnop , D. R. 2000 . Development of an Aerosol Mass Spectrometer for Size and Composition Analysis of Submicron Particles . Aerosol Sci. Technol. , 33 : 49 – 70 .
- Jimenez , J. L. , Jayne , J. T. , Shi , Q. , Kolb , C. E. , Worsnop , D. R. , Yourshaw , I. , Seinfeld , J. H. , Flagan , R. C. , Zhang , X. , Smith , K. A. , Morris , J. W. and Davidovits , P. 2003 . Ambient Aerosol Sampling Using the Aerodyne Aerosol Mass Spectrometer . J. Geophys Res.—Atmospheres , 108 : 8425
- Hinds , W. C. 1999 . Aerosol Technology–Properties, Behavior, and Measurement of Airborne Particles. , Second Edition , Toronto : John Wiley & Sons, Inc. .
- Lohmann , U. and Feichter , J. 2005 . Global Indirect Aerosol Effect: A Review . Aerosol Chem. Phys. , 5 : 715 – 737 .
- Murphy , D. M. and Thomson , D. S. 1997a . Chemical Composition of Single Aerosol Particles at Idaho Hill: Negative Ion Measurements . J. Geophys. Res. , 102 : 6353 – 6368 .
- Murphy , D. M. and Thomson , D. S. 1997b . Chemical Composition of Single Aerosol Particles at Idaho Hill: Positive Ion Measurements . J. Geophys. Res. , 102 : 6341 – 6352 .
- Prather , K. A. , Nordmeyer , T. and Salt , K. 1994 . Real-Time Characterization of Individual Aerosol Particles Using Time-of-Flight Mass Spectrometry . Anal. Chem. , 66 : 1403
- Silva , P. J. and Prather , K. A. 2000 . Interpretation of Mass Spectra from Organic Compounds in Aerosol Time-of-Flight Mass Spectrometry . Anal. Chem. , 72 : 3553 – 3562 .
- Steiner , W. E. , Clowers , B. H. , Fuhrer , K. , Gonin , M. , Matz , L. M. , Siems , W. F. , Schultz , A. J. and Hill , H. H. Jr. 2001 . Electrospray Ionization with Ambient Pressure Ion Mobility Separation and Mass Analysis by Orthogonal Time-of-Flight Mass Spectrometry . Rapid Communications in Mass Spectrometry , 15 : 2221 – 2226 .
- Wichmann , H.-E. , Spix , C. , Tuch , T. , Wölke , G. , Peters , A. , Heinrich , J. , Kreyling , W. G. and Heyder , J. 2000 . Daily Mortality and Fine and Ultrafine Particles in Erfurt, Germany. Part I: Role of Particle Number and Particle Mass . Health Effects Institute Research Report , : 98
- Zhang , X. , Smith , K. A. , Worsnop , D. R. , Jimenez , J. L. , Jayne , J. T. and Kolb , C. E. 2002 . A Numerical Characterization of Particle Beam Collimation by an Aerodynamic Lens-Nozzle System: Part I. An Individual Lens or Nozzle . Aerosol Sci. Technol. , 36 : 617 – 631 .
- Zhang , X. , Smith , K. A. , Worsnop , D. R. , Jimenez , J. L. , Jayne , J. T. , Kolb , C. E. , Morris , J. and Davidovits , P. 2004a . Characterization of Particle Beam Collimation: Part II. Integrated Aerodynamic Lens-Nozzle System . Aerosol Sci. Technol. , 38 : 619 – 638 .
- Zhang , Q. , Stanier , C. O. , Canagaratna , M. C. , Jayne , J. T. , Worsnop , D. R. , Pandis , S. N. and Jimenez , J. L. 2004b . Insights into the Chemistry of Nucleation Bursts and New Particle Growth Events in Pittsburgh Based on Aerosol Mass Spectrometry . Environ. Sci. Technol. , 38 : 4797 – 4809 .
- Zhang , Q. , Alfarra , M. R. , Worsnop , D. R. , Allan , J. D. , Coe , H. , Canagaratna , M. R. and Jimenez , J. L. 2005 . Deconvolution and Quantification of Primary and Oxygenated Organic Aerosols Based on Aerosol Mass Spectrometry. Part 1: Development and Validation of the Method . Environ. Sci. Technol. , 39 : 4938 – 4952 .
