Abstract
A field-compatible collection system was developed and tested for the collection and analysis of fungal fragments. The new collection system consists of two types of Sharp-Cut cyclone samplers (PM 2.5 and PM 1.0 ) and an after-filter. Fungal particles are collected into three size fractions: (1) spores ( > 2.5 μ m); (2) a fragment-spore mixture (1.0–2.5 μ m); and (3) submicrometer-sized fragments ( < 1.0 μ m). The system was laboratory-tested using polystyrene latex (PSL) particles and particulate matter aerosolized from sporulating Aspergillus versicolor and Stachybotrys chartarum cultures. In addition to the particle count measured with direct-reading instruments, the (1 → 3)- β -D-glucan content in each size fraction was determined with the Limulus Amebocyte Lysate (LAL) assay.
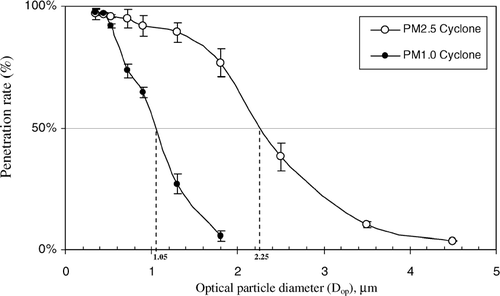
Experiments conducted with PSL particles showed that the 50% cut-off values of the two cyclone samplers under the test conditions were 2.25 μ m and 1.05 μ m, respectively. No particle bounce onto the after-filter was observed when the total particle number entering the collection system was kept below 1.6 × 10 8 . The (1 → 3)- β -D-glucan assay of samples aerosolized from both fungal species suggested that surface area is an important factor for determining the (1 → 3)- β -D-glucan content in the entire size-range of particles.
In conclusion, the new methodology is a promising tool for separating and analyzing fungal fragment samples.
INTRODUCTION
In the United States, it is estimated that 36–52% of homes have mold or moisture problems (CitationSpengler et al. 1994; CitationSalo et al. 2005; CitationCho et al. 2006). Health effects, such as inflammation, infection, and allergies, have been associated with exposures to indoor dampness and molds (CitationVerhoeff et al. 1997). Much evidence exists indicating that indoor exposures to molds contribute to occupant respiratory disease and symptoms (e.g., allergic rhinitis, asthma, hypersensitive pneumonitis) (CitationInstitute of Medicine 2004). However, the association between the concentration of airborne fungal spores and adverse respiratory effects has not been well documented and is still controversial (CitationMeklin et al. 2002; CitationCooley et al. 1998; CitationRao et al. 1996). Recent studies have suggested that exposures to submicrometer-sized fungal particles (i.e., fungal fragments) potentially contribute to adverse health effects due to their small physical size and composition. These fungal fragments contain fungal antigens and mycotoxins (CitationGórny et al. 2002; CitationBrasel et al. 2005). Assessing exposures to these particles for health effect is challenging due to the difficulty in their separation and collection.
Traditional sampling and post-collection analysis for fungi focuses primarily on intact spores (CitationMartinez et al. 2004). For example, cascade impactors (e.g., ELPI and Andersen multi-stage sampler) are commonly used for size-selective sampling of airborne particles. However, their application toward fungal particles is problematic since spores are prone to bounce from upper to lower stages, making it difficult to separate fungi-associated submicrometer-sized particles from fungal spores (CitationTrunov et al. 2001; CitationCho et al. 2005). Submicrometer-sized fungal particles cannot be analyzed by traditional methods such as culture (i.e., colony counts) or light microscopy (i.e., total spore counts). Culturing only accounts for viable, culturable intact cells that can grow on specified agar media, while light microscopy is limited to particles > 0.2 μ m in size. In addition, these analytical methods do not take into account the potential toxic or allergenic effects of submicrometer-sized fungal particles.
Analytical techniques for fungi based on their constituents, such as glucans, extracellular polysaccharides, and antigens, have recently been suggested as alternatives for mold assessment (CitationDouwes et al. 1999; CitationRao et al. 2004; CitationGreen et al. 2006). Measuring fungal constituents may be more representative of total fungal exposures since these measurements do not rely on culturable intact spores, but measure fungal components, which may have direct health effects (e.g., toxic or allergenic potential) (CitationInstitute of Medicine 2004; CitationDouwes 2005). (1 → 3)-β-D-glucan has been used as a measure of total fungal biomass (CitationChew 2001; CitationRao et al. 2004). Glucans are the major water-insoluble structural cell wall component (up to 60% of the dry weight) of most fungi (CitationDouwes 2005). Physical environmental factors such as temperature and water activity do not influence the (1 → 3)-β-D-glucan content of fungal cell walls (CitationFoto et al. 2004; CitationFogelmarker and Rylander 1997).
We developed and tested a new field-compatible collection system for submicrometer-sized fungal particles using cyclone samplers, which generally show less particle bounce than cascade impactors. We tested the system for the collection of fungal particles in three size fractions: (1) spores; (2) a mixture of fragments and spores; and (3) submicrometer-sized fragments. The performance of the system was evaluated with standardized monodisperse polystyrene latex (PSL) particles and fungal particles aerosolized from cultures of two common indoor molds (CitationHyvärinen et al. 2002), Aspergillus versicolor and Stachybotrys chartarum. Since traditional analytical methods cannot measure fungal fragments, we measured the (1 → 3)-β -D-glucan content of the fragment and spore size fractions.
MATERIALS AND METHODS
The New Fragment Sampling System
The new sampling system consists of two Sharp-Cut cyclone samplers (PM2.5 and PM1.0; BGI Inc., Waltham, MA) and a 25-mm after-filter cassette preloaded with gamma-sterilized polycarbonate filter (0.4 μ m of pore size: SKC Inc., Eighty Four, PA) (). The two cyclone samplers are connected in sequence so that spores (> 2.5 μ m) are captured in the PM2.5 cyclone sampler, a mixture of fragments and spores (1.0–2.5 μ m) is collected in the PM1.0 cyclone sampler, and submicrometer-sized fragments are collected onto the after-filter.
FIG. 1 Experimental setup: OPC = Optical Particle Counter; CNC = Condensation Nucleus Counter. Q = the air flow rate (l min− 1).
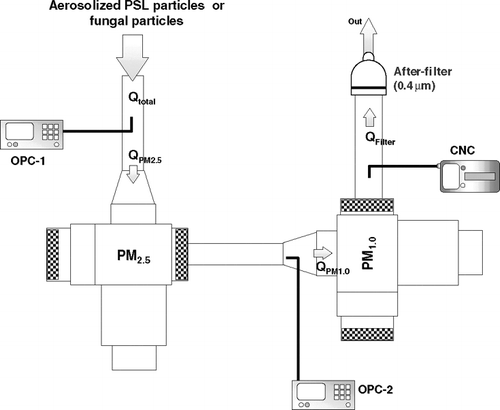
We used an optical particle counter (OPC; Model 1.108, Grimm Technologies, Inc., Douglasville, GA) and a condensation nucleus counter (CNC; P-Trak®, TSI Inc., Shoreview, MN) to continuously measure particle numbers. The size-selective OPC covers the size range of 0.3–20.0 μ m in 15 channels while the CNC measures the total number of smaller particles between 0.02–1.0 μ m. Two OPCs (OPC-1 and OPC-2) were incorporated into the system, one upstream and one downstream of the PM2.5 cyclone sampler. The number of fungal particles collected into the PM2.5 cyclone sampler was calculated as the difference between the concentrations obtained in the two OPCs. A CNC located downstream of the PM1.0 cyclone sampler measured the number of submicrometer-sized fragments retained on the after-filter. In separate tests, measurement differences between the two OPCs in 15 size channels were found to be within 6.0% when tested with NaCl aerosol particles. In addition, the collection efficiency of the after-filter was found to be over 99.2% in the size range of 0.01–0.3 μ m.
The design flow rate of the Sharp-Cut cyclone samplers is 16.7 l min− 1. However, our new collection system consists of two types of direct reading instruments which take part of the air flow from the system (OPC: 1.2 l min− 1; CNC: 0.7 l min− 1). Therefore, the actual flow rates in our system differed from the design flow rates and the corrected values are 20.5 l min− 1at the inlet (Qtotal), 19.3 l min− 1 (QPM2.5) through the PM2.5 cyclone sampler, 17.4 l min− 1 (QPM1.0) through the PM1.0 cyclone sampler, and 16.7 l min− 1 (QFilter) through the after-filter. Thus, we anticipated some changes in the aerodynamic particle cut-off sizes of the cyclone samplers, corresponding to 50% penetration values.
The sampling system was tested under controlled laboratory conditions using monodisperse PSL particles and the particulate matter aerosolized from in vitro cultures of A. versicolor and S. chartarum. The entire experimental setup was operated inside a Class II Biosafety cabinet (SterilchemGard, Baker Company, Inc., Sanford, ME).
Penetration Testing Using PSL Particles
As the flow rates in our system differed from the design flow rates of the two Sharp-Cut cyclone samplers, we determined the particle penetration characteristics of the PM2.5 and PM1.0 cyclone sampler under our experimental conditions with PSL particles (Bangs Laboratories Inc., Fishers, IN), with mean diameter values of less than 10% of coefficients of variation. A mixture of PSL particles of three aerodynamic sizes, 0.54 μ m, 1.79 μ m, and 3.94 μ m, was used to simulate a broad range of fungal particle size fractions. PSL particles were aerosolized as described by CitationAizenberg et al. (2000). Briefly, a six-jet nozzle Collison Nebulizer (BGI Inc., Waltham, MA) was used to generate aerosols from PSL suspensions (10% of concentration: 1 ml of PSL particle suspension + 9 ml of sterile deionized water) at a flow rate of 6 l min− 1and a pressure of 20 psi. The aerosol flow was adjusted to 30 l min− 1by dilution with HEPA-filtered clean air and neutralized using a 10-Ci 85Kr electric-charge neutralizer (model 3012, TSI Inc., St. Paul, MA) before entering the test chamber.
Aerosolized PSL particles which passed through the PM2.5 or PM1.0 cyclone sampler were measured and enumerated by two OPCs up- and downstream of each cyclone sampler. For penetration testing of the PM1.0 cyclone sampler, the CNC located downstream of the PM1.0 cyclone sampler was replaced by an OPC-1 (see ) and the total flow rate was adjusted to match the inlet flow rate of the PM1.0 cyclone sampler (QPM1.0). Penetration values for each cyclone sampler were calculated using the following equation:
Testing with Fungi
(a) Preparation of Test Aerosols
The microbiological testing was conducted with particles aerosolized from cultures of A. versicolor and S. chartarum. An isolate of A. versicolor (RTI 367: Research Triangle Institute International, Research Triangle Park, NC) and an isolate of S. chartarum (JS51-05) that was characterized as non-toxic by CitationJarvis et al. (1998) were utilized. Both of these species produce asexual spores (conidia).
Fungal cultures for aerosolization tests were prepared as described by CitationSchmechel et al. (2003). Briefly, A. versicolor and S. chartarum were allowed to grow on 2% malt extract agar (MEA: 20 g l− 1 Dextrose; 20 g l− 1 Malt Extract; 20 g l− 1 Agar; 1 g l− 1 Peptone; Difco, Becton Dickinson, Sparks, MD) for one week. Fungal spores were harvested from matured sporulating cultures by applying 1 g of dry, autoclaved glass microbeads (0.4–0.6 mm in diameter: B. Braun Biotech International, Melsungen, Germany) per Petri plate. The beads were gently shaken across the sporulating culture, and then were transferred into a 50-ml sterile tube (Fisher Scientific, Pittsburgh, PA) containing sterile deionized water (5-stage Milli-Q Plus System, Millipore Corp., Bedford, MA) with 0.05% Tween 80 (Sigma Chemicals Co., St. Louis, MO). Spore concentrations were adjusted to 106 spores ml− 1 using a brightline hemacytometer (Model 3900, Hausser Scientific Company, Horsham, PA) and 0.1 ml were used to inoculate fresh agar plates for particle aerosolization experiment.
Fungal particles were aerosolized from agar surfaces with a Fungal Spore Source Strength Tester (FSSST), which was designed to aerosolize fungal particles from contaminated surfaces using high-speed HEPA-filtered air-jets (CitationSivasubramani et al. 2004). The FSSST was operated at a flow rate of 20.5 l min− 1 to match the total flow rate of the new collection system. Individual culture plates were kept for four minutes in the FSSST. If longer aerosolization times were needed, spent plates were replaced by new ones without shutting down the collection system. Aerosolized fungal particles were collected into the collection cups of each Sharp-Cut cyclone sampler and onto the after-filter according to their aerodynamic size (e.g., > 2.5 μ m, between 1.0–2.5 μ m, < 1.0 μ m).
In order to increase the number of aerosolized spores and fragments from fungal cultures, we investigated different growth conditions to optimize fungal sporulation. It is well established that nutrient deprivation is a primary factor for the induction of sporulation for many fungi (CitationFischer and Kües 2006). For this reason, we simulated limiting nutrient availability by reducing the amount of growth medium to 5 or 20 ml of 2% MEA per Petri plate. Plate were inoculated with fungal spores as already described and incubated at 20–24°C and a relative humidity of 32–40% for one week. Particles were aerosolized using the FSSST and the number concentration of released particles was measured with the OPC-1.
(b) Bounce Testing
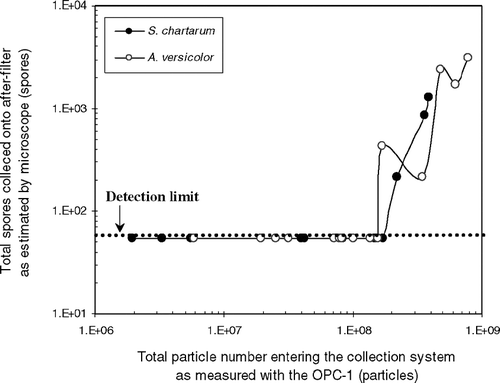
Cyclones operate by the principle of centrifugal impaction. While this method causes less particle bounce than inertial impaction, bounce can occur if the collection cup of the cyclone becomes overloaded. In the present study, spore bounce from the PM1.0 cyclone sampler onto the after-filter was investigated to determine the highest aerosol particle concentration that could enter the system at which no spores were observed on the after-filter. To test this, particles, originating from culture plates, were collected into the collection system at sequentially increasing loads. First, one culture plate was used to generate fragments and spores. After collection, particles were removed from the after-filter for microscopic evaluation. For this, particles collected onto the polycarbonate filter were suspended in two ml of sterile deionized water with 0.05% Tween 80 in a 10-ml sterile tube (Fisher Scientific, Pittsburgh, PA) by vortexing for two minutes followed by a 10-min ultrasonic bath agitation (Fisher Ultrasonic Cleaners, Model FS20, 3 qt., 120 V 50/60 Hz, 1 A, 80 W, without heater: Fisher Scientific Inc., Pittsburgh, PA) (CitationWang et al. 2001). Aliquots of 0.5 ml were filtered though a 13-mm mixed cellulose ester (MCE) filter with a pore size of 1.2 μ m (Millipore Corporation, Bedford, MA) using an analytical stainless-steel vacuum filter holder (Fisher Scientific, Pittsburgh, PA). The filter was placed on a standard glass slide and cleared by acetone vapor. Forty randomly selected microscopic fields were examined using a light microscope (Leitz Laborlux S, Leica Mikroskopie und Systeme GmbH, Wetzler, Germany) at 400× magnification, and spores were enumerated.
This procedure was repeated using two, three, four, and five plates per test until spores were found on the after-filter. Total particle load, measured with the OPC-1 for each test, was used to establish the loading threshold of particles showing bounce.
Collection of Airborne Fungal Particles
After establishing the loading limit of particle bounce, the collection experiments were performed using particles released from A. versicolor and S. chartarum cultures. Airborne fungal particles were separated and collected into three distinct size fractions as already described. Four plates were used to keep particle numbers entering the collection system below the threshold value while collecting sufficiently large samples for (1 → 3)-β-D-glucan analyses. During the aerosolization experiment, the number concentrations of aerosolized particles were measured by the two OPCs and the CNC and this aerosolization experiment was repeated three times.
(1 → 3)-β-D-glucan assay
Fungal particles collected were extracted from the after-filters and the collection cups of each cyclone sampler, and then these extracts were analyzed for (1 → 3)-β-D-glucan using the kinetic chromogenic Limulus Amebocyte Lysate (LAL) method (Glucatell®: Associates of Cape Cod, East Falmouth, MA).
After-filters containing submicrometer-sized fungal particles were unloaded from sealed cassettes inside a Biosafety cabinet and aseptically transferred to a pyrogen-free tube (Pyrotubes®, 13 × 100 mm borosilicate glass tube: Associates of Cape Cod, East Falmouth, MA). Two ml of pyrogen-free water (LAL Reagent Water®: Associates of Cape Cod, East Falmouth, MA) containing 0.05% Tween 80 were added and filters were allowed to soak at room temperature (20–24°C) for one hour. Particles were extracted by vortexing and ultrasonic agitation as already described. The resulting particle suspensions were used for both microscopic enumeration and (1 → 3)-β-D-glucan analysis (0.5 ml). Only samples that did not have intact spores on the after-filter, as determined microscopically, were analyzed for (1 → 3)-β-D-glucan. Fungal particles collected into the collection cups of each PM1.0 and PM2.5 cyclone sampler were extracted using two and nine ml of pyrogen-free water containing 0.05% Tween 80, respectively, according to each collection cup size (three and 10 ml, respectively). Extraction was performed as described for the after-filter. Aliquots of each extract (0.5 ml) were used for analysis.
For analysis, 0.5 ml of 0.6 M NaOH (Fisher Scientific, Pittsburgh, PA) was added to each 0.5 ml extract. This suspension was shaken using a mechanical shaker (Wrist-action® Shaker, Model 75: Burrell Scientific, Pittsburgh, PA) for one hour in order to extract (1 → 3)-β-D-glucan from the suspended fungal particles by unwinding its triple-helix structure and making it water-soluble (CitationFoto et al. 2004; CitationIossifova et al. 2007a).
For quality control purposes, coefficients of intra- and interplate variation (CV) were calculated. Fungal extract from a single plate or from three plates were analyzed for intraplate and interplate CVs, respectively. The (1 → 3)-β-D-glucan content CV for each analysis was estimated from three aliquots per plate and each analysis was repeated three times.
To destroy and/or remove residual (1 → 3)-β-D-glucan between each run, the experimental setup including metal parts and rubber O-rings were washed with soap, and sequentially rinsed with tap water and a 2-propanol (Fisher Scientific Company, GA) wash using ultrasonic agitation in a bath for 10 minutes. Finally, all metal parts were heated for one hour at 240°C. For quality control purposes, the cleaning efficiency was verified by repeating the extraction protocol for cleaned, blank cyclone collection cups and analyzing the extracts for (1 → 3)-β-D-glucan. Blank filters and neat extraction solution were also analyzed monthly.
(1 → 3)-β-D-glucan results were expressed as concentrations (ng m− 3 air) and as content per particle (particle-specific (1 → 3)-β-D-glucan content; ng particle− 1). The OPC and CNC data were utilized to calculate the content per particle.
Estimations were also performed for the (1 → 3)-β-D-glucan content per total surface area of particles (surface area-specific (1 → 3)-β-D-glucan content; ng μ m− 2). The particle surface area in the three size fractions was calculated based on the size distribution of spores of the same fungal strains similarly aerosolized in our earlier study and measured with an electrostatic low pressure impactor (ELPI) (CitationCho et al. 2005). The total surface area of particles was first calculated separately for each of the 12 stages of the ELPI based on the size and number of collected particles on each stage. The 12 surface area distributions were then combined into three groups that most closely coincided with the particle size fractions collected by our new system. The three groups were defined as 0.041–0.80 μ m representing ELPI stages 1–7, 1.26–2.0 μ m representing ELPI stages 8–9, and 3.1–8.2 μ m representing ELPI stages 10–12. The combined surface areas for each group were calculated based on the assumption that all particles were spherical. Specific (1 → 3)-β-D-glucan content was then expressed as amount per total surface area (ng μ m− 2).
Data Analysis
Data were statistically analyzed by t-test using the software package STATISTICA for Windows (StatSoft, Inc., Tulsa, OK). Because data were not normally distributed, they were log-transformed and analyzed by linear regression.
RESULTS AND DISCUSSION
Penetration and Bounce Test
PSL particle penetration curves for the PM2.5 and PM1.0 cyclone sampler are shown in . The penetration rate (%) of PSL particles obtained for different particle sizes is plotted as a function of the optical particle diameter (Dop). shows the experimental 50% penetration value for the PM2.5 and for the PM1.0 cyclone sampler to be 2.25 μ m and 1.05 μ m, respectively. As mentioned above, some deviation from the nominal design penetration values was expected due to the increased flow rate in our experimental system. From these data, one would expect that the majority of fungal spores would be efficiently collected by our system since most spores are greater than 1.05 μ m (CitationCho et al. 2005; CitationReponen 1995; CitationBaron and Willeke 2001).
FIG. 2 PSL particle penetration curves and their corresponding 50% penetration values for the Sharp-Cut cyclone samplers at a flow rate of 19.3 l min− 1 for PM2.5 and 17.4 l min− 1 for PM1.0. Each data point presents the average of three repeated experiments. The error bars represent standard deviations calculated for each group.
Spore numbers found on the after-filter are plotted in as a function of total particles entering the collection system as measured with the OPC-1. For both fungal species, spore bounce was observed when more than 1.6 × 10⁸ particles were measured with the OPC-1. These results demonstrate that spore bounce may occur in the cyclone sampler when the collection cup becomes overloaded. Fungal particles have a more elastic and/or spiny surface, which does not provide good contact between a particle and the collection medium (CitationTrunov et al. 2001). Because of this, bounce may occur as soon as the inside wall of the collection cup becomes saturated with an elastic layer of aerosol particles. The loading threshold of 1.6 × 10⁸ particles was set for further testing to avoid particle bounce.
FIG. 3 Spore number collected on the after-filter as a function of the total particle number entering the collection system as measured with the OPC-1. The dotted line represents the lower detection limit of spore numbers (55 spores).
Comparison of Particle Release from Fungal Cultures Grown on 5 or 20 ml of 2% MEA Per Petri Plate
shows the particle size distribution curves of A. versicolor and S. chartarum when measured by the OPC-1. Overall, statistical analysis ( t -test) showed that the number of fungal particles released from 5 ml of 2% MEA was significantly higher than that for 20 ml over the measured particle size range (P < 0.05). For A. versicolor, the number of particles released from 5 ml of 2% MEA was 1.8 to 9.6 times higher than that from 20 ml, depending on the particle size. For the submicrometer size range, it was about 3.5-fold higher. Similarly, for S. chartarum, particle release from 5 ml of 2% MEA was 1.7 to 10.0 times higher than that from 20 ml, with a factor of approximately 3.0 for the submicrometer size range.
FIG. 4 Comparison of fungal particles released from cultures grown on 5 or 20 ml of 2% MEA: (a) A. versicolor; (b) S. chartarum. Each data point presents the average of three repeated experiments. The error bars represent standard deviations calculated for each group.
After one week of incubation, 5 ml of 2% MEA cultures appeared to be drier than cultures grown on 20 ml. The increased release from these desiccated cultures may have been caused by reduced adhesion forces among fungal propagules and/or the presence of more brittle structures that readily become airborne when disturbed. Based on the data presented above, it was concluded that 5 ml of 2% MEA offered better circumstances for generating fungal fragments and spores and was therefore chosen for all sequential testing.
(1 → 3)-β-D-Glucan Content of Aerosolized Fragments and Spores
All the quality control samples of cleaned collection cups, blank filters, and extraction solutions were below the detection limit of the LAL assay (2.54 pg ml− 1). The median coefficient of variation (CV) was 10.3% (range: 6.6–14.9%) for the intraplate variability and 26.0% (6.0–30.7%) for the interplate variability, respectively. Spores on the after-filter were found only in one instance when the total number of particles measured with the OPC-1 was 1.35 × 10⁸. This value was close to the threshold value that we established for particle bounce.
presents the (1 → 3)-β-D-glucan concentration (ng m− 3 air) in the fragment and spore size fractions collected from A. versicolor and S. chartarum cultures. The overall (1 → 3)-β-D-glucan concentration ranged from 5.4 to 1.0 × 10³ ng m− 3 air in the fragment fraction and the spore fraction, respectively. For A. versicolor, the average (1 → 3)-β-D-glucan concentrations in the fragment and spore size fractions were 2.3 × 101 and 8.1 × 10² ng m− 3 air, respectively. For S. chartarum, the corresponding values were 8.6 and 2.4 × 10² ng m− 3 air. (1 → 3)-β-D-glucan concentration in the fragment-spore mixture size fraction was 4.6 × 101 ng m− 3 air for A. versicolor and 1.4 × 101 ng m− 3 air for S. chartarum (these results are not shown in but are used below when calculating the surface-area specific (1 → 3)-β-D-glucan content). These results suggest that intact spores were the main contributor to the airborne (1 → 3)-β-D-glucan released from A. versicolor and S. chartarum cultures, comprising 92.1% and 91.5% of total (1 → 3)-β-D-glucan concentration, respectively. Statistical analysis (t-test) confirmed that the (1 → 3)-β-D-glucan concentration was higher in the spore than in the fragment fraction for both fungal species (P < 0.05).
FIG. 5 (1 → 3)-β-D-glucan assay results of samples collected from A. versicolor and S. chartarum into fragment and spore size fractions. (a) (1 → 3)-β-D-glucan concentration in the air (ng m− 3 air). (b) Particle number concentration (particles m− 3 air) in the air. (c) Particle-specific (1 → 3)-β-D-glucan content (ng particle− 1). The histograms present the averages of three repeated experiments. The error bars represent the standard deviations calculated for each group.
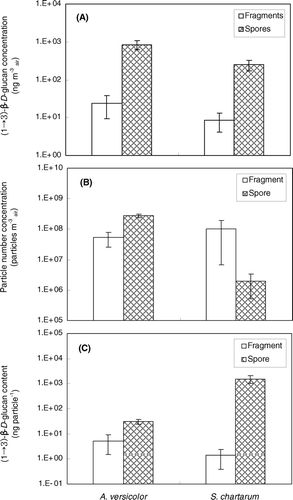
The (1 → 3)-β-D-glucan concentrations in fragment and spore size fractions of A. versicolor were 2.7 and 3.3 times higher than the corresponding fractions of S. chartarum. This could be explained by a higher particle aerosolization rate for A. versicolor compare to S. chartarum. This will result in the release of higher absolute particle numbers and consequently to higher (1 → 3)-β-D-glucan concentration.
shows the fungal particle number concentration (particles m− 3 air) released from A. versicolor and S. chartarum cultures. Total particle numbers were calculated as a function of the flow rate in each cyclone sampler and the sampling time. The results for both species were very similar for the fragment size fractions. However, the number of released particles in the spore fraction was 176-fold higher for A. versicolorthan for S. chartarum. These results confirm that the higher (1 → 3)-β-D-glucan concentration observed for A. versicolor are mainly caused by the higher aerosolization rate of A. versicolor particles in comparison to S. chartarum.
shows the particle-specific (1 → 3)-β-D-glucan contents (ng particle− 1) for fragment and spore size fractions. The particle-specific content ranged from 0.3 × 10− 7to 1.9 × 10− 4ng particle− 1 in all experiments. The lowest content was detected in the fragment fraction and the highest was found in the spore fraction. For A. versicolor, the average particle-specific (1 → 3)-β-D-glucan content was 5.2 × 10− 7ng particle− 1 in the fragment fraction and 3.0 × 10− 6ng particle− 1 in the spore fraction. The corresponding values for S. chartarum were 1.4 × 10− 7and 1.5 × 10− 4ng particle− 1, respectively. These results show that the particle-specific (1 → 3)-β-D-glucan content in the two lower size fractions of A. versicolor and S. chartarum are very similar and that S. chartarum spores contain about 50 times the amount of (1 → 3)-β-D-glucan found in A. versicolor spores. Thus, it appears that the particle-specific (1 → 3)-β-D-glucan content for spores may be dependent on the fungal species whereas the differences in the (1 → 3)-β-D-glucan content of fungal fragments from different fungi seem to be much smaller.
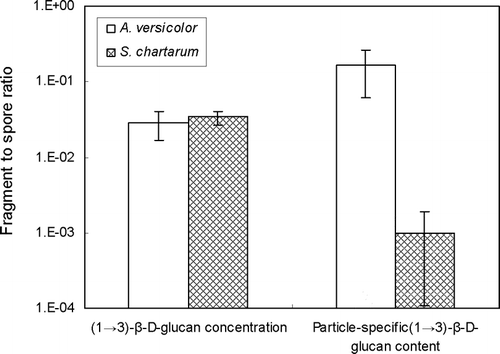
shows the ratio for the (1 → 3)-β-D-glucan concentration and particle-specific (1 → 3)-β-D-glucan content of fragments over spores for both fungal species. The concentration ratios ([ng f m− 3]÷ [ng s m− 3]) were 0.029 for A. versicolorand 0.034 for S. chartarum. However, particle-specific ratios ([ng f particle f − 1]÷ [ng s particle s − 1]) were much higher for A. versicolor(0.163) than for S. chartarum (0.001). This may be explained by the much higher particle-specific (1 → 3)-β-D-glucan content in S. chartarum spores, which has larger spores than A. versicolor. Our results are consistent with the findings of CitationFoto et al. (2004) who reported that the (1 → 3)-β-D-glucan content of S. chartarum spores was higher than that for A. versicolor spores.
FIG. 6 (1 → 3)-β-D-glucan ratios of fragment to spore size fractions. (1 → 3)-β-D-glucan concentration ratio means (ngfm− 3) ÷ (ngsm− 3) and particle-specific (1 → 3)-β-D-glucan content ratio means (ngf particlef − 1) ÷ (ngs particles − 1), where ngf = (1 → 3)-β-D-glucan mass in the fragment size fraction; ngs = (1 → 3)-β-D-glucan mass in the spore size fraction; particlef = particle number in the fragment size fraction; particles = particle number in the spore size fraction. The histograms present the averages of three repeated experiments. The error bars represent the standard deviations calculated for each group.
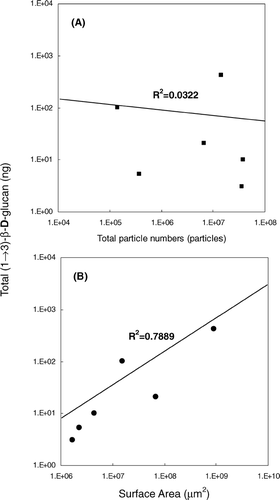
shows the estimated surface area-specific (1 → 3)-β-D-glucan content (ng μ m− 2) for each of the three size fractions and both fungal species. For A. versicolor, the values were 2.3 × 10− 6 for the fragment fraction, 0.3 × 10− 6 for the fragment-spore mixture size fraction, and 0.5 × 10− 6 ng μ m− 2 for the spore fraction. The corresponding values for S. chartarum were 1.9 × 10− 6, 2.3 × 10− 6, and 6.6 × 10− 6 ng μ m− 2, respectively. The highest value was estimated for S. chartarum spores. The surface area-specific (1 → 3)-β-D-glucan content differed less for the fragments than for the spores between both species. In a previous study, we showed that the size distributions of fragments released from A. versicolor and S. chartarum differed less from each other than those of spores (CitationCho et al. 2005). Linear regression analysis showed that there was a poor correlation between the total (1 → 3)-β-D-glucan content and the total particle number (). However, the total (1 → 3)-β-D-glucan content was significantly correlated with the combined surface area of all particles (P < 0.05; R2 = 0.7889) (). These results indicate that particle surface area rather than particle numbers may be a better indicator for determining the amount of total (1 → 3)-β-D-glucan in environmental samples.
TABLE 1 The (1 → 3)-β-D-glucan content per total surface area of fungal particles
FIG. 7 Results of linear regression analysis. (A) Total particle number (#) versus total (1 → 3)-β-D-glucan content per sample (ng). (B) Total surface area of particle (μm2) versus total (1 → 3)-β-D-glucan content per sample.
The Gucatell® LAL assay is not specific for only fungal glucan but will also account for (1 → 3)-β-D-glucan originating from pollen and some bacteria. However, as many epidemiological studies have reported that (1 → 3)-β-D-glucan itself has strong immuno-modulating effects (CitationRylander 1996; CitationThorn et al. 2001; CitationBeijer et al. 2003; Iossifova et al. 2007b), it appears to be an important parameter for exposure assessment by itself and not only as a surrogate for fungi. Other fungal components, such as ergosterol, extracellular polysaccharides (EPS), and fungal antigens could also be used as surrogate markers of fungi in the future.
SUMMARY AND CONCLUSION
In summary, we have described a new sampling system for the collection and analysis of fungal fragments. Laboratory evaluation showed that fragments can be successfully separated from spores if the total loading of the collection system is kept below a certain upper limit. The (1 → 3)-β-D-glucan assay proved to be sensitive enough for the analysis of all tested fungal aerosols including submicrometer-sized fungal fragments in size-fractioned samples.
The presented collection system has the potential to collect intact spores as well as a wide range of submicrometer-sized fungal fragments, and thus may provide more representative method for future exposure assessment.
Acknowledgments
This research was supported by The National Institute for Occupational Safety and Health (Contract No. Q116-040-N819-1904) to the University of Cincinnati. The use of product names does not imply their endorsement by the U.S. Department of Health and Human Services. The findings and conclusions in this report are those of the authors and do not necessarily represent the views of the Centers for Disease Control and Prevention.
Notes
a total particle number = particle concentration (particle cm− 3: data from CitationCho et al. (2005) ()) × flow rate × sampling time.
REFERENCES
- Aizenberg , V. , Reponen , T. , Grinshpun , S. A. and Willeke , K. 2000 . Performance of Air-O-Cell, Burkard, and Button Samplers for Total Enumeration of Airborne Spores . Am. Ind. Hyg. Assoc. , 61 : 855 – 864 .
- Baron , P. B. and Willeke , K. 2001 . Aerosol measurement: Principles, Techniques, and Applications. , 2nd Ed , 751 – 777 . New York : Wiley Interscience .
- Beijer , L. , Thorn , J. and Rylander , R. 2003 . Mould Exposure at Homes Relates to Inflammatory Markers in Blood . Eur. Respir. J. , 21 : 317 – 322 .
- Brasel , T. L. , Martin , J. M. , Carriker , C. G. , Wilson , S. C. and Straus , D. C. 2005 . Detection of Airborne Stachybotrys Chartarum Macrocyclic Trichothecene Mycotoxins on Particulates Smaller Than Conidia . Appl. Environ. Microbiol. , 71 : 7376 – 7388 .
- Chew , G. L. 2001 . Fungal Extracellular Polysaccharides, β -(1 → 3)-Glucans and Culturable Fungi in Repeated Sampling of House Dust . Indoor Air , 11 : 171 – 178 .
- Cho , S.-H. , Seo , S.-C. , Schmechel , D. , Grinshpun , S. A. and Reponen , T. 2005 . Aerodynamic Characteristic and Respiratory Deposition of Fungal Particles . Atmos. Environ. , 39 : 5454 – 5465 .
- Cho , S.-H. , Reponen , T. , LeMasters , G. , Levin , L. , Huang , J. , Meklin , T. , Ryan , P. , Villareal , M. and Bernstein , D. 2006 . Mold Damage in Homes and Wheezing in Infants . Ann. Allergy Asthma Immunol. , 97 : 539 – 545 .
- Cooley , J. D. , Wong , W. C. , Jumper , C. A. and Straus , D. C. 1998 . Correlation Between the Prevalence of Certain Fungi and Sick Building Syndrome . Occup. Environ. Med. , 55 : 579 – 584 .
- Douwes , J. , van der Sluis , B. , Doekes , G. , van Leusden , F. , Wijnands , L. , van Strien , R. , Verhoeff , A. and Brunekreef , B. 1999 . Fungal Extracellular Polysaccharides in House dust as a Marker for Exposure to Fungi Relations with Culturable Fungi, Reported Home Dampness, and Respiratory Symptoms . J. Allergy Clin. Immunol. , 103 : 494 – 500 .
- Douwes , J. 2005 . (1 → 3)-β-D-Glucan and Respiratory Health: A Review of the Scientific Evidence . Indoor Air , 15 : 160 – 169 .
- Fischer , R. and Kües , U. 2006 . “ Asexual Sporulation in Mycelial Fungi ” . In The Mycota I: Growth, Differentiation and Sexuality, , 2nd ed , 263 – 292 . Berlin : Springer-Verlag .
- Fogelmarker , B. and Rylander , R. 1997 . (1 → 3)-β-D-Glucan in Some Indoor Air Fungi . Indoor Built Environ. , 6 ( 5 ) : 291 – 294 .
- Foto , M. , Plett , J. , Berghout , J. and Miller , J. D. 2004 . Modification of the Limulus Amebocyte Lysate Assay for the Analysis of Glucan in Indoor Environments . Anal. Bioanal. Chem. , 379 : 156 – 162 .
- Górny , R. L. , Reponen , T. , Willeke , K. , Schmechel , D. , Robine , E. , Boissier , M. and Grinshpun , S. A. 2002 . Fungal Fragments as Indoor Air Biocontaminants . Appl. Environ. Microbiol. , 68 : 3522 – 3531 .
- Green , B. J. , Tovey , E. R. , Sercombe , J. K. , Blachere , F. M. , Beezhold , D. H. and Schmechel , D. 2006 . Airborne Fungal Fragments and Allergenicity . Medi. Mycology. , 44 ( 1 ) : 245 – 255 .
- Hyvärinen , A. , Meklin , T. , Vepsalainen , A. and Nevalainen , A. 2002 . Fungi and Actinobacteria in Moisture-Damaged Building Materials-Concentrations and Diversity . Int. Biodeterior. Biodegrad. , 49 ( 1 ) : 27 – 37 .
- Institute of Medicine . 2004 . Damp indoor spaces and health. , 183 – 269 . Washington, DC : National Academy of Science .
- Iossifova , Y. , Reponen , T. , Daines , M. , Crawford , C. and Hershey , G. K. 2007a . Comparison of EIA and LAL Analytical Methods for Detecting (1-3)-β-D-Glucan in Pure Fungal Cultures and in Home Dust Samples . Appl. Environ. Microb. , In press
- Iossoifova , Y. , Reponen , T. , Bernstein , D. I. , Levin , L. , Kalra , H. , Campo , P. , Villareal , M. , Lockey , J. , Khurana Hershey , G. K. and LeMasters , G. 2007b . House Dust (1 → 3)-β-D-Glucan and Wheezing in Infants . Allergy , 62 : 504 – 513 .
- Jarvis , B. B. , Sorenson , W. G. , Hintikka , E.-L. , Nikulin , M. , Zhou , Y. , Jiang , J. , Wang , S. , Hinkley , S. , Etzel , R. A. and Dearborn , D. 1998 . Study of Toxin Production by Isolates of Stachybotrys Chartarum and Memnoniella Echinata Isolated During a Study of Pulmonary Hemosiderosis in Infants . Appl. Environ. Microb. , 64 : 3620 – 3625 .
- Martinez , K. F. , Rao , C. Y. and Burton , N. C. 2004 . Exposure Assessment and Analysis for Biological Agents . Grana , 43 ( 4 ) : 193 – 208 .
- Meklin , T. , Husman , T. , Vepsäläinen , A. , Vahteristo , M. , Koivisto , J. , Halla-Aho , J. , Hyvärinen , A. , Moschandreas , D. and Nevalainen , A. 2002 . Indoor Air Microbes and Respiratory Symptoms of Children in Moisture Damaged and Reference Schools . Indoor Air , 12 : 175 – 183 .
- Rao , C. Y. , Burge , H. A. and Chang , J. C. 1996 . Review of Quantitative Standards and Guidelines for Fungi in Indoor Air . J. Air & Waste Manage. Assoc. , 46 : 899 – 908 .
- Rao , C. Y. , Cox-Ganser , J. M. , Chew , G. L. , Doekes , G. and White , S. 2004 . Use of Surrogate Markers of Biological Agents in Air and Settled Dust Samples to Evaluate a Water-Damaged Hospital . Indoor Air , 15 ( 9 ) : 89 – 97 .
- Reponen , T. 1995 . Aerodynamic Diameters and Respiratory Deposition Estimates of Viable Fungal Spores in Mold Problem Homes . Aerosol Sci. Technol. , 22 : 11 – 23 .
- Rylander , R. 1996 . Airway Responsiveness and Chest Symptoms After Inhalation of Endotoxin or (1 → 3)-β-D-glucan . Indoor Built Environ. , 5 : 106 – 111 .
- Salo , P. M. , Ming , Y. , Arbes , S. J. , Cohn , R. D. , Sever , M. , Muilenberg , M. , Burge , H. A. , London , S. J. and Zeldin , D. C. 2005 . Dustborne Alternaria Alternata Antigens in US Homes: Results from the National Survey of Lead and Allergens in Housing . J. Allergy Clin. Immunol. , 116 : 623 – 629 .
- Schmechel , D. , Gorny , R. L. , Simpson , J. , Reponen , P. , Grinshpun , T. S. A. and Lewis , D. M. 2003 . Limitations of Monoclonal Antibodies for Monitoring of Fungal Aerosols Using P. Brevicompactum as a Model Fungus . J. Immunol. Meth. , 283 : 235 – 245 .
- Sivasubramani , S. K. , Niemeier , R. T. , Reponen , T. and Grinshpun , S. A. 2004 . Fungal Spore Source Strength Tester: Laboratory Evaluation of a New Concept . Sci. Total Environ. , 329 : 75 – 86 .
- Spengler , J. , Neas , L. , Nakai , S. , Nakai , S. , Dockery , D. , Speizer , F. , Ware , J. and Raizenne , M. 1994 . Respiratory Symptoms and Housing Characteristics . Indoor Air , 4 : 72 – 82 .
- Thorn , J. , Beijer , L. and Rylander , R. 2001 . Effects After Inhalation of (1 → 3)-β-D-Glucan in Healthy Humans . Mediators of Inflamm. , 10 : 173 – 178 .
- Trunov , M. , Trakumas , S. , Willeke , K. , Grinshpun , S. A. and Reponen , T. 2001 . Collection of Bioaerosol Particles by Impaction: Effect of Fungal Spore Agglomeration and Bounce . Aerosol Sci. Technol. , 35 : 617 – 624 .
- Verhoeff , A. P. and Burge , H. A. 1997 . Health Risk Assessment of Fungi in Home Environments . Ann. Allergy Asthma Immunol. , 78 : 544 – 556 .
- Wang , Z. , Reponen , T. , Grinshpun , S. A. , Górny , R. L. and Willeke , K. 2001 . Effect of Sampling Time and Air Humidity on the Bioefficiency of Filter Samplers for Bioaerosol Collection . J. Aerosol Sci. , 32 : 661 – 674 .