Abstract
In this article, the potential of a thermophoretic sampling device to derive quantitative particle size distributions and number concentrations of aerosols based on microscopic single particle analysis is explored. For that purpose a plate-to-plate thermophoretic precipitator to collect ultrafine atmospheric particles for TEM (transmission electron microscopy) analysis has been calibrated and characterized. The representativeness of the samples has been verified in a series of experiments. Results show that, for particles with diameters of 15 nm to 300 nm, the precipitator's collection efficiency is independent of size, shape, and composition of the particles. Hence, its samples accurately represent the original aerosol.
A numerical model of thermophoretic deposition within the device has been developed and tailored to the specifications of the precipitator. The model has been used to derive the particle number density and size distribution of several calibration aerosols using the TEM analysis of the samples taken with the thermophoretic precipitator as input parameters. The results agree very well with the on-line measurements of the calibration aerosols. This work demonstrates that our thermophoretic sampling device can be used to derive quantitative particle size distributions and number concentrations of ultrafine particles based on microscopic single particle analysis.
1. INTRODUCTION
Ultrafine particles are one of the boon and bane of modern technology. On one hand, they play an important role in the development of nanotechnology; on the other hand, submicron particles originating from manufacturing and combustion processes significantly contribute to the pollution of the workplace and ambient atmosphere. Several studies address the possible adverse health effects of nano-sized particles (CitationLi et al. 2003; CitationOberdorster et al. 2004; CitationSeaton and Donaldson 2005). However, the mechanisms responsible for these adverse effects are still poorly understood due to limited knowledge of the physical and chemical characteristics that are responsible for these effects, as CitationHarrison and Yin (2000) point out highlighting the need for specialized sampling equipment.
Morphology, structure, and composition of ultrafine aerosol particles (diameter smaller than 100 nm) are frequently analyzed by means of transmission electron microscopy (TEM) (e.g., CitationMathis et al. 2004; CitationMaynard et al. 2004; CitationChen et al. 2005; CitationKu and Maynard 2005). For this purpose, particles need to be deposited on TEM support grids. Representative and artifact free sampling of ultrafine particles is, however, by no means trivial. Preferably, particles are deposited directly from the atmosphere onto the support film of TEM grids, which reduces the risk of potential artifacts related to sample preparation (CitationBerube et al. 1999).
The only viable deposition mechanisms for submicron particles are electrophoresis and thermophoresis, but only thermophoresis is virtually independent of particle size for particle diameters smaller than ∼150 nm (CitationBrock 1962). Electrophoresis can yield high sampling efficiencies, but the sampling substrates have to be electroconductive (CitationDixkens 1999). For thermophoresis, no such limitations apply, allowing the use of virtually any substrates that, thus, can be chosen according to analytical requirements.
A number of designs of thermophoretic samplers have been described in the literature (e.g., CitationMercer 1973). The two primary type are: (1) the hot-wire (e.g., CitationGreen and Watson 1935; CitationKasper 1982; CitationBang et al. 2003), and (2) plate-to-plate (e.g., CitationMaynard 1995; CitationTsai and Lu 1995; CitationGonzalez et al. 2005) design.
CitationMercer (1973) points out that thermophoretic precipitation is prone to non-uniform particle deposition that depends on both size and deposition efficiency. However, Mercer focused mainly on coarse particles (> 0.5 μ m). For ultrafine particles size selectivity is expected to be rather small (CitationBrock 1962). The non-uniform deposition efficiency (for ultrafine particles), on the other hand, is mainly due to fluid dynamics and non-ideal temperature fields and, therefore, cannot be avoided completely. For the quantitative evaluation (e.g., particle size distribution, number concentration) of thermophoretically collected aerosol samples by electron microscopy, it is imperative to be able to model (numerically) this non-uniformity. To our knowledge, no attempts have been made to date to calibrate sampling devices for ultrafine particles, or to calculate deposition patterns of such particles on TEM grids.
In this study a combination of a thermophoretic precipitator and a numerical model is described that allows the quantification of number concentrations and particle size distributions of ultrafine aerosols based exclusively on single particle analysis with electron microscopes.
2. DESIGN
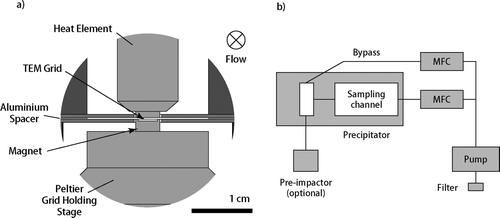
The most important element of a thermophoretic precipitator is the sampling channel ( & ). The width is 20 mm, and the length is 83 mm. The height can be adjusted using aluminum spacer sheets. For the present investigation, a channel height of 0.3 mm was chosen. The TEM grid is mounted in the middle of the floor of the sampling channel, using a weak cup magnet with 4 mm diameter which is flush with the channel base. To prevent the TEM grid from being lifted by the air flow, the magnet has a circular depression of 3.1 mm in diameter and of 0.1 mm in depth. To keep the TEM grid at a constant temperature, a Peltier element (thermoelectric cooler) (CitationRowe 2006) and a K-type thermocouple are incorporated into the grid holding stage directly below the magnet, as close to the TEM grid as possible. A heating element (4 mm in diameter) is placed in the middle, flush with the channel ceiling, and directly opposite to the sampling grid. To enable a stable temperature gradient the heating element is monitored with a K-type thermocouple and actively controlled.
FIG. 1 Exploded schematic cross section of the precipitator; (a) Along the center of the precipitator, following the flow. b: Across the center of the precipitator, perpendicular to the flow. (c) Top view of the Peltier Assembly with cover sheet, Aluminum spacer, and sealing.
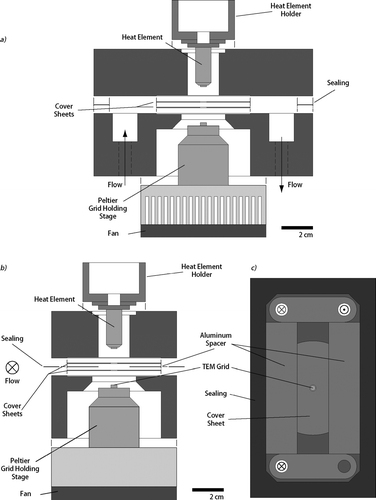
FIG. 2 Details of the precipitator's design. (a) Enlargement of the sample channel. (b) Schematic representation of the precipitator's periphery.
Both the heating and the Peltier elements are built into cavities of the sampling device to minimize distortions of the temperature field. In order to produce a smooth channel, the cavities are covered by a thin circular aluminum sheet with a concentric hole of 4.1 mm in diameter. The tips of the heating and cooling elements are only 4 mm in diameter and fit into the holes of the cover sheets to level up with the channel.
Since the sampling device is designed to collect environmental particles, the temperature of the Peltier grid holding stage is set to a standard temperature of 15°C to reduce the risk of condensation. To protect sensitive particles from damage, the standard temperature of the heating element is set to 135°C, resulting in a temperature gradient of 4 × 10⁵ K m−1.
To keep particle losses due to diffusion in the sampling lines up to the precipitator low, high flow speeds are required. To add flexibility to the sampling parameters, separate regulation of the flow rate inside the lines up to the precipitator and the sampling channel is an advantage. Accordingly, after the sampling line enters the device, it provides two flow paths (, ). Instead of forking the sampling line, the flow is led into a small chamber from which two exits exist. One leads to the sampling channel (having the same cross section) and the other is a bypass that goes directly to the pump. For standard operations, the flow rate in both the lines preceding the precipitator and in the sampling channel is set to 2 l/min. For aerosols with known size distributions or for measurements where information on the particle size distribution is of minor concern, the flow rate through the sampling channel can be reduced. Smaller flow rates do increase the sampling efficiency but at the cost of higher and size dependent losses. While the temperature gradient is being established, the flow through the sampling channel is stopped. Once the temperatures of the cooling and heating elements are stable, the sample flow is gradually diverted to the sampling channel according to the set flow speeds (keeping the total flow constant at 2 l/min).
The flexible structure of the sampling device presented in this study allows a variety of experimental setups. The sampler is controlled by a LabView program that regulates and logs both the sample flow through the device and the temperature gradient, while still allowing manual corrections. The parameters are kept within 3% of the initially set points, even for long sampling runs (verified up to one week sampling time).
3. NUMERICAL MODELING OF THE DEPOSITION PROPERTIES
CitationMaynard (1995) used a thermophoretic precipitator to collect ultrafine particles, and observed a non-uniform particle deposition pattern on the TEM grids. To derive particle number concentrations from such samples, a quantitative understanding of the deposition pattern of the particles on the grids is required. To satisfy this need, a model was developed to describe particle deposition on TEM grids. Because of the low Reynolds number of the present apparatus (Re = 220), the flow is expected to be laminar and incompressible (flow velocity in the channel at 2 l/min and standard temperature and pressure: < 10 m/s, Mach number < 0.03). Therefore, a parabolic flow profile () can be assumed. To simplify the model a linear temperature gradient limited to the space between the cooling and heating elements are assumed, resulting in cylindrical boundary conditions for the effective temperature field.
FIG. 3 Key elements of the numerical model. (a) Parabolic flow profile inside the sampling channel. At flow speeds of 2 l/min and a temperature gradient of 4· 105 K m− 1 only particles from the grey area are sampled. (b) Principle parameters of the model. Starting coordinates of the particles are randomly generated in the “starting area.”
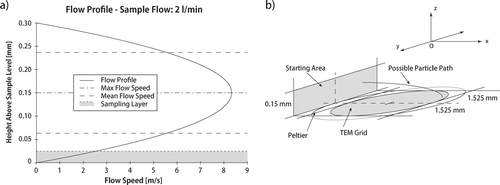
The model calculates the trajectories of particles within the sample channel above the Peltier stage, and records their deposition positions. Diffusional losses between the leading and the trailing edges of the cooling and heating elements (< 0.01%) are neglected. The particles are released in a rectangular area perpendicular to the flow path (). The starting coordinates for particles in the model are generated by a random function to produce a uniform distribution across the starting area. To account for the parabolic flow velocity profile that produces a non-uniform particle flow within the sample channel, each particle is weighted by a scaling factor scf (Equation [1]). The scf sets the starting parameters of the model particle in relation to the average flow speed and the channel height and is, therefore, a measure for the non-uniform particle flux through the sampling channel due to the flow profile. The scf is a function of the initial height of the particle above the bottom of the sampling channel z 0, its initial velocity v(z 0)—according to Equation (Equation2)—the total flow through the sampling channel Q (2000 cm3 min− 1), the width w c (2 cm), and the total height h c (0.03 cm) of the channel.
The particle velocity v(z) parallel to the sample flow, at any given point, is calculated according to Equation (Equation2) (CitationPanton 2005).
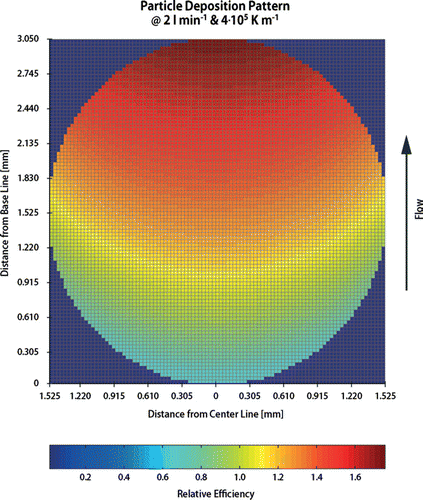
The results of the model calculations shown in , indicate that, on the trailing edge of the TEM grids, more particles are deposited than on the leading edge (for conditions where the height of the “collected layer” is less than, or equal to half the channel height). This is a consequence of the parabolic flow profile that produces an increasing particle flux towards the middle of the sampling channel. Because the thermophoretic migration velocity is constant, particles deposited at the trailing edge of the grid originate from higher above the base of the sampling channel and, therefore, from a region with higher particle flux than particles deposited at the leading edge. However, on the central section of the grid, which is used for TEM analysis, particle deposition is rather constant (±10%). Accordingly, the variation in particle deposition efficiency across the central section gives an error margin for the results gained from the samples. Concerning diffusion losses up to the grid, for particle diameters > 15 nm losses are < 1% and are well covered by said error margin of ± 10%.
FIG. 4 Deposition pattern as calculated by the model based on particle trajectories. Colors indicate the local deposition efficiency of a respective matrix cell relative to the average of the grid. The curved shape of areas with similar deposition efficiency is due to the circular geometry of the cold and hot plate. The deposition gradient is a consequence of the parabolic velocity profile.
According to the model, the following sampling times are required in order to get a sample suitable for TEM analysis (0.5% coverage of the grid at 2 l min−1 and 4 × 10⁵ K m− 1): 10 minutes at a heavily polluted working environment (5 × 10⁵ particles per cm3), 90 minutes at an urban background site (5 × 10⁴ particles per cm3), and 1 day at a clean background site (3· 103 particles per cm3). Therefore, the time resolution of the precipitator depends on the particle concentrations.
4. EXPERIMENTS AND RESULTS
To derive quantitative particle number concentrations and particle size distributions from the measurements of particles deposited on a TEM grid, the particle deposition on the grid must to be homogeneous and independent of particle size, shape, or composition. If that is not the case, calibration needs to account for the inhomogeneous deposition patterns.
According to the theory, thermophoretic migration velocities are independent of particle composition and shape. This is strictly applicable for particles in the free molecular regime and, as an approximation, up to a few 100 nm (CitationBrock 1962).
A series of experiments with polydisperse and monodisperse Ag aerosols were conducted to test the theoretical predictions, and to experimentally determine the sampling characteristics of the thermophoretic sampling device. The experimental systems are described in (a more detailed description of an essentially identical setup is given (e.g., by CitationKu and Maynard 2006)).
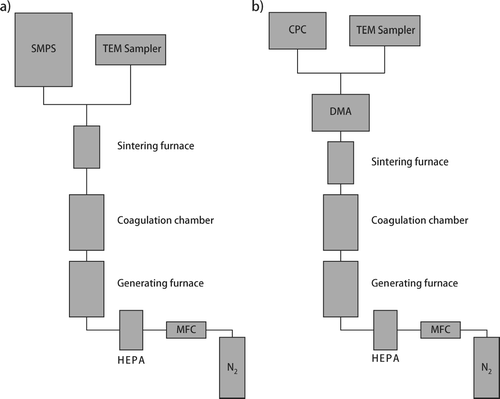
FIG. 5 Schematic representation of the facility for generating Ag aerosols. (a) Setup for polydisperse aerosols. SMPS: scanning mobility particle sizer; MFC: mass flow controller. (b) Setup for monodisperse aerosols. DMA: dynamic mobility analyzer; CPC: condensation particle counter.
Particles were analyzed with an SEM (Scanning-Electron Microscope, FEI, XL30 FEG) and with a TEM (Philips, CM30, source LaB6). Size distributions and number concentrations were derived from images using image analysis (image analysis) tools (Adobe Photoshop CS).
4.1. Polydisperse Ag Aerosols
In a first series of experiments, Ag aerosols with modes at 45 nm and 90 nm, respectively, were generated () and sampled on carbon coated TEM grids. The size distribution of the particles was recorded online with an SMPS system (TSI 3080 Platform with 3081 differential mobility analyzer and 3025 condensation particle counter). A series of 81 TEM images were taken from the centre section of each of the grids, and a particle size distribution was derived from these images using image analysis. To derive the absolute particle number concentrations in the sampled air, the particle numbers obtained from image analysis were corrected with the modeled (size independent) deposition efficiency. In these size distributions are compared with the ones measured with the SMPS for the modes at 45 nm and 90 nm.
FIG. 6 Quantitative comparison of particle size distributions measured by the SMPS and calculated from TEM/image analysis using the described model. The black lines represent the SMPS scans, the grey lines the TEM analysis and the black circles represent the Gaussian fit of the TEM/image analysis data. The particle number concentration of the aerosol determined by TEM image analysis in combination with the model lies within 10% of the SMPS results.
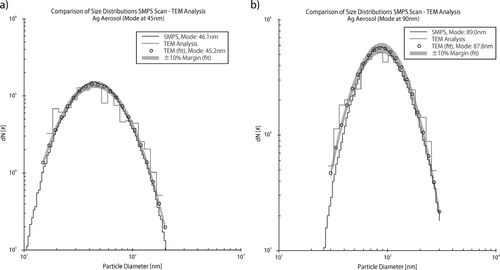
The black lines represent the particle size distribution of the Ag aerosol determined with the SMPS and the grey lines represent the results of the corrected TEM image analysis. The black circles depict the Gaussian fit of the TEM image analysis results. The comparison of the size distributions determined by SMPS and TEM image analysis are in excellent agreement concerning modes as well as absolute particle numbers. For the Ag aerosol with mode at 46.1 nm (SMPS, 4.9 × 10⁶ particles per cm3) the TEM image analysis results in a mode at 45.2 nm (5.3 × 10⁶ particles per cm3) while for the Ag aerosol with mode at 89.0 nm (SMPS, 1.8 × 10⁶ ppcm3) the TEM image analysis results in a mode at 87.8 nm (1.9 × 10⁶ ppcm3).
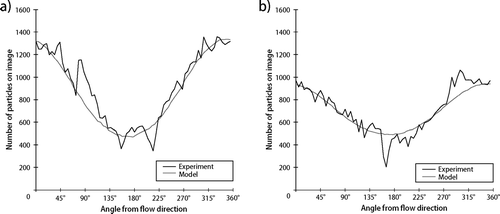
To further validate the model, two additional experiments (Ag, 45 nm) were conducted using different temperature gradients (4 × 10⁵ K m− 1 and 3.3 × 10⁵ K m− 1). A series of 71 SEM micrographs around a circle of approximately 1.6 mm in diameter were recorded on each of these two TEM grids. The SEM was chosen as it is equipped with a fully automated stage which allows to precisely locate the position of the micrographs on the TEM grid. The numbers of particles on the micrographs were then determined by image analysis. A lower size limit of 25 nm was chosen for the Ag-particles because smaller particles cannot be detected reliably using our analytical setup. Although the mode of the size distribution is at 45 nm a significant number of particles are smaller than 25 nm. Thus, the particle number detected by image analysis is too low. However, because all images were treated exactly the same way, it affects only the absolute number of particles, the distribution pattern remains the same.
shows the comparison between results of the SEM image analysis (black lines) and the model calculations (grey lines). represents the sample taken at a gradient of 4 × 10⁵ K m− 1 and of 3.3 × 10⁵ K m− 1, respectively. Again, the comparisons of the modeled and experimental data are in very good agreement.
FIG. 7 Comparison of the calculated and measured particle deposition pattern using polydisperse Ag aerosols. The sample for Figure (a) was taken with a temperature gradient of 4· 105 K m−1 and the sample for Figure (b) with a temperature gradient of 3.3· 105 K m−1.
4.2. Monodisperse Ag Aerosols
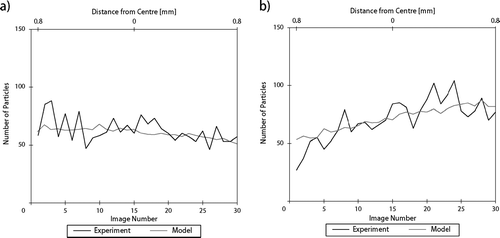
In a second series of experiments, monodisperse Ag aerosols with sizes of 40 nm and 80 nm, respectively, were generated () and sampled (separately) on carbon coated TEM grids. Thirty micrographs along a rim to rim transect through the center of the TEM grid of each sample were taken with an SEM. The number of deposited particles was determined using image analysis. In contrast to the experiment shown in , determination of absolute particle numbers was possible due to the monodisperse aerosols with particle sizes larger than the previously determined threshold for SEM image analysis of 25 nm. Based on particle number concentrations measured by the CPC (TSI Model 3025), the model was used to calculate the number of particles deposited on the TEM grid. The results can then be compared directly with the results from the SEM image analysis.
compares the calculated (grey line) with the measured (black line) particle numbers in an experiment with 80 nm Ag particles () and one with 40 nm Ag particles (). The close correspondence of experimental and modeled results shows that our model can reproduce the observed deposition pattern as well as the absolute particle number concentration.
FIG. 8 Quantitative comparison of calculated and measured particle numbers from monodisperse Ag aerosols (particle diameters a: 80 nm; b: 40 nm). The micrographs for particle counting were taken along a transect.
5. DISCUSSION AND CONCLUSIONS
The experiments reported in this article have shown that the sampling efficiency of the thermophoretic sampling device described in this study is independent of particle size between 15 nm and 300 nm, in good agreement with the theory and with the results obtained by CitationMesserer et al. (2003) who studied the thermophoretic deposition of soot particles. Furthermore, thermophoresis is independent of particle shape and composition (in the size range given) and, thus, enables representative sampling of atmospheric ultrafine particles.
Particle deposition in the central area of the TEM grids (concentric area of approx. 1 mm in diameter) is homogeneous within ± 10%. However, on larger scales, larger variations in particle deposition efficiency occur. This is due to the parabolic flow profile resulting in a higher particle flux in the center of the channel than near the walls (), and the circular temperature field. The numerical model developed for the precipitator takes these effects into account, and is capable of calculating the particle deposition pattern on the entire area of the grids ().
Using our model, quantitative particle number concentrations can be estimated from measurements made anywhere on the TEM grids, as long as the area of interest can be localized relative to the sample flow in the thermophoretic sampling device. This can easily be achieved by using oriented TEM grids. Calibration experiments showed that particle size distributions and particle number concentrations derived from image analysis combined with deposition coefficients extracted from our model agree very well with SMPS measurements.
This thermophoretic precipitator thus makes it possible to quantify the number concentration of particles in the size range of 15–300 nm. The tools used for the counting procedure, e.g., SEM and TEM, make it possible to analyze the morphology, crystallography, and chemical composition of each particle, e.g., it is possible, in the nanosize range, to determine variations of the latter physico-chemical parameters as a function of size. In addition, our model serves as a useful tool for calculation of the sampling time needed to get suitable TEM samples under given circumstances and, therefore, allows optimizing sampling parameters.
Although only TEM and SEM were used for the analyses in this study, the device is not limited to the use of TEM grids as substrates. While built for thin (< 0.1 mm) and magnetic substrates, minor modifications to the mounting system enable the use of other materials, such as gold foil, Si wafer, mica, or Si3N4 windows, for sampling. Thus, particles can also be investigated using analytical techniques such as atomic force microscopy (AFM) or scanning transmission x-ray microscopy (STXM).
Acknowledgments
This project was supported by SILAG and the Foundation for Pneumoconiosis-Research. We thank Martin Fierz of the University for Applied Sciences of Northwestern Switzerland for providing us with the facilities for producing the Ag aerosols necessary for calibrating the sampling device.
6. REFERENCES
- Bang , J. J. , Trillo , E. A. and Murr , L. E. 2003 . Utilization of Selected Area Electron Diffraction Patterns for Characterization of Air Submicron Particulate Matter Collected by a Thermophoretic Precipitator . J. Air Waste Manage. Assoc. , 53 : 227 – 236 .
- Berube , K. A. , Jones , T. P. , Williamson , B. J. , Winters , C. , Morgan , A. J. and Richards , R. J. 1999 . Physicochemical Characterisation of Diesel Exhaust Particles: Factors for Assessing Biological Activity . Atmos. Environ. , 33 : 1599 – 1614 .
- Brock , J. R. 1962 . Theory of Thermal Forces Acting on Aerosol Particles . J. Colloid Sci. , 17 : 768 – 780 .
- Chen , Y. Z. , Shah , N. , Huggins , F. E. and Huffman , G. P. 2005 . Transmission Electron Microscopy Investigation of Ultrafine Coal Fly Ash Particles . Environ. Sci. Technol. , 39 : 1144 – 1151 .
- Dixkens , J. A. F. H. 1999 . Development of an Electrostatic Precipitator for Off-Line Particle Analysis . Aerosol Sci. Technol. , 30 : 438 – 453 .
- Gonzalez , D. , Nasibulin , A. G. , Baklanov , A. M. , Shandakov , S. D. , Brown , D. P. , Queipo , P. and Kauppinen , E. I. 2005 . A New Thermophoretic Precipitator for Collection of Nanometer-Sized Aerosol Particles . Aerosol Sci. Technol. , 39 : 1064 – 1071 .
- Green , H. L. and Watson , H. H. 1935 . Medical Research Council Special Report Series 199
- Harrison , R. M. and Yin , J. X. 2000 . Particulate Matter in the Atmosphere: Which Particle Properties are Important for its Effects on Health? . Sci. Total Environ. , 249 : 85 – 101 .
- Kasper , G. 1982 . Hot-Wire Thermal Precipitator with Low Inlet Losses and Low Size Selectivity . Rev. Sci. Instrum. , 53 : 79 – 82 .
- Ku , B. K. and Maynard , A. D. 2005 . Comparing Aerosol Surface-Area Measurements of Monodisperse Ultrafine Silver Agglomerates by Mobility Analysis, Transmission Electron Microscopy and Diffusion Charging . J. Aerosol. Sci. , 36 : 1108 – 1124 .
- Ku , B. K. and Maynard , A. D. 2006 . Generation and Investigation of Airborne Silver Nanoparticles with Specific Size and Morphology by Homogeneous Nucleation, Coagulation and Sintering . J. Aerosol. Sci. , 37 : 452 – 470 .
- Li , N. , Sioutas , C. , Cho , A. , Schmitz , D. , Misra , C. , Sempf , J. , Wang , M. Y. , Oberley , T. , Froines , J. and Nel , A. 2003 . Ultrafine Particulate Pollutants Induce Oxidative Stress and Mitochondrial Damage . Environ. Health Perspect. , 111 : 455 – 460 .
- Mathis , U. , Kaegi , R. , Mohr , M. and Zenobi , R. 2004 . TEM Analysis of Volatile Nanoparticles from Particle Trap Equipped Diesel and Direct-Injection Spark-Ignition Vehicles . Atmos. Environ. , 38 : 4347 – 4355 .
- Maynard , A. D. 1995 . The Development of a New Thermophoretic Precipitator for Scanning-Transmission Electron-Microscope Analysis of Ultrafine Aerosol-Particles . Aerosol Sci. Technol. , 23 : 521 – 533 .
- Maynard , A. D. , Ito , Y. , Arslan , I. , Zimmer , A. T. , Browning , N. , Nicholls , A. and Nicholls , A. 2004 . Examining Elemental Surface Enrichment in Ultrafine Aerosol particles Using Analytical Scanning Transmission Electron Microscopy . Aerosol Sci. Technol. , 38 : 365 – 381 .
- Mercer , T. T. 1973 . Aerosol Technology in Hazard Evaluation , New York : Academic Press Inc. .
- Messerer , A. , Niessner , R. and Poschl , U. 2003 . Thermophoretic Deposition of Soot Aerosol Particles Under Experimental Conditions Relevant for Modem Diesel Engine Exhaust Gas Systems . J. Aerosol. Sci. , 34 : 1009 – 1021 .
- Oberdorster , G. , Sharp , Z. , Atudorei , V. , Elder , A. , Gelein , R. , Kreyling , W. and Cox , C. 2004 . Translocation of Inhaled Ultrafine Particles to the Brain . Inhal. Toxicol. , 16 : 437 – 445 .
- Panton , R. L. 2005 . Incompressible Flow , New York : John Wiley & Sons, Inc. .
- Rowe , D. M. , ed. 2006 . Thermoelectrics Handbook: Macro to Nano , Boca Raton : Taylor & Francis Group .
- Seaton , A. and Donaldson , K. 2005 . Nanoscience, Nanotoxicology, and the Need to Think Small . Lancet , 365 : 923 – 924 .
- Talbot , L. , Cheng , R. K. , Scheffer , R. W. and Willis , D. R. 1980 . Thermophoresis of Particles in a Heated Boundary Layer . J. Fluid Mech. , 101 : 737 – 758 .
- Tsai , C. J. and Lu , H. C. 1995 . Design And Evaluation Of A Plate-To-Plate Thermophoretic Precipitator . Aerosol Sci. Technol. , 22 : 172 – 180 .