Abstract
The morphological characterization of particles during the Pittsburgh Air Quality Study (PAQS) suggests that particle shape and physical state depends on their acidity. The aerosol shape parameters measured by Computer-Controlled Scanning Electron Microscopy (CCSEM) are statistically different in periods when atmospheric particles are neutral and when they are acidic. High concentrations of particles smaller than 500 nm with high sulfur content and liquid appearance or signs of a previous liquid state before partial or total recrystallization are present on filters collected in days with high aerosol acidity. By contrast, in winter and summer periods in which the aerosol was neutral, the shape parameter values are similar and suggest that the particles have been dried out. These direct observations support the hypothesis that during summer acidic periods in the Eastern United States the particles may contain some water even at low relative humidity both in the atmosphere and on filters.
1. INTRODUCTION
Physicochemical properties of the fine fraction of atmospheric aerosols (particulate matter below 2.5 μ m, PM2.5) such as size distribution, chemical composition, mixing state, and morphology vary dramatically as a function of space and time. This heterogeneity makes the dynamics of PM2.5 a complex subject and introduces significant uncertainties. Understanding the behavior and properties of atmospheric PM is important due to their influence on human health (CitationDockery et al. 1993; CitationPope et al. 2002), visibility impairment, and the energy balance of our planet (CitationSeinfeld and Pandis 1998).
Atmospheric particle morphology remains one of their least understood properties. The development of Computer Controlled Scanning Electron Microscopy (CCSEM) in the last two decades, has allowed the measurement of size, elemental composition, and morphological parameters of thousands of particles in a time scale of hours (CitationCassucio et al. 1983; CitationSchwoeble et al. 1988; CitationMamane et al. 2001; CitationLaskin and Cowin 2001; CitationConner et al. 2001). Microscopy studies have provided valuable information about the sources of atmospheric particles (CitationMamane et al. 1980), their mixing state (CitationDougle et al. 1998; CitationHasegawa and Ohta 2002; CitationJohnson et al. 2005), aerosol acidity (CitationLevin et al. 1990; CitationPardess et al. 1992; CitationGanor et al. 1993, CitationGanor 1999), hygroscopic behavior (CitationPósfai et al. 1998; CitationEbert et al. 2002; CitationWittmaack 2002; CitationLaskin et al. 2002), and heterogeneous chemical reactions (CitationKrueger et al. 2003; CitationLaskin et al. 2005). Scanning electron microscopy/energy-dispersive X-ray spectroscopy (SEM/EDX) techniques have been successfully applied in the determination of particle sulfur content (CitationPardess et al. 1992; CitationGanor et al. 1993; CitationGanor 1999). Atomic force microscopy (AFM) is also a useful tool for the analysis of the shape of atmospheric particles. Köllensperger et al. (1999) used an AFM to investigate the response of aerosols exposed to relative humidity. CitationWittmack and Strigl (2005) successfully applied the technique to identify aqueous metastable aerosols by calculating and comparing particle height to diameter ratios.
An interesting finding of the Pittsburgh Air Quality Study (PAQS) was that, during the summer, aerosol contained water even at relative humidity (RH) below 30% (CitationKhlystov et al. 2005). In winter, aerosols were neutral and effloresced when the relative humidity was lower than approximately 60%. During the spring months, the aerosol water had a transitional behavior between these two states. CitationKhlystov et al. (2005) hypothesized that the summer aerosol was acidic and retained water at low RH. Even if the above explanation is reasonable, there was no direct evidence supporting the acidity-water link for individual particles.
The purpose of this work is to study the relationship between individual particle morphology in the fine range (PM2.5), and the estimated aerosol acidity taking advantage of the PAQS samples and results. CCSEM is used to quantitatively compare particle morphology during acidic and neutral periods in both summer and winter samples. CCSEM is also used to investigate the relationship between individual particle sulfur content and morphology as a function of particle size. Finally, the complementary High Resolution SEM (HRSEM) technique is used to link the previous results to individual particle morphology.
2. METHODS
2.1. Sample Collection and Preparation
The main PAQS site was located in Schenley Park, at the top of a hill close to the Carnegie Mellon University campus approximately 6 km east of downtown Pittsburgh. More details about the location and characteristics of the site can be found in CitationWittig et al. (2004a). Daily samples for Scanning Electron Microscopy (SEM) analysis were collected on polycarbonate filters (PC filters, Nucleopore®, 400 nm pore size) during the summer of 2001 and the winter of 2002. After collection, samples were placed in sealed dishes and stored in a refrigerator until analysis. The first samples were analyzed in 2002. All the samples were analyzed in 2004 and reanalyzed in 2005. Potential changes in some of the samples were evaluated again in 2006. The results from the reanalyzed samples were consistent with the original findings. A small section of the filter was mounted on a SEM stub and was carbon coated to dissipate charge during the analysis. Some of the samples were Au/Pd coated for high resolution analysis. A total of 16 daily samples from July and August of 2001 and January of 2002 were selected based on the estimated aerosol acidity (CitationTakahama et al. 2006): 10 summer samples, including 5 from days when the aerosol was acidic and 5 when the aerosol was neutral, and 6 winter samples when the aerosol was neutral (). The H+ concentration in the aerosol was estimated using the thermodynamic Gibbs Free Energy Minimization (GFEMN) model (CitationAnsari and Pandis 1999) using as input 1–2 hour semi-continuous measurements of sulfate, total nitric acid, and total ammonia () following the approach of CitationTakahama et al. (2006). The samples were analyzed using Computer-Controlled Scanning Electron Microscopy (CCSEM) and High Resolution Scanning Electron Microscopy (HRSEM). CCSEM provided the quantitative data while HRSEM gave detailed information about particle morphology and texture.
TABLE 1 Summary of PAQS ambient concentrations for CCSEM analysis of the selected samples for CCSEM analysis (OC, organic carbon; EC, elemental carbon)
2.2. Instrumentation
The Personal SEM® (ASPEX PSEM®) is an automated SEM system. It is equipped with secondary and backscattered electron detectors and a thin-window, energy-dispersive X-ray detector that enables X-ray detection of carbon and heavier elements by Electron Dispersive Spectroscopy (EDS). The system software, ZepRun®, allows automatic processing of both morphological and chemical information of individual particles (CitationLee et al. 1979; CitationLee and Kerry 1980). This instrument was used for CCSEM analysis.
A FEI® Sirion 400 equipped with a Field Emission Gun and coupled with EDX microanalysis spectrometer (EDAX Inc.) was used for manual analysis of particle morphology. Morphological parameters of high resolution images were measured with programmed macros in Aphelion® (ADCIS). This instrument was used for the HRSEM analysis.
2.3. CCSEM Analysis
The accelerating voltage used was 20 kV, the electron beam was adjusted to 32–33% (spot size in PSEM), and the working distance was approximately 17 mm, which is considered as optimal for X-ray acquisition with PSEM (CitationConner et al. 2001). An 800-fold magnification was used to detect particles between 1 and 2.5 μ m, and 1600-fold for particles between 0.2 and 1.0 μ m. The magnification for individual particle images was varied based on the size of the particle. A minimum number of 2000 particles per sample were analyzed. Filters were manually inspected with SEM before each run to ensure the particle loading distribution was suitable for the automatic analysis and were not contaminated during handling and preparation.
ZepRun® software automatically locates and separates the particle from the filter by digital image processing. This process is usually known as segmentation and is based on the difference in brightness between the particle and the filter. The brightness level that discriminates feature from background is defined as the threshold. A different threshold value must be selected for each magnification (and sample) because brightness conditions usually vary with magnification scale and sample. Particle segmentation was performed in the electron backscattered mode, and the thresholds were adjusted for each sample and magnification to maximize the number of segmented particles. After particle segmentation, ZepRun® automatically calculated the center of mass, area, perimeter, shape parameters, and chemical composition (CitationMamane et al. 2001).
2.3.1. Particle Size and Shape Parameters
In the characterization of physical properties of atmospheric particles by analysis of their 2-D images, the lack of information from the third dimension makes the measurements uncertain. It is usually assumed that the particle lies on its longest projection, also called the plane of maximum stability (CitationDavies 1979). This assumption usually leads to particle size overestimation, especially in particles with certain physical characteristics, as layered flat clays, or droplets that spread out on the filter. Particle diameter in the work is defined as D
p
= 2 · ![]() (Allen 1990; CitationHinds 1999). The diameter measured by microscopy is usually referred to as the geometric (CitationWeiss et al. 1992; CitationReid et al. 1994) or physical diameter (CitationConner et al. 2001). This geometric diameter will be used throughout the rest of the article.
(Allen 1990; CitationHinds 1999). The diameter measured by microscopy is usually referred to as the geometric (CitationWeiss et al. 1992; CitationReid et al. 1994) or physical diameter (CitationConner et al. 2001). This geometric diameter will be used throughout the rest of the article.
Two dimensionless shape parameters, Sp 1 and Sp 2, will be used in this study to quantitatively characterize the individual particle morphology. The first one is defined as:
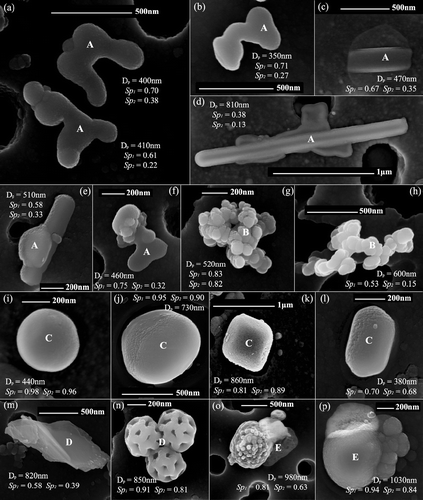
FIG. 1 Examples of the morphological groups for HRSEM analysis: (a–f) group A, particles with signs of a primary liquid state: (a–b) droplet-like, (c–e) needle-like, and (f) others; (g–h) group B, soot-like; (i–l) group C, regular-shaped particles; (m–n) group D, minerals, biogenic and others; and (o–p), group E, mixed particles. Particle geometric diameter, shape parameter values and HRSEM type also shown in the pictures.
The second shape parameter is:
The estimated error for the calculated shape factors was around 5% for the 200–500 nm particles. For larger particles, the errors were even smaller. The reproducibility was estimated by measuring Sp 1 and Sp 2 in particles of different shapes and sizes multiple times and the corresponding discrepancy was generally below 1%. Generally, particles with more regular shapes are associated with smaller errors than rougher ones. During CCSEM analysis, the highest errors are associated to bad focusing, so that, particle images were reviewed during and after the runs. Runs with bad quality images were repeated.
2.3.2. Chemical Analysis
After sizing, the electron beam was targeted at the center of each selected particle to perform the X-ray analysis. Electron Dispersive Spectrometry (EDS) was used to estimate the elemental composition of each particle in a semi-quantitative method based on its X-ray spectrum produced by the electron beam-particle interaction. The particle, excited by the electron bombardment, emits a number of electrons (X-ray counts) at certain energy (keV) producing the corresponding spectrum (counts vs. energy). Each element produces a characteristic X-ray peak that is used for its identification. The number of X-ray counts for each identified element in the spectrum divided by the total number of X-ray counts gives its x-ray intensity response. The PSEM detected and measured the concentration of 18 elements at 20 kV (C, O, Na, Mg, Al, Si, P, S, Cl, K, Ca, Ti, Cr, Mn, Fe, Zn, Ba, Pb) that were automatically stored together with the total X-ray counts. Compounds consisting of chemical elements with low atomic number, like organics, can give a weak response, which results in a low number of electron counts and potentially important errors, especially in smaller particle sizes. As this study is focused on the fine particles, several manual checks of the threshold and PSEM conditions during the CCSEM analysis were performed.
For the purposes of this work, particles have been grouped based on their relative sulfur X-ray intensity response (S-counts/total counts) in four different groups:
-
Very low S: Particles with sulfur response below 2% of the total number of counts have almost negligible sulfur content.
-
Low S: Particles with sulfur response between 2–11%.
-
Intermediate S: Particles with sulfur response between 12–22%.
-
High S: Particles with sulfur response above 22%.
The numbers are not quite arbitrary. Given that the particles have a maximum sulfur content of roughly 33% (corresponding to pure sulfuric acid) the 0–33% region was separated in three sub-regions with cut-offs of 11% and 22%. A fourth (less than 2% S) region was arbitrarily selected for the very low sulfur particles.
Micron and submicron particles were analyzed separately to avoid errors related to the size of the particles. First, the microscope scanned the filter measuring the larger (above 1 μ m) particles with magnification, thresholds, and background corrections suitable for this size range. After finishing this step, we performed the measurements for the submicron particles using a new set of parameters including magnification and thresholds for particle detection.
2.4. HRSEM Analysis
For the high resolution images, the working distance of the FEI® Sirion 400 was set at 3 mm, with a 5 kV of accelerating voltage and 3 nm of spot size. The characterization was mainly focused on the particle solid or liquid appearance in sizes below 1 μ m. To achieve this, five morphological groups were defined, and their relative abundance (< 5%, 5–15%, 15–30%, 30–50% 50–70%, 70–90%, > 90%) was estimated based on about 250 particles per sample. Shape parameters, Sp 1 and Sp 2, of particles from each morphological group are presented in .
The morphological groups are defined for the purposes of this work in the following sections.
a. Group A.
This group comprises all the particles with low or very low shape parameters: Sp 1 ≤ 0.75 and Sp 2 ≤ 0.40 that presented signs of a liquid state from when they were deposited on the filter (–). This group includes particles with droplet appearance and no sign of previous crystallization (–), and rectangular elongated particles with the presence of a surrounding residue indicating a possible previous liquid state (–), or a liquid droplet joined with the elongated crystal (–). Droplet-like particles tend to adopt irregular shapes generally associated with low Sp 1 and Sp 2 values, below 0.7 and 0.4, respectively. Their irregular shapes are probably the result of their impaction on the filter and subsequent coalescence during sampling. This particle type was stable during the analysis. The rectangular elongated particles are unstable when irradiated with the electron beam frequently changing appearance during imaging and the electron beam often created a hole in the particle during X-ray analysis. The crystallization process of this particle type from an acidic solution forming elongated sulfate crystals (ammonium sulfate and bisulfate, calcium sulfate, and others) has been described in previous electron microscopy studies (CitationDingle and Joshi 1974; CitationGanor et al. 1993; CitationGanor 1999). Mixtures of these particles with other morphologies have been also observed (), generally have low shape parameters and rarely present alterations after the HRSEM analysis.
b. Group B, Soot-Like
These are particles with the typical soot aggregate shape comprised of spherical primitive individual particles (–). This morphology is usually associated with combustion sources (CitationKatrinak et al. 1992); nevertheless, similar structures have been found in smog chamber aerosol generation from organic products of non combustion processes. Shape parameters values of this particle type are variable, and depend on the agglomerate properties such as the number of individual particles and disposition. An example of compact agglomerates with high Sp 1 and Sp 2 values is shown in and chain aggregates with very low Sp 1 and Sp 2 values can be seen in .
c. Group C, Regular-Shaped.
This group comprises soft particles with geometric forms: mostly spherical (, j), quadrangular (), or hexagonal (). Spherical particles are round shaped with swollen appearance and high Sp 1 and Sp 2 values, generally above 0.90. Quadrangular particles have shape parameter values between 0.8–0.9, and hexagonal particles usually have intermediate Sp 1 and Sp 2 values (around 0.7). These particle types are quite stable below the microscope and sometimes are surrounded by a liquid layer. The chemical composition of particles in group C was quite variable with the particles falling into all of the S contents groups. Spherical particles were often aluminosilicates, processed calcium sulfate, or carbonaceous particles.
d. Group D, Minerals, Biogenic, and Other Particles.
This group includes particles that do not belong to any of the previous groups. They are often mineral () or biogenic () particles. They can have variable widely varying Sp 1 and Sp 2 values, from very low (clay minerals with platelet shape) to high values (biogenic spores).
e. Group E, Mixed Type.
This group includes particles that have more than one recognizable morphology type from the previous groups, excluding group A particles ( and p). Shape parameters depend then on the combination of particle types, so they are quite variable.
3. RESULTS
3.1. Individual Particle Morphology and Aerosol Acidity
Results of sample CCSEM shape parameters, Sp 1 and Sp 2, mean values, standard deviation of the mean, and estimated daily acidity can be found in . During all days (even the ones with high average acidity) there were periods when the aerosol was neutral (CitationRees et al. 2004). Also during periods when the particles were acidic on average, there were probably some particles that were neutral. Therefore the acidity corresponds to the average aerosol composition on that day and probably the samples examined include particles of different composition and acidity. Samples linked to high average aerosol acidities (H+ ≥ 10 ng m–3) have smaller mean values than neutral ones for both shape parameters, resulting in more elongated particles. The samples were grouped into three categories: summer acidic, summer neutral, and winter (). Summer acidic samples had morphologies that were statistically different from summer neutral and winter ones (p < 0.05 in the Student t-test for both parameters). On the other hand, shape parameters in the summer neutral and winter samples had the same mean. Thus, particle morphology is quantitatively different in summer acidic samples from neutral summer or winter samples, which seem to contain more similar particle morphologies. Lower shape parameters in the summer acidic group indicate the presence of more irregular elongated particles than in the other two groups. Detailed description of these elongated particles and the interpretation of their presence in the summer acidic periods will be discussed later using the HRSEM analysis.
TABLE 2 Daily acidity, CCSEM shape parameters, and HRSEM groups (columns A–E described in section 2.4) for particles below 1 μ m
TABLE 3 Sp 2 and Sp 3 mean value and standard deviation of the mean: summer acidic, summer neutral, and winter samples for particles below 1μ m
3.2. Individual Particle Morphology as a Function of Size
To evaluate the possible size dependence of the particle morphology for the three different cases (summer acidic, summer neutral, and winter samples), the two shape parameters Sp 1 and Sp 2 have been studied for different size ranges (). The shape parameters of particles in the 0.5–1 μ m range are similar to those of the 1–2.5 μ m particles under nearly all conditions. However, the smaller particles (less than 0.5 μ m) have statistically significant lower values of both shape parameters in all cases, but especially the ones corresponding to summer acidic periods. Higher acidities associated with a decrease in particle size have been previously reported by CitationGanor et al. (1993) in Israel, where acidic droplets were linked to particle sizes below 0.9 μ m.
TABLE 4 Sp 2 and Sp 3 mean value and standard deviation of the mean for the summer acidic, summer neutral, and winter periods in three size ranges: 0.2–0.5 μ m, 0.5–1 μm, and 1.0–2.5 μ m
3.3. Particle Morphology as a Function of Sulfur Content
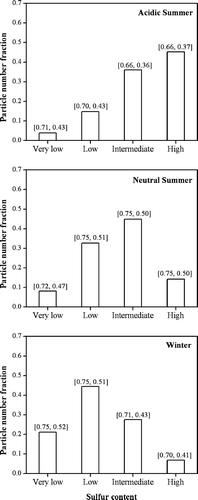
This analysis was carried out to study the possible dependence between particle morphology and their sulfur content. shows the fraction of particles in the four defined groups (very low, low, intermediate, and high sulfur content) for summer (acidic and non acidic) and winter samples based on CCSEM of a large number of particles. During summer, there is a higher fraction of particles with higher S content, a finding consistent with the observed PM2.5 sulfate concentrations during PAQS (CitationWittig et al. 2004a). The average values for Sp 1 and Sp 2 of each group are shown on the top of each bar. Winter and summer neutral samples have similar fractions of particles of each group. Nearly 90% of the particles in the summer acidic samples are found in the intermediate and high sulfur content groups and have smaller Sp 1 and Sp 2 values than the summer neutral and winter ones.
FIG. 2 Number distribution of particles classified based on sulfur content (relative X-ray counts) in the submicrometer range: Very low (non detectable S), Low (2–11%), Intermediate (12–21%), and High (22–33%) for summer samples, taken on acidic (a) and neutral days (b), and winter (c). The numbers in brackets on the top of each bar correspond to the median values of Sp 1 and Sp 2 in each group.
3.4. HRSEM Analysis
Results of the HRSEM analysis are shown in . Samples with high acidities contain mainly group A: elongated particles with liquid appearance and partially or totally recrystallized needle-like particles with low Sp values as shown in –. This is consistent with the CCSEM results in which these samples have very low values for both shape parameters, Sp 1 and Sp 2. We have confirmed using X-ray analysis that particles similar to the ones shown in were not organic droplets but that they were mostly sulfates.
In general, samples linked to neutral conditions, with higher measured carbon concentrations (), have higher fractions of soot-like and regular-shaped particles (groups B and C) than the more acidic periods. There are more group C and D particles in winter than in summer neutral samples, with the exception of S2. The high concentration of regular-shaped particles that volatilize easily when they interact with the electron beam may be due to the higher abundance of nitrates during winter (CitationWittig et al. 2004b).
4. DISCUSSION AND CONCLUSIONS
Summer 2001 and winter 2002 samples from the intensive SEM filter collection during PAQS have been analyzed by different microscopy methods. The CCSEM results allow the morphological differentiation of samples taken on days in which acidity was high (H+ ≥ 10 ng m–3) from the rest of the samples in particles down to 200 nm. Complimentary HRSEM analysis was used to examine the morphological properties in more detail and to link shape and possible liquid or solid state of the particle.
Particle morphology, size, and sulfur content were different in samples linked to high estimated aerosol acidity from those samples linked to neutral conditions during summer and winter periods. Much lower shape factors values were associated with smaller particles (less than 500 nm) with high sulfur contents in samples associated to highest acidities, which may indicate that smaller particles are more acidic (relating low Sp values to acidity). Acidic aerosol samples had lower shape parameter values because they mainly contained partially coalesced droplets with irregular shapes and partially or totally recrystallized elongated rectangular particles with very low associated shape parameters. These results suggest that acidic atmospheric particles may maintain some water even after they are deposited on a filter even exposed to low relative humidity.
Special thanks to S. Takahama for providing the acidity and other PAQS data. The participation of CIEMAT personnel has been supported by the Spanish Ministry of Science and Technology under contract REN2002-02343. The Carnegie Mellon University research was supported by the NSF ATM-0732598.
REFERENCES
- Allen , T. 1997 . Particle Size Measurement: Volume 1 , London : Chapman & Hall .
- Ansari , A. S. and Pandis , S. N. 1999 . Prediction of Multicomponent Inorganic Atmospheric Aerosol Behavior . Atmos. Environ. , 33 : 745 – 757 .
- Cabada , J. C. , Rees , S. , Takahama , S. , Khlystov , A. , Pandis , S. N. , Davidson , C. I. and Robinson , A. L. 2004 . Mass Size Distributions and Size Resolved Chemical Composition of Fine Particulate Matter at the Pittsburgh Supersite . Atmos. Environ. , 38 : 3127 – 3141 .
- Casuccio , G. S. , Schaegle , S. F. , Lersch , T. L. , Huffman , G. P. , Chen , Y. Z. and Shah , N. 1983 . The Use of Computer-Controlled Scanning Electron-Microscopy in Environmental Studies . J. Air Poll. Control Assoc. , 33 : 937 – 943 .
- Conner , T. L. , Norris , G. A. , Landis , M. S. and Williams , R. W. 2001 . Individual Particle Analysis of Indoor, Outdoor, and Community Samples from the 1998 Baltimore Particulate Matter Study . Atmos. Environ. , 35 : 3935 – 3946 .
- Davies , C. N. 1979 . Particle-Fluid Interaction . J. Aerosol Sci. , 10 : 477 – 513 .
- Dingle , A. N. and Joshim , B. M. 1974 . Ammonium Sulfate Crystallization in Andersen Cascade Impactor Samples . Atmos. Environ. , 8 : 1119 – 1130 .
- Dockery , D. W. , Pope , C. A. , Xu , X. P. , Spengler , J. D. , Ware , J. H. , Fay , M. E. , Ferris , B. G. and Speizer , F. E. 1993 . An Association Between Air Pollution and Mortality in 6 United States Cities . N. Engl. J. Med. , 329 : 1753 – 1759 .
- Dougle , P. G. , Veefkind , J. P. and ten Brink , H. M. 1998 . Crystallisation of Mixtures of Ammonium Nitrate, Ammonium Sulphate and Soot . J. Aerosol Sci. , 29 : 375 – 386 .
- Ebert , M. , Inerle-Hof , M. and Weinbrunch , S. 2002 . Environmental Scanning Electron Microscopy as a New Technique to Determine the Hygroscopic Behavior of Individual Aerosol Particles . Atmos. Environ. , 36 : 5909 – 5916 .
- Ganor , E. 1999 . A Method for Identifying Sulfuric Acid in Single Cloud and Fog Droplets . Atmos. Environ. , 33 : 4235 – 4242 .
- Ganor , E. , Levin , Z. and Pardess , D. 1993 . Determining the Chemical Composition of Fog, Haze and Cloud Droplets in Israel . Atmos. Environ. , 27A : 1821 – 1832 .
- Hasegawa , S. and Ohta , S. 2002 . Some Measurements of the Mixing State of Soot-Containing Particles at Urban and Non-Urban Sites . Atmos. Environ. , 36 : 3899 – 3908 .
- Hinds , W. C. 1999 . Aerosol Technology: Properties, Behavior, and Measurement of Airborne Particles , New York : John Wiley & Sons .
- Johnson , K. S. , Zuberi , B. , Molina , L. T. , Molina , M. J. , Ledema , M. J. , Cowin , J. P. , Gaspar , D. J. , Wang , C. and Laskin , A. 2005 . Processing of Soot in an Urban Environment: Case Study from the Mexico City Metropolitan Area . Atmos. Chem. Phys , 5 : 3033 – 3043 .
- Katrinak , K. A. , Rez , P. and Buseck , P. R. 1992 . Structural Variations in Individual Carbonaceous Particles from Urban Aerosol . Environ. Sci. Technol. , 26 : 1967 – 1976 .
- Khlystov , A. , Stanier , C. O. , Takahama , S. and Pandis , S. N. 2005 . Water Content of Ambient Aerosol During the Pittsburgh Air Quality Study . J. Geophys. Res. , 110 D07S10, doi:10.1029/2004JD004651
- Köllensperger , G. , Friedbacher , G. , Grasserbauer , M. and Dorffner , L. 1997 . Investigation of Aerosol Particles by Atomic Force Microscopy . Fresenius J. Anal. Chem , 358 : 268 – 273 .
- Krueger , B. J. , Grassian , V. H. , Ledema , M. J. , Cowin , J. P. and Laskin , A. 2003 . Probing Heterogeneous Chemistry of Individual Atmospheric Particles Using Scanning Electron Microscopy and Energy-Dispersive X-Ray Analysis . Anal. Chem. , 75 : 5170 – 5179 .
- Laskin , A. and Cowin , J. P. 2001 . Automated Single-Particle SEM/EDX Analysis of Submicrometer Particles Down to 0.1 μ m . Anal. Chem , 73 : 1023 – 1029 .
- Laskin , A. , Ledema , M. J. and Cowin , J. P. 2002 . Quantitative Time-Resolved Monitoring of Nitrate Formation in Sea Salt Particles Using a CCSEM/EDX Single Particle Analysis . Environ. Sci. Tech. , 36 : 4948 – 4955 .
- Laskin , A. , Ledema , M. J. , Ichkovich , A. , Graber , E. R. , Taraniuk , I. and Rudich , Y. 2005 . Direct Observation of Completely Processed Calcium Carbonate Dust Particles . Faraday Discuss. , 130 : 453 – 468 .
- Lee , R. J. , Fasiska , E. J. , Janocko , P. , McFarland , D. and Penkala , S. 1979 . Electron-Beam Particulate Analysis . Ind. Res. Dev. , : 25 – 28 .
- Lee , R. J. and Kelly , J. F. 1980 . “ Applications of SEM-Based Automated Image Analysis ” . In Microbeam Analysis , Edited by: Wittry , D. B. San Francisco, CA : San Francisco Press .
- Levin , Z. , Price , C. and Ganor , E. 1990 . The Contribution of Sulfate and Desert Aerosols to the Acidification of Clouds and Rain in Israel . Atmos. Environ. , 24A : 1143 – 1151 .
- Mamane , Y. , Ganor. , E. and Donagi , A. E. 1980 . Aerosol Composition of Urban and Desert Origin in the Eastern Mediterranean I, Individual Particle Analysis . Water, Air and Soil Pollution , 14 : 29 – 43 .
- Mamane , Y. , Willis , R. and Conner , T. 2001 . Evaluation of Computer-Controlled Scanning Electron Microscopy Applied to an Ambient Urban Aerosol Sample . Aerosol Sci. Technol. , 34 : 97 – 107 .
- Pardess , D. , Levin , Z. and Ganor , E. 1992 . A New Method for Measuring the Mass of Sulfur in Single Aerosol Particles . Atmos. Environ. , 26A : 675 – 680 .
- Pope , C. A. , Burnett , R. T. , Thun , M. J. , Calle , E. E. , Krewski , D. , Ito , K. and Thurston , G. D. 2002 . Lung Cancer, Cardiopulmonary Mortality, and Long-Term Exposure to Fine Particulate Air Pollution . JAMA. , 287 : 1132 – 1141 .
- Posfai , M. , Xu , H. , Anderson , J. R. and Buseck , P. R. 1998 . Wet and Dry Sizes of Atmospheric Aerosol Particles: An AFM-TEM Study . Geophys. Res. Lett. , 25 : 1907 – 1910 .
- Rees , S. L. , Robinson , A. L. , Khlystov , A. , Stanier , C. O. and Pandis , S. N. 2004 . The PM2.5Federal Reference Method (FRM) and the Chemical Mass Balance for Fine Particulate Matter . Atmos. Environ. , 38 : 3305 – 3318 .
- Reid , J. S. , Cahill , T. A. and Wakabayashi , P. H. 1994 . Geometric/Aerodynamic Equivalent Diameter Ratios of Ash Aggregate Aerosols Collected in Burning Kuwaiti Well Fields . Atmos. Environ , 18 : 2227 – 2234 .
- Schwoeble , A. J. , Dalley , A. M. , Henderson , B. C. and Casuccio , G. S. 1988 . Computer-Controlled SEM and Microimaging of Fine Particles . J. Met , 40 : 11 – 14 .
- Seinfeld , J. H. and Pandis , S. N. 1998 . Atmospheric Chemistry and Physics: From Air Pollution to Global Change , New York : Wiley .
- Subramanian , R. , Khlystov , A. Y. , Cabada , J. C. and Robinson , A. L. 2004 . Positive and Negative Artifacts in Particulate Organic Carbon Measurements with Denuded and Undenuded Sampler Configurations . Aerosol Sci. Technol. , 38 : 27 – 48 .
- Takahama , S. , Davidson , C. I. and Pandis , S. N. 2006 . Semicontinous Measurements of Organic Carbon and Acidity During the Pittsburgh Air Quality Study: Implications for Acid-Catalyzed Organic Aerosol Formation . Environ. Sci. Technol. , 40 : 2191 – 2199 .
- Weiss , R. E. , Kapustin , V. and Hobbs , P. 1992 . Chain Aggregate Aerosols in Smoke from Kuwait Oil Fires . J. Geophys. Res. , 97 : 14527 – 14533 .
- Wittig , A. E. , Anderson , N. , Khlystov , A. Y. , Pandis , S. N. , Davidson , C. and Robinson , A. L. 2004a . Pittsburgh Air Quality Study Overview . Atmos. Environ. , 38 : 3107 – 3125 .
- Wittig , A. E. , Takahama , S. , Khlystov , A. Y. , Pandis , S. N. , Hering , S. , Kirby , B. and Davidson , C. 2004b . Semi-Continuous PM2.5 Inorganic Composition Measurements During the Pittsburgh Air Quality Study . Atmos. Environ. , 38 : 3201 – 3213 .
- Wittmaack , K. , Menzel , N. , Wehnes , H. and Heinzmann , U. 2002 . Phase Separation and Regrowth of Aerosol Matter Collected After Size Fractionation in an Impactor . Atmos. Environ. , 36 : 5877 – 5886 .
- Wittmaack , K. and Strigl , M. 2005 . A Novel Approach to Identifying Supersaturated Metastable Ambient Aerosol Particles . Environ. Sci. Technol , 39 : 8177 – 8184 .