Abstract
A miniature cyclone was designed to gently capture fine aerosols into a continuous liquid flow. The geometry of the cyclone was designed so that the friction of the turning air swirls a 100 μl volume of water at the base of the cone, creating a standing liquid vortex which coats the inside deposition surface. The collection efficiency of the cyclone was characterized as a function of insoluble particle size, both in stand-alone operation and preceded by aerosol growth by water vapor condensation. The aerosol growth lowered the smallest collected particle size and created synonymous sample-into-substrate material conditions at the point of impact. The cyclone collection efficiencies were higher than 88% for the fluorescent polystyrene latex bead diameter sizes 50–3000 nm. The cyclone was further interfaced to a flow cytometer to detect airborne nucleic acid (as a virus test aerosol) in the cyclone sample flow. The flow cytometer, which is commonly used for single cell identification via fluorescence, was modified to accept a continuous sample flow (nominal 60 μl min−1) from the cyclone for real-time detection. A rod-shaped plant virus (Tobamovirus) and a protein-enveloped insect virus (Baculovirus) were aerosolized, collected by the cyclone, and stained inline using the nucleic acid dyes SYBR Green I, SYTO-9, and SYTO-24 (Molecular Probes, Inc.). In addition, an Environmental Scanning Electron Microscope (ESEM) was used to confirm the collection of single virus particles and qualitatively evaluate the degree to which the aerosolization and collection process affected the integrity of the virus.
1. INTRODUCTION
1.1. Biological Aerosols and Sampling
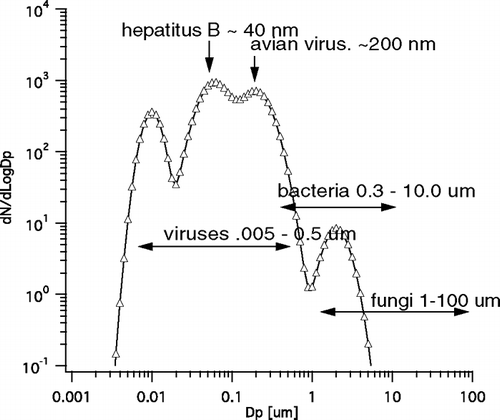
Aerosol particles consist of both water soluble and insoluble species. Bioaerosols include viruses, bacteria, cells, fungi, spores, insect parts, pollen, seeds, and other natural plant material and range in diameter size (Dp) from .005 μm to 30 μm (CitationDimmick 1969). A common link among all bioaerosols is the presence of nucleic acid, either in the form of DNA or RNA. With the possible exception of viruses, nucleic acid alludes to origins of living matter. Natural dispersion of living matter in air is fundamental to nutrient transport and the procreation of many life forms (CitationSistrom 1962). As early as the Black Plague (AD350), Albertus Magnus believed that disease came from, “… these pestilent winds and corruption of the air.” In the last century, attention has especially been given to the spread of disease in hospitals where methods of air filtration have been applied to remove bacteria and to limit the spread of infectious disease (CitationRiley 1961). The transport of disease via airborne viruses and bacteria is still a major concern in hospitals as well as in agricultural regions, for example in recent outbreaks of Foot-and-Mouth disease (CitationGloster and Alexandersen 2004). Although it is believed that most biological aerosols are transported on micron-sized particles, there is a paucity of knowledge below the 1 μm particle size for both indoor and outdoor environments. In particular, the size range of viruses spans the ambient aerosol Aitken and accumulation modes () which tend to have the longest atmospheric lifetime and dominate the total aerosol number. In a recent study using flow cytometry, virus and bacteria populations on the order of 106–107 per mL in seawater were measured in the Mediterranean Sea (CitationMarie et al. 1999). Since bubble bursting is a major source of the marine aerosol whose sizes extend well below one micron, fine sized viruses are likely present. Quantifying airborne nucleic acid could improve our knowledge of specie dispersion as it fits within the ambient aerosol size distribution.
To date, there is no technique which efficiently samples insoluble PM in such a way that the morphology of the insoluble particles is preserved over a broad size range 0.005–10.0 μm. This task faces the challenges of minimizing stress to the particle throughout the collection and analysis process which, with the possible exception of in-situ identification, is inevitably present.
In offline collection methods such as impactors or filters, high impact velocities adhere insoluble PM to collection surfaces, typically making extractions difficult. Often in field studies, collection substrates become coated with a sticky brown film, a fraction of which is insoluble in water and requires an additional solvent or physical means of removal. Several studies have recognized the major hurdle in preventing particle breakup during collection and maintaining proper conditions to preserve viable microorganisms immediately after sampling (CitationHenningson and Ahlberg 1994). For preservation of microorganisms, CitationJensen and Schafer (1998) recommended sampling in wet or humid conditions. A list of factors which can effect bioaerosol viability are reported in CitationGriffiths and Decosemo (1994). CitationGrinshpun et al. (1997) stated that impinger collected bioaerosols suffer less stress than impacted ones, since particles are removed into a liquid. CitationLi and Lin (2001) and CitationLin and Li (1999), studied how sampling methods affected the viability of stored bacteria. They compared sampling E. coli with an impinger versus filter, and observed 50% loss after 8 hours of impinger operation, and 70% loss after 1 hour of filter operation. They noted that although sampling efficiencies on filters were near 100%, significantly higher than impingement, cell injury on the filters due to impaction and dehydration was the main cause of viable loss. The 50% cutoff diameter (Dp50 of some impingers can reach lower than 1.0 μm, however the impact velocity of the aerosol normally approaches sonic speeds. Some mini-impingers impact the aerosol into smaller sample volumes of 10 mL, but also require a non-evaporating or additional liquid for samples collected over longer time periods. CitationRothwell (1992) recommended cyclone sampling due to its gentle capture. CitationGriffiths et al. (1997) and CitationUpton et al. (1994) described a wetted general cyclone (Aerojet) with a liquid injection nozzle at the sample entrance to wash the walls of collected particulates. The liquid prevents hang-up of insoluble matter and transports particulates to the bottom for collection. CitationGriffiths et al. (1997) tested a reduced dimension of the cyclone which had an 85% collection efficiency for large particle sizes and a Dp50 of 0.84 μm. They concluded that cyclone sampling offers the best method of bioaerosol capture in terms of minimizing cell damage. Microorganism collection efficiencies varied from 0.16 to 0.57 based on total counts of the bacteria Expansum and S. Epidermidis, respectively. In more recent work, Angranovski et al. (Citation2002, Citation2005), collected biological particles in bubbles which formed when passing sample air through porous media submerged in liquid. At a flow rate of 4 l min−1 they showed a collection efficiency greater than 95% for 0.320 μm sized particles. CitationMainelis et al. (2006) reviewed an aerosol to liquid collector developed by CitationMasquelier et al. (2003). The collector uses a flow rate of 275 l min−1 to impinge aerosols into a liquid volume of 1 ml. The Dp50 ranged from 0.45 μm to 2.1 μm depending on operating parameters. Very few studies have focused on continuous sampling with inline detection. An interesting device developed by CitationGreenwald et al. (2005) uses a glass impinger modified for flow through mode and interfaced to an insoluble liquid particle counter (LiQuilaz). The instrument gave 15 channels of resolution for counting insoluble particle numbers between Dp 0.25 and 2.0 μm.
1.2. Cyclone Flow and Design
In contrast to an impactor, which has a single abrupt 90-degree turn in the streamlines, the particle-laden air in a cyclone is directed tangentially along the inner wall of a cylinder whose larger radius turns the air more gently, starting a circular vortex. As the air moves downward, the repeating turns tighten into a cone, before the air exits out a tube inserted down the vortex center. Compared to impactors, cyclones have broader collection efficiency curves, sometimes covering a range of several microns. Some of the efficiency lost in the larger turning radius of a cyclone is gained back in the repetitive turns, allowing more time for the particles to stray from the gas streamlines and deposit against the wall. While the cyclonic flow introduces a significant velocity component tangential to the wall, it reduces the impact velocity of the particle normal to the deposition surface. Traditionally, cyclones have been designed for lower pressure drops and for removal of larger aerosols particles Dp > 1 μm.
There are several interesting studies which describe the flow patterns and collection efficiencies of cyclones (CitationMuschelknautz 1971; CitationBohnet 1982). CitationMuschelknautz and Krambrock (1970) for example, visually showed the air patterns in a cyclone to help understand the flow dynamics. They showed photos of a cyclone vortex attaching to the inner wall and precessing. CitationLiden and Gudmundsson (1997) showed that, depending on the length of the natural vortex (Lv) that forms relative to the cyclone cone length, two possible flows are possible. If the conical length of the designed cyclone is longer than the natural vortex that forms, the natural vortex is free to attach and move periodically on the inner wall (CitationChan and Lippmann 1977). In this configuration, several investigators have observed that a ring of deposited particulate builds-up at Lv. CitationPant et al. (2002) called this condition ‘saltation’, where a reversal in flow short-circuits the cyclone and leaves a stagnant volume in the base of the cone. If the cone length is either at or shorter than Lv however, the base of the natural vortex attaches to the bottom of the cyclone cone and continues circulating up through the exit tube. CitationSalzmann and Hochstrasser (1983) observed that for the latter case, in the “turbulent” flow regime (Re > 2000), spiral deposits of particulate accumulated on the inside walls. They suggested that this ‘straight through’ mode of operation is the most efficient and reduces the pressure drop across the cyclone. CitationLiden and Gudmundsson (1997) explained the two flow modes as resulting instead from two different flow regimes described by Re. They described them as “wall-attached periodic” and “bottom-attached turbulent” modes, with an Re > 2000 for the bottom-attached mode. Studies have shown that excessive cyclone lengths do not alter or increase a cyclone's collection efficiency (CitationBuettner 1999). CitationZhu and Lee (1999) varied ratios of cyclone dimensions to predict an optimum design in terms of collection efficiency of DOP laboratory generated aerosol. They determined that the cone length should be ≥ Lv to maximize performance. In a study by CitationXiang et al. (2001), no effect on collection efficiency was found by varying the cone width, however it was noted that increased flow rate helped collection efficiency. Still more studies have performed sensitivity analysis on cyclone dimensions to determine which geometries (or ratios of) optimize the collection efficiency for a given particle size (Moore and McFarland 1983, 1986; Pant et al. 1999; CitationSalzmann and Hochstrasser 1983; CitationLiden and Gudmundsson 1997). Pant et al. (1999) performed a regression study on 6 mini-cyclones based on the same method used by CitationSalzmann and Hochstrasser (1983). In a series of studies by CitationMaynard and Kenny (1995) and Kenny and Gussman (Citation1997, Citation2000), an empirical model was developed to design a cyclone with a desired Dp50 and sharpness. Since the start of this work, Gussman et al. (2007) applied this approach to design a small 16.7 l min−1 sharp cut cyclone with a Dp50 of 1 um. The latter mentioned studies offer good starting points for cyclone design and optimization.
1.3. Aerosol Growth by Water Vapor Condensation
In addition to cyclonic flow, growth of aerosols into larger droplets reduces the air stream velocity required for collection and hence the impact velocity. Several instruments, often referred to as steam collection devices, inject a small turbulent flow of steam into the cooler aerosol sample flow to create a supersaturated environment of water vapor (CitationSimon and Dasgupta 1995; CitationKhlystov et al. 1995; CitationWeber et al. 2001; CitationOrsini et al. 2003). The small particles grow into larger water droplets and are collected downstream by inertial methods, for example with an impactor. The pressure drop to collect the grown particles is reduced and the droplet aerosol wets the collection surface upon impact. These instruments exploit various analytical techniques which are capable of continuous analysis, such as ion chromatography, and are able to deliver online detection of soluble aerosol chemical composition. Though the deposition surfaces in the steam collection systems are continuously wetted, insoluble aerosol mass inevitably builds up during continuous operation. The sticky accumulation is easily seen by sampling cigarette smoke, an effect also observable with most impingers. As a result, operators of steam collection instruments steer clear of the contribution from insoluble PM, and make efforts to prevent transport of the insoluble mass to the analytical device in order to reduce artifacts and instrument wear.
In this work, a condensation growth chamber was combined with a cyclone to maximize the gentleness of particle collection. In addition, the cyclone was designed so that the circulating air flow sets up a standing vortex of water extending the entire height of the inside wall. The vortex effectively replaces a dry inner wall with a moving liquid surface into which the particles are impacted. In combination with condensational growth, the smallest collected particle size was lowered, and synonymous sample-into-substrate material conditions were achieved, i.e., aerosol water into cyclone water. The cyclone was subsequently connected to a flow cytometer to act as an insoluble particle counter.
1.4. Liquid Particle Counting
A flow cytometer counts single particles in liquid flow and is traditionally used to resolve populations of insoluble particles such as cells in blood. In flow cytometry, a laser illuminates the center of a small liquid flow which is hydrodynamically focused by particle free sheath fluid. The insoluble particles in the centerline scatter light, which is registered by a photo detector. Although the basic operating principle of the flow cytometer is relatively unchanged since the 1950s, it is gaining wider use in the analysis of particle populations in the outside environment, such as ocean waters and soils. In part, this is due to developments in molecular dyes and software (CitationSteen 2000). In a recent study for example, flow cytometry was used to resolve virus populations from background particles in seawater (CitationMarie et al. 1999). Vertical concentration profiles of viruses were compared to that of bacteria, and showed an order of magnitude more virus than bacteria counts. CitationDuhamel and Jacquet (2006) also used flow cytometry to enumerate vertical profiles of bacteria and viruses in lake sediments.
Molecular dyes are designed to exhibit fluorescence after binding to specific particle populations. Once bound, the fluorescent intensity of the dye molecule can reveal particle subpopulations which would be otherwise grouped together with similar light scattering characteristics. In contrast, other molecular dyes have been designed to bind to all particles containing DNA, RNA, or both, thus permitting a grouping of otherwise dissimilar populations. Especially relevant to detecting virus-sized particles, are molecular stains which fluoresce by factors of 1000 or more upon binding (CitationCosa et al. 2001). The enhanced fluorescence lowers the smallest detectable scatter size and provides signal amplification to help resolve populations from background fluorescence. In this work, a flow cytometer was modified for inline continuous flow and used to analyze the liquid flow from the described cyclone. A molecular dye was introduced to target nucleic acid in order to detect airborne particles which contain living matter.
2. MATERIALS AND METHODS
2.1. Cyclone Design
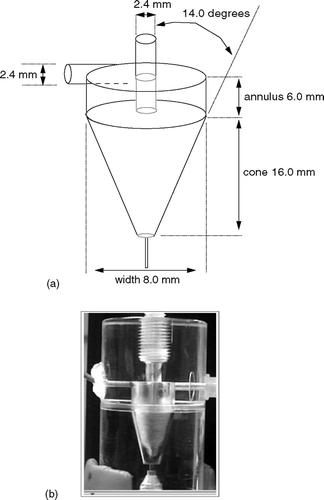
The cyclone geometry () was designed so that the circular air flow turns a 100 μl volume of water at the base of the cone to create a standing liquid vortex, replacing the inside deposition surface with a wall of water. For a 16 l min−1 air flow rate, the angle at the base of the cone is critical—too small and the surface tension holds the water too tightly in the narrow angle; too large and the air circulation is not rapid enough to spin the water. The cyclone length was designed so that the natural vortex of air would extend to the base of the cone, leaving behind no dead volume. A purified deionized water flow (nominal .050–500 μl min−1 added to the top of the annulus is balanced by an exit flow (nominal .050–500 μl min−1 at the base of the cone plus a fraction removed in the exhaust air flow. All liquid flows are maintained with a 10-channel peristaltic pump (Ismatec, IPC series) connected to a five liter reservoir of purified water. A minimum input water flow of ∼.050 μl min−1 is necessary to maintain a water vortex which reaches the top of the annulus. The fraction of input water wasted through the air exhaust is nominally 5–35% of the input flow but is dependent on how the user balances the liquid flows. Proper balancing of the liquid flows wastes minimal sample collected and provides a debubbled liquid flow for analysis. The water added at the aerosol entrance helps to reinforce the water vortex at the point where the entering sample air makes its first turn and impacts the largest particles. There was speculation whether some of the collected sample might exit the cyclone before being mixed to the base of the vortex; however, introduction of a visible dye showed instantaneous mixing throughout the sample volume. is a photo of the prototype cyclone during initial testing of various dimensions. The cyclone was machined from two pieces of clear polycarbonate which snap together in the middle section marking the division between the annulus and cone. In the photo, the aerosol enters from the right hand side tangent to the back wall, and liquid flow is pulled out from the bottom via a 1/16 inch PEEK capillary. The capillary siliconed-in on the left, was inserted at various locations to find the best position for the entering deionized water flow. The entrance capillary was later placed directly in the throat of entry or at 90 degrees tangential to the wall. The water vortex in the photo forms from approximately 100 μl of liquid.
2.2. Insoluble Test Aerosols and Particle Collection Efficiency
The collection efficiency of the cyclone was characterized as a stand-alone unit and in combination with an aerosol growth chamber positioned immediately upstream of the cyclone inlet. The aerosol growth chamber used in this work is part of the Particle-Into-Liquid-Sampler (PILS) described in detail in CitationOrsini et al. (2003). The growth chamber injects a small turbulent jet of steam into an aerosol sample flow to create a supersaturated environment of water vapor. The aerosol particles subsequently grow into droplets with Dp > 1 μm and are focused through a small nozzle for collection. The growth chamber was chosen because it preserves the droplets in the air flow as opposed to removal against the large surface of the condensation chamber. In this way, the particles can be concentrated into a small area for collection, e.g., in this case, the small inlet diameter of the cyclone.
The collection efficiency tests were performed in the Particulate Matter Laboratory at the Atmospheric Sciences Research Center at the State University of New York at Albany (CitationHogrefe et al. 2004). The flow configuration for the calibration is shown in . Monodisperse insoluble aerosols were generated by atomizing dilute monodisperse suspensions of fluorescent polystyrene latex spheres (PSL, Duke Scientific) using a constant output atomizer (TSI, model 3076). The insoluble PSL spheres have a density of 1.05 g cm−3 and included diameter sizes 50, 100, 200, 500, and 3000 nm. The atomizer flow was diluted with 4 l min−1 of dry particle free sheath air before passing through a bipolar neutralizer. To accommodate approximately 18 l min−1 of total air flow, additional dry filtered makeup air was added before a mixing chamber. From the mixing chamber, 16 l min−1 of flow was sampled by the cyclone system, while approximately one l min−1 was drawn into a scanning differential mobility particle sizer (TSI, SMPS Model 3936). For the 3000-nm particle size, the SMPS was replaced with an aerodynamic particle sizer (TSI, APS Model 3321).
FIG. 3 Flow configuration to atomize monodisperse PSL particles and measure the total number concentration to calibrate the cyclone collection efficiency.
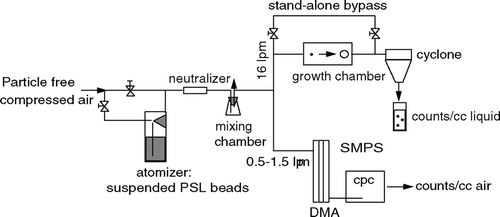
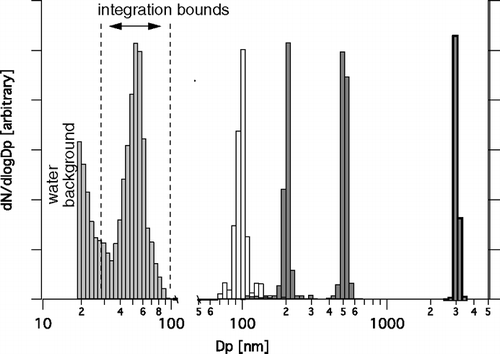
The SMPS or APS continuously scanned the size distribution of the atomized aerosol every two minutes to give the airborne number concentration (Csmps for the monodisperse size. Examples of the scanned distributions are shown in . For monodisperse sizes ≥100 nm, Csmps was calculated by integrating across a size window which bracketed all counts shown in the figure. For 50 nm, however, the size distribution began to smear into the background of the atomized water, rendering the integration bounds uncertain. For the 50 nm size, the number concentration was calculated based on the net increase in the volume of the size distribution above that of atomized pure water. The total particle number was calculated as the net volume increase divided by the volume per particle. Any contribution due to surfactant was neglected. In , the integration bounds are drawn only to show the size range which yields the same total number concentration determined from the volume difference. The upper bound was first drawn beyond observable counts and the lower bound extended backwards. As will be seen shortly, the polydisperse nature of the 50 nm size distribution is taken into account in the final calibration figure.
FIG. 4 Airborne monodisperse PSL particles as scanned by the SMPS and APS. The 50 nm size began to combine with the size distribution of the atomized water.
Csmps was used as the theoretical aerosol concentration entering the cyclone. When the cyclone was preceded by aerosol growth by water vapor, the saturated air exiting the growth chamber condensed slightly in the cyclone, diluting the sample. This dilution factor was measured by spiking the purified water entering the cyclone with a known lithium fluoride concentration, and measuring the outgoing diluted lithium fluoride concentration with ion chromatography. The dilution factor was monitored intermittently and remained steady at 13% in the room air conditions during the calibration tests. Based on the sample air flow rate Qair, and liquid flow rate qin into the cyclone, the predicted concentration of insoluble particles in the collected liquid Cpredict was calculated as: Cpredict = Csmps Qair qin 1R, where: Cpredict is the predicted liquid concentration (particles cm−3 liquid, Csmps is the SMPS measured concentration in air (particles cm−3 air, Qair is the sample air flow rate into the cyclone (nominally 16,000 cm3 min−1, qin is the purified liquid flow rate into the cyclone (nominally 0.20 mL min.−1, and R is the dilution factor equal to 1.13 when operated with preconditioning, and equal to 1 when operated alone.
2.3. Measurements of Liquid Particle Concentration (Cmeas
The collection efficiency(ϵ of the cyclone is the measured divided by predicted concentration of insoluble particles collected: ϵ = Cmeas / Cpredict. For each particle size, Cmeas was determined for a collected liquid aliquot by its fluorescent emission intensity in a fluorimeter (Photon Technology International, QM series). It is for this reason that fluorescent particle standards were used. To predict concentration based on fluorescence, dilutions of each monodisperse PSL standard were made, and the emission intensity was plotted as a function of concentration at a fixed excitation wavelength (). For the PSL standards, the manufacturer's excitation wavelength of 468 nm was used along with the brightest emission wavelength at 520 nm. The equation of a liner regression fit to each data series was used to calculate concentration based on a measured emission intensity. Although a wide range of suspension concentrations were analyzed for each size, the straight lines shown in were fit in hindsight only to the data points which bracketed the range needed in the collection efficiency tests. The uncertainty in the predicted concentrations calculated from the linear fit was determined by the variance in the fitted line () (CitationHarris 2003). It is interesting in that a small kink in the data points emerges at lower emission intensities and extends further into the range of the fitted line for smaller size standards. While the cause of the deviation in the data points was not investigated, it has the effect of increasing the variance in the linear regression, as seen in the uncertainty in predicted concentration for the 50 nm particle size.
FIG. 5 Measured emission intensities by the fluorimeter for a series of dilutions from each monodisperse PSL particle solution.
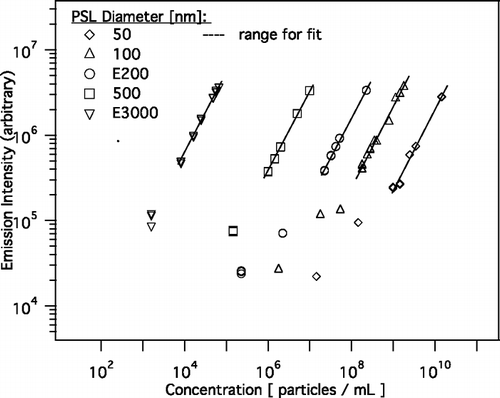
TABLE 1 Calculated uncertainty in predicted concentration based on the variance in the linear regression
2.4. Nucleic Acid Test Aerosols
A plant virus and an insect virus, described in , were the two nucleic acid containing particle types used as test aerosols. The rod-shaped Baculo-insect virus (BLV, Baculoviridae) contains a double DNA strand and is often enveloped in a second protective protein coat ranging in size from 1–15 μm (CitationKing and Posee 1992). The rod-shaped Tobacco Mosaic plant virus (TMV, Tobamovirus) contains a single RNA strand and is non-enveloped (CitationVoet and Voet 2004). Both viruses contain nucleic acid strands contained inside a helical construction of protein molecules (capsids). The purified BLV stock from Siena's Biology Department was originally harvested in media containing insect cells. Baculoviruses were generated using the Invitrogen Bac-to-Bac Baculovirus Expression System according to the manufacturer's protocol (www.invitrogen.com). Briefly, bacmid DNA was introduced (transfected) into Spodoptera frugiperda (Sf9) silkworm ovary cells that were propagated in a monolayer culture in SF900 II serum free media (Invitrogen). This allowed production of baculoviruses in the culture media. Seventy-two hours after transfection, viruses were separated from the Sf9 cells by centrifugation at 12,000 × g for 5 minutes. To propagate the virus, the culture supernatant containing the viruses was then used to infect fresh Sf9 cells in a monolayer culture for 48 hours. Centrifugations created similar cell-free baculoviruses and subsequent infections. The purified TMV stock was purchased from American Type Culture Collection (ATCC, product no. PV 135-P). The BLV and TMV viruses were not intended to be representative of ambient airborne microorganisms but were chosen to provide a degree of variation in nucleic acid type and particle characteristics as well as cost, safety, and availability considerations.
TABLE 2 Characteristics of the virus particles used in this study
Virus aerosols were generated from dilute suspensions of both BLV and TMV. The BLV aerosol was produced by atomizing a 103 diluted BLV stock suspension in a constant output atomizer (TSI, model 3076). 4 l min−1 of output flow from the atomizer was diluted by 14 l min−1 of dry particle free air before entering the cyclone collection system. In later tests where TMV was generated, the atomizer was replaced with a bubbler in an attempt to reduce stress during the aerosolizing process. For bubbled TMV, a 103 dilution of the purchased TMV stock was bubbled with 8 l min−1 of filtered air through a partially submerged glass frit. The exiting flow from the bubbler was mixed with 10 l min−1 of particle-free dry dilution air and directed to the cyclone collection system which allowed for overflow. For both TMV and BLV, no intermediate measurement was made after particle generation to characterize the aerosol size distribution before entering the cyclone. At this time we were focused on the positive identification of the airborne virus in the collected liquid.
2.5. Virus Staining and Flow Cytometry
A cocktail of SYTO-9, SYTO-24, and SYBR Green-1 dyes (Invitrogen, Inc.) was made to stain the BLV and TMV viruses (Personal Communication, Invitrogen). All dyes were stored at –40°C and thawed for mixing immediately before injection into the virus sample. The dye mixture was diluted by a factor of 104 upon injection into each virus sample as recommended by the manufacturer. This dye combination binds to DNA (as well as RNA) while possessing similar excitation/emission wavelengths of 488 nm (blue)/520 nm (green), respectively. Additionally, separate use of the dyes SYBR-Gold and SYTO-9 were qualitatively intercompared for signal versus background fluorescence using the TMV virus.
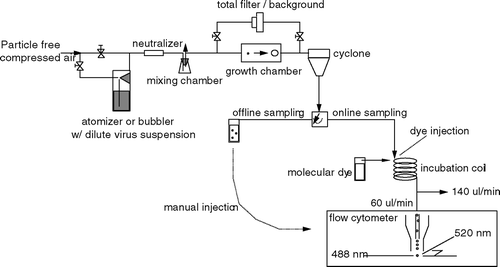
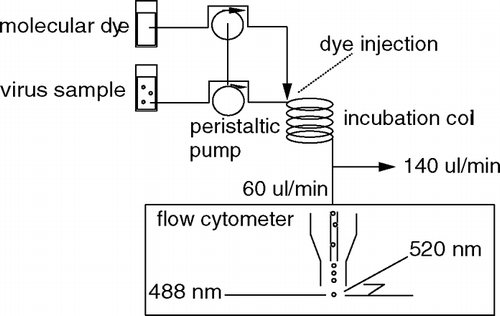
Two flow cytometers were used in this work: a Becton-Dickinson FACS Calibur and a Partec CyFlow® space, which are configured with a 488 nm excitation laser. Both have detectors positioned at 0°, the forward-scatter direction to detect 488 nm light, and at 90°, the side-scatter direction to measure scattered 488 nm light and fluorescent 520 nm light, respectively. As will be shown, both 0° and 90° detected light are needed to clearly resolve signal from background. Inline flow staining and flow cytometry detection of the virus was performed in opaque 1/16 inch PEEK capillary tubing by injecting a concentrated dye flow (50 μl min−1 into a virus sample flow (150 μl min−1 via a peristaltic pump (). The dye, which was contained in an opaque insulated reservoir to protect it from light, was prepared so that inline mixing into the sample flow resulted in a net dye dilution factor of 104. A capillary coil provided a 4-minute incubation time before 140 μl min−1 was pumped off to waste in order to deliver a net sample flow of 60 μl min−1 to the Partec CyFlow® space. Since flow cytometers are designed for discrete offline sampling, the plumbing of the CyFlow® space was reconfigured for continuous flow by bypassing the internal syringe pump and connecting the sample liquid flow from the cyclone directly to the sample port.
FIG. 6 The flow configuration to stain and detect the BLV inline with the Partec CyFlow® space flow cytometer.
shows the flow configuration used to generate and detect airborne virus samples in offline and continuous online mode. In both cases, an airborne test virus was generated with an atomizer (TSI, model 3076) or a glass frit bubbler containing a dilute virus suspension. Similar to the calibration setup, the output aerosol flow from the atomizer was diluted by 14 l min−1 of dry particle free air that could be directed either through a total filter (for a background zero), or sampled directly by the cyclone system. The liquid flow from the cyclone was either stained and detected inline with a flow cytometer, or collected and analyzed offline by manual injection into the flow cytometer.
2.6. Environmental Scanning Electron Microscopy (ESEM)
The State University of New York's ESEM (FEI Nova NanoSem) was used to analyze samples of stock virus as well as offline samples collected from the airborne virus in . Samples were prepared by pipetting 100 μL of liquid onto an aluminum foil substrate which was freeze-dried overnight under vacuum to prevent coagulation of the virus during drying. Samples were analyzed under ESEM conditions of: water vapor pressure: 0.38 torr (50.7 Pa), electron beam: 5 kV at 56 pAmps, and magnification:102,000×.
3. RESULTS AND DISCUSSION
3.1. Cyclone Collection Efficiency
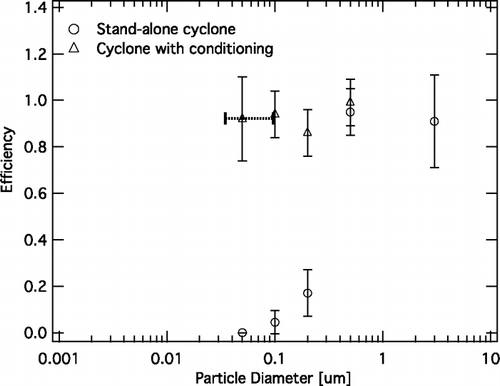
The collection efficiency of the cyclone was characterized as a function of insoluble particle size both in stand-alone mode and preceded by aerosol growth by water vapor condensation. shows the overall collection efficiency, ϵ = Cmeas / Cpredict as a function of diameter for the cyclone in both cases. Each data point in the figure represents an average collection efficiency calculated from three independent runs. Each run is characterized by one 20-minute collected sample of liquid from the cyclone matched against an average of 10 two-minute SMPS scans. The stand-alone cyclone has a 50% collection efficiency at approximately 500 nm and drops to less than 1% below 100 nm. The collection efficiency of the cyclone preceded by aerosol conditioning maintains an average 90% down to 50 nm. The x-axis error bar on the 50 nm data point brackets the range of the integration bounds shown in . It is worth mentioning, that for the stand-alone cyclone, the 16.0 LPM collection efficiency is 90% well below 1 μm. If, according to CitationOrsini et.al. (2003), the condensation chamber grows particles Dp > 30 nm into droplets sizes Dp > 1 μm, then there is room to reduce the flow velocity into the conditioned cyclone without sacrificing collection efficiency. Of course, this would be assuming that the water vortex is still maintained.
3.2. Virus Fluorescence: Offline versus Inline Staining and Detection
Initially, virus samples were stained offline simply to characterize a fluorescent virus population with flow cytometry and to determine the minimum incubation time needed for the dye to bind and emit brightly enough to resolve the population from background. Two BLV sample types were stained: the supernatant of a centrifuged sample containing media only, and the supernatant of a centrifuged sample containing media and virus. shows counts vs. fluorescent 90° light intensity at 520 nm for the stained media and virus samples on two different flow cytometers: a Becton-Dickinson FACS Calibur () and a Partec CyFlow® space (). The virus populations, visibly different in both runs, are separated from the larger background peaks to the left-hand side. It should be noted that the BLV samples shown in the figure were prepared from independent batches and appeared to contain substantially different concentrations. The incubation time was observed in snapshots of the fluorescent population immediately after dye injection at times 1, 4, 20, 30, and 45 minutes on the CyFlow® space (). For longer incubation times, two smaller peaks could be seen to the right hand side of the main population, which we speculated was likely due to smaller coagulated groups of virus particles or a scattering orientation. If the fluorescent intensity at the peak position of the dominant virus population is plotted as a function of time, a view of the rate of stain binding can be seen in . In independent runs, an emission intensity plateau emerged after approximately 30 minutes. A four minute incubation time was chosen as reasonably fast, yet long enough to resolve the virus from background.
FIG. 9 Stained media and stained Baculo-virus stock solutions analyzed on (a) a Becton-Dickinson FACS Calibur and (b) a Partec CyFlow® space.
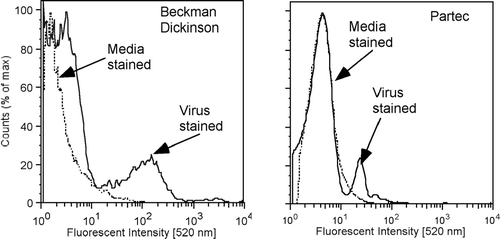
FIG. 10 Increasing emission of (a) the stained Baculo-virus population, and (b) the peak emission intensity of the virus population versus time.
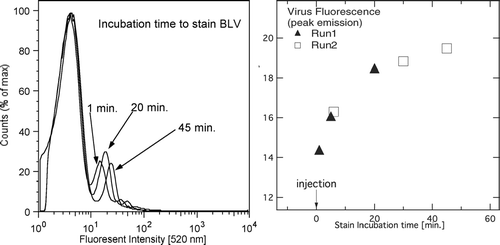
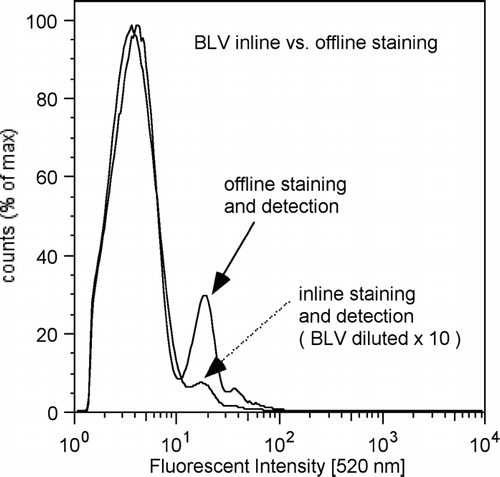
For inline staining, a four minute residence time was provided by a coiled length of PEEK tubing as described earlier in the flow configuration of . With the exception of a factor of 10 dilution in the virus sample, the inline staining shown in is nearly identical to the offline staining on the same instrument. Subsequent work has since determined that the 3-dye cocktail used in this experiment was not necessary. The incubation times for individual dyes such as SYBR-Gold and SYTO-9 were observed to exhibit maximum fluorescence in less than a minute.
3.3. Online Airborne Virus Detection
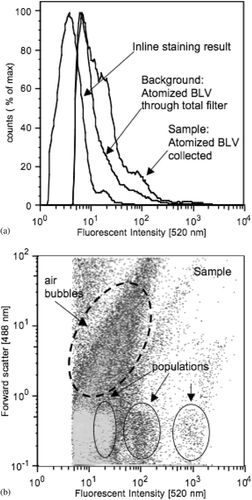
Airborne test virus was stained inline and detected online according to the flow configuration described in . Atomized BLV was directed first through the total filter to characterize a baseline (background) fluorescence from the flow cytometer in the absence of nucleic acid (). It can be seen in that the background fluorescence with the cyclone inline was significantly higher than the inline staining result, which is also shown in the figure. This increase in background fluorescence was discovered to be the result of air entrained into the water vortex of the cyclone causing bubbles to form. When the airflow valves were switched from the total filter (background) to the cyclone (sample), the virus appeared as superimposed shoulder populations. One of the strengths of flow cytometry lies in the fact that both forward and side scattered light intensity can be measured. The forward scattered light can give qualitative information on the size of the particle, whereas side scattered light can give information on particle structure. In general, larger particles scatter more light in the forward direction. For the sample trace of , if the y-axis is replaced with the forward scattered light intensity, is produced. By using the forward scatter parameter, the larger forward scatter of the bubbles can be resolved from the fluorescent side scatter of the virus population, allowing the virus populations to be seen as small groups along the x-axis.
3.4. Offline Airborne Virus Detection and Room Aerosol
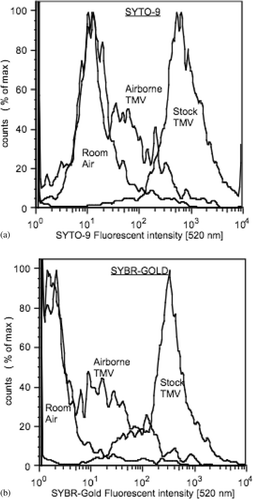
In a second set of experiments, the fluorescence of airborne TMV stained with SYTO-9 and SYBR-Gold dyes was compared against the background fluorescence of the room aerosol. In these tests, a glass-frit bubbler was used in place of the atomizer in to reduce the stress to the virus. Since access to a flow cytometer for inline detection was not possible, vials of sample liquid were collected from the cyclone for offline staining and cytometric analysis on the Becton-Dickinson FACS Calibur. All samples were stained with a one minute incubation period before analysis. Longer incubation times did not increase the fluorescence intensity as previously observed with the dye mixture. shows the fluorescence background of room air aerosol collected by the cyclone compared to the fluorescence of collected airborne TMV. Also shown is the stock virus suspension diluted by a factor of 104. and compare the SYTO-9 and SYBR-Gold dyes for identical liquid samples. In comparing the two figures, the SYTO-9 dye exhibited slightly brighter fluorescence than SYBR-Gold for the stock TMV analyzed. More significant was SYBR-Gold's reduced fluorescence intensity of the background room aerosol, which helped to resolve the airborne TMV population. A notable feature in both figures is the decade higher fluorescence intensity of the stock suspension over the airborne TMV. The intensity difference might be the result of dye bound to larger coagulated virus particles in the stock samples as compared to single virus particles or virus breakup in the aerosolizing or collection process.
3.5. Environmental Scanning Electron Microscopy (ESEM)
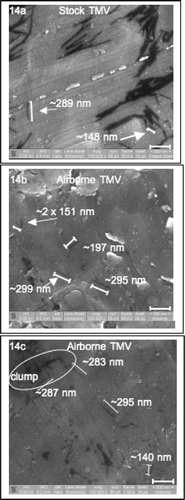
To investigate virus breakup and validate the presence of virus particles in the liquid of the cyclone, samples were analyzed in an ESEM (FEI Nova NanoSem). , , and show one stock and two cyclone collected TMV images respectively, with a reference bar of 300 nm. In the stock sample, extensive clumping of the rod-like virus appeared both greater and less than the nominal length of 300 nm. In the collected cyclone samples, a similar range of virus lengths was observed in addition to broken pieces and a small number of clumps similar to the stock solution. Based on the images, it was somewhat difficult to evaluate the degree to which the aerosolization or collection process affected the integrity of the virus. It was encouraging however, to observe a large fraction of single virus particles having lengths close to the nominal 300 nm. Often, the fragment lengths of kinked single virus particles summed to nearly 300 nm. Bent pieces consisted of approximately 5% of the single particle number count.
4. CONCLUSION
Collecting bioaerosols into liquid requires extracting insoluble PM from the air in a manner that is gentle and highly efficient due to low number concentrations. A cyclone system, designed to improve gentleness while maintaining a high collection efficiency, relies on a modus operandi that combines three physical mechanisms: (1) condensational growth of the sample aerosol into water droplets to coat the particles and reduce the inertia required for collection, (2) cyclonic flow to reduce the impact velocity, and (3) a flowing water substrate into which the droplets were collected for inline analysis. An advantage of the condensational growth/vortex combination is the creation of similar sample/substrate water conditions which may help collection. The insoluble collection efficiency, characterized using PSL spheres, exceeded 88% for Dp ≥ 50 nm. Since the calibration curve for the stand-alone cyclone dropped-off well below 1 um, it is feasible that with condensational growth, the sample inlet velocity could be further decreased to reduced the particle impaction forces without sacrificing collection efficiency.
Since adhesion to surfaces is a materials question, it is uncertain if the collection efficiency would be maintained for biological particles such as cells, bacteria, and viruses. Furthermore, the particle number concentrations used for the calibration are orders of magnitude higher than realistic biological number concentrations in the ambient environment. A 10% loss in collection efficiency could make a significant difference in detecting low numbers. Further calibration studies will focus on delivering lower counts to the cyclone to exploit the single particle counting nature of flow cytometry.
A Baculovirus (BLV) was successfully stained in PEEK capillary flow and detected with inline flow cytometry. The same virus was also atomized, collected by the cyclone, and resolved from background air bubbles with the forward scatter parameter of the flow cytometer. In addition, airborne Tobacco Mosaic virus (TMV) was collected and stained offline to compare the virus fluorescence against background room air. The molecular dye SYBR-Gold yielded the lower background fluorescence, consistent with reports by CitationCosa et al. (2001) which intercompared unbound fluorescence of several dyes. Although this work used a consistent 104 dilution of the dye from the manufacturer's stock, a reduced dye concentration could provide sufficient labeling of nucleic acid while reducing background fluorescence. Current work also indicates that the addition of compounds to the collected samples before staining reduces fluorescence of unbound stain while not affecting the binding affinity to the nucleic acid.
In terms of the viruses used for this study, both the BLV and TMV are not representative atmospheric biological aerosols, however their structural differences provide valuable insights into the collection process and detection by flow cytometry. For example, the BLV with its DNA and TMV with its RNA both visibly fluoresced apart from background. The fact that the BLV is often enveloped in a second protective protein coat ranging in size from 1 to 15 μm did not appear to affect fluorescence detection and may have protected it from breakup during aerosolization or collection. The broader ranges in fluorescent intensity which appeared for the airborne collected TMV in comparison to the BLV could be a result of breakup in the more vulnerable construction of TMV (no protective coating). Although the nucleic dyes used in this study are designed to penetrate protein membranes of cell walls, protein dyes may perform better than nucleic acid dyes relative to background. Specific antibodies are also available to enhance fluorescence. At this point in time however, the nucleic acid dyes appear to offer more unspecific staining.
This study did not test whether a single virus particle could be detected in air. Although populations of virus particles can be resolved, a significant reduction in background fluorescence will be necessary to achieve the goal of reliable quantification. It is very likely that larger particles such as bacteria, fungi, or spores, would fluorescence brightly enough to be singly detected via flow cytometry as observed by others in natural samples (CitationMarie et al. 1999; CitationDuhamel and Jacquet 2006).
The major manufacturers of flow cytometers now have models which are portable for field work and operate on both AC and DC power. This appears to be driven in part by the demand to detect disease in remote areas such as Africa. Equally as interesting in terms of portability are the current advancements in micro fluidics which are being applied to flow cytometry as well as polymerase chain reaction (PCR) to amplify populations inline.
In this work, although we chose a cyclone-flow cytometry interface to detect nucleic acid in liquid flow, other cyclone-analytical combinations may open up new opportunities to characterize the insoluble aerosol fraction in relatively small liquid flow rates. Such liquid analysis might include radioactivity, mineral analysis, or total carbon quantification. Currently, we are attempting to extend the bottom and top ends of the collection efficiency curve to go below 50 nm and above 3 um. In addition, we continue the current work by intercomparing stained ambient populations identified with flow cytometry with offline ESEM and would like to better characterize the range of variation in the fluorescence of the background aerosol.
Acknowledgments
This work was done on a shoestring and we are grateful to many good people who allowed it to happen: Prof. Ken Demerjian at the Atmospheric Science Research Center at the University at Albany for lab access, Dr. Roy Overton from GCAT for the initial CyFlow® work, Prof. Dr. Wolfgang Göhde for the invitation to Partec GmbH in Muenster Germany, Klaus Wenners of Partec GmbH for help in the online flow cytometer setup, Prof. Rachel Sterne-Marr in Siena's Biology Department for her donation of the Bacoluvirus, Jenny Gilles at Evident Technologies for providing quantum dots, Olivia Cholewa of Invitrogen for useful discussions on molecular stains, and Metrohm AG in Herisau, Switzerland for their machining of the cyclone prototypes. Finally, I would like to thank David Covert for long ago discussions in Leipzig, Germany, when we first exchanged ideas about insect aerosols. The authors also wish to thank the Siena College's Summer Scholars program which funded the summer work in Germany.
REFERENCES
- Agranovski , I. , Reponen , T. , Willeke , K. and Grinshpun , S. 2002 . Development and Evaluation of a New Personal Sampler for Culturable Airborne Microorganisms . Atmos. Environ. , 36 ( 5 ) : 889 – 898 .
- Bohnet , M. 1982 . Zyklonabscheider zum Trennen von Gas/Feststoff-stroemungen . Chemie Ingenieur Technik , 54 : 621 – 630 .
- Buettner , H. 1999 . Dimensionless Representation of Particle Separation Characteristics of Cyclones . J. Aerosol Sci. , 30 : 1291 – 1302 .
- Chan , T. and Lippmann , M. 1977 . Environ. Sci. Technol. , 11 ( 4 ) : 377 – 382 .
- Cosa , G. , Focsaneanu , K. S. , McLean , J. R. N. , McNamee , J. and Scaiano , J. C. 2001 . Photophysical Properties of Fluorescent DNA-dyes Bound to Single- and Double-stranded DNA in Aqueous Buffered Solution . Photochem. & Photobiol , 73 ( 6 ) : 585 – 599 .
- Dimmick , R. L. and Ackers , A. 1969 . An Introduction to Experimental Aerobiology , New York : Wiley-Interscience .
- Duhamel , S. and Jacquet , S. 2006 . Flow Cytometric Analysis of Bacteria and Virus Like Particles in Lake Sediments . J. Microbial Meth , 64 : 316 – 332 .
- Gloster , J. and Alexandersen , S. 2004 . New Directions: Airborne Transmission of Foot-and-Mouth Disease Virus . Atmos. Environ. , 38 ( 3 ) : 503
- Greenwald , R. , Bergin , M. and Carrico , C. 2005 . New Real-time Technique to Measure the Size Distribution of Water-insoluble Aerosols . Environ. Sci. Technol. , 39 : 4967 – 4973 .
- Griffiths , W. D. and Decosemo , G. 1994 . The Assessment of Bioaerosols—A Critical Review . J. Aerosol Sci. , 25 ( 8 ) : 1425 – 1458 .
- Griffiths , W. , Stewart , S. , Futter , S. , Upton , S. and Mark , D. 1997 . The Development of a Sampling Method for the Assessment of Indoor Aerosols . J. Aerosol Sci. , 28 : 437 – 457 .
- Grinshpun , S. , Willeke , K. , Ulevicius , V. , Juozaitis , A. , Terziea , S. , Donnely , J. and Stelma , G. 1997 . Effect of Impaction Bounce and Reaerosolization on the Collection Efficiency of Impingers . Aerosol Sci. Technol. , 26 : 326 – 342 .
- Gussman , R. A. , Kenny , L. C. , Labickas and Norton , M. 2002 . Design, Calibration, and Field Test of a Cyclone for PM 1 Ambient Air Sampling . Aerosol Sci. Technol. , 36 ( 3 ) : 361 – 365 .
- Harris . 2003 . Quantitative Chemical Analysis , Berkeley Heights, NJ : Freeman Press . Eqn. 4–27, 71
- Henningson , E. W. and Ahlberg , M. S. 1994 . Evaluation of Microbiological Aerosol Samplers: A Review . J. Aerosol Sci. , 25 ( 8 ) : 1459 – 1492 .
- Hinds . 1982 . Aerosol Technology, Property Behavior and Measurement of Airborne Particles , New York : John Wiley & Sons . Eq. 3–28, 50
- Hogrefe , O. , Drewnick , F. , Lala , G. , Schwab , J. and Demerjian , K. 2004 . Development, Operation, and Applications of an Aerosol Generation, Calibration Research Facility . Aerosol Sci. Technol. , 38 ( S1 ) : 196 – 214 .
- Jensen , A. and Schafer , M. 1998 . Sampling and Characterization of Bioaerosols . NIOSH Manual of Analytical Methods. , : 82 – 112 . Method 0800
- Kenny , L. C. and Gussman , R. A. 2000 . A Direct Approach to the Design of Cyclones for Aerosol Monitoring Applications . J. Aerosol Sci. , 31 ( 12 ) : 1407 – 1420 .
- Kenny , L. C. and Gussman , R. A. 1997 . Characterization and Modeling of a Family of Cyclone Aerosol Presaparators . J. Aerosol Sci. , 28 ( 4 ) : 677 – 688 .
- Khlystov , A. , Wyers , G. and Slanina , J. 1995 . The Steam-jet Aerosol Collector . Atmos. Environ. , 29 : 2229
- King , L. and Possee , R. 1992 . The Baculovirus Expression System , Norwell, MA : Chapman and Hall .
- Li , C. and Lin , Y. 2001 . Storage Effects on Bacteriological Concentration: Determination of Impinger and Filter Samples . Sci. Total Environ. , 278 : 231 – 237 .
- Liden , G. and Gudmundsson , A. 1997 . Semi-empirical Modeling to Generalize the Dependence of Cyclone Collection Efficiency on Operating Conditions and Cyclone Design . J. Aerosol Sci. , 28 : 853 – 874 .
- Lin , W. H. and Li , C. S. 1999 . Evaluation of Impingement and Filtration Methods for Yeast Bioaerosol Sampling . Aerosol Sci. Technol. , 30 : 119 – 126 .
- Mainelis , G. , Masquelier , D. , Willeke , K. , Makarewicz , A. , Dzenitis , J. and Milanovich , F. 2006 . Performance of a Compact Air-to-Liquid Aerosol Collector with High Concentration Rate . J. Aerosol Sci. , 37 : 645 – 657 .
- Marie , D. , Brusaard , C. , Thyrhaug , R. , Bratbak , G. and Vaulot , D. 1999 . Enumeration of Marine Viruses in Culture and Natural Samples by Flow Cytometry . Appl. Environ. Microbiol. , 65 ( 1 ) : 45
- Masquelier , D. , Milanovich , F. and Willeke . High Air Volume to Low Liquid Volume Aerosol Collector . US patent 6,520,034 B1 . 2003 .
- Matthias-Maser , S. and Jaenicke , R. 1995 . The Size Distribution of Primary Biological Aerosol Particles With Radii > 0.2 μm in an Urban/Rural Influenced Region . Atmos. Res. , 39 ( 4 ) : 279
- Maynard , A. D. and Kenny , L. C. 1995 . Performance Assessment of Three Personal Cyclone Models Using an Aerodynamic Particle Sizer . J. Aerosol Sci. , 26 ( 4 ) : 671 – 684 .
- Moore , M. and McFarland , R. 1993 . Performance of a Single-Inlet Aerosol Sampling Cyclone . Environ. Sci. Technol. , 27 : 1842 – 1848 .
- Moore , M. and McFarland , R. 1996 . Design Methodology for Multiple Inlet Cyclones . Environ. Sci. Technol. , 30 : 271 – 276 .
- Muschelknautz , E. 1971 . Die Berechnung von Zyklonabscheidern fuer Gase . Chemie Ingenieur Technik. , 44 : 63 – 71 .
- Muschelknautz , E. and Krambrock , W. 1970 . Aerodynamische Beiwerte des Zyklonabscheiders Aufgrund Neuer und Verbesserter Messungen . Chemie Ingenieur Technik , 42 : 241 – 255 .
- Orsini , D. , Ma , Y. , Sullivan , A. , Sierau , B. , Baumann , K. and Weber , R. 2003 . Refinements to the Particle-Into-Liquid Sampler (Pils). for Ground and Airborne Measurements of Water Soluble Aerosol Composition . Atmos. Environ. , 37 : 1243
- Pant , K. , Crowe , C. and Irving , D. A. D. 2002 . On the Design of Miniature Cyclones for the Collection of Bioaerosols . Powder Technology , 125 : 260 – 265 .
- Riley , R. L. and O'Grady , F. 1961 . Airborne Infection , New York : Macmillan .
- Rothwell , G. 1992 . Collection of Airborne Microorganisms onto Sticky Surfaces . J. Aerosol Sci. , 23 ( S1 ) : s679 – s681 .
- Saltzman , B. and Hochstrasser , J. 1983 . Design and Performance of Miniature Cyclones for Respirable Aerosol Sampling . Environ. Sci. Technol. , 17 : 418 – 424 .
- Simon , K. and Dasgupta , K. 1995 . Continuous Automated Measurement of the Soluble Fraction of Atmospheric Particulate Matter . Anal. Chem. , 67 : 71
- Sistrom , W. R. 1962 . Microbial Life , Orlando, FL : Holt, Rinehart and Winston .
- Slanina , J. , Brink , H. M. T. , Otjes , R. , Even , A. , Jongejan , Khlystov , A. , Waijers-Ijpelaan , A. , Hu , M. and Lu , Y. 2001 . The Continuous Analysis of Nitrate and Ammonium in Aerosols by the Steam Jet Aerosol Collector (SJAC).: Extension and Validation of the Methodology . Atmos. Environ. , 35 : 2319
- Sorooshian , A. , Brechtel , F. , Ma , Y. , Weber , R. , Corless , A. , Flagan , R. and Seinfeld , J. 2006 . Modeling and Characterization of a Particle-Into-Liquid-Sampler (PILS) . Aerosol Sci. Technol. , 40 ( 6 ) : 369 – 409 .
- Steen , H. B. 2000 . Flow Cytometry of Bacteria: Gimpses from the Past with a View to the Future . J. Microbiol. Meth. , 42 ( 1 ) : 65
- Upton , S. , Mark , D. , Douglass , E. , Hall , D. and Griffiths , W. 1994 . A Wind Tunnel Evaluation of the Physical Sampling Efficiencies of Three Bioaerosol Samplers . J. Aerosol Sci. , 25 ( 8 ) : 1493 – 1501 .
- Voet , D. and Voet , J. 2004 . Biochemistry , 3rd ed. , New York : John Wiley and Sons .
- Weber , R. J. , Orsini , D. , Daun , Y. , Lee , Y.-N. , Klotz and Brechtel , F. 2001 . A Particle-Into-Liquid Collector for Rapid Measurements of Aerosol Chemical Composition . Aerosol Sci. Technol. , 35 : 718
- Xiang , R. , Park , S. and Lee. , K. 2001 . Effects of Cone Dimension on Cyclone Performance . J. Aerosol Sci. , 32 : 549 – 561 .
- Zhu , Y. and Lee , K. 1999 . Experimental Study on Small Cyclones Operating at High Flow Rates . J. Aerosol Sci. , 30 : 1303 – 1315 .
