Abstract
The particle acidity of secondary organic aerosol (SOA) created from ozonolysis of α-pinene in the presence of acidic inorganic seed aerosols was investigated using an indoor Teflon film chamber. Colorimetry integrated with a reflectance UV-Visible spectrometer was used for the first time to dynamically measure the aerosol acidity over time. An external calibration curve was produced based on the correlation between the proton mass (ng) collected on the filter, which was impregnated with metanil yellow, and the absorbance of the reflectance UV-Visible spectra for the protonated and the unprotonated metanil yellow on the filter. Using this calibration curve, the particle acidity of the submicron acidic sulfate aerosol coated with SOA was measured from the reflectance UV-Visible spectra of filter samples. The colorimetric analysis requires a short sampling time (less than 2 m) for SOA studies using the laboratory Teflon film chamber and eliminates extraction of the filter sample with water. Results show that the particle acidity of the aerosol decreased over time due to the formation of organic sulfate through the interaction of sulfuric acid with SOA products. The feasibility of this method is also demonstrated for the measurement of the acidity of ambient particles.
INTRODUCTION
Ambient particulate matter consists of both inorganic species (e.g., sulfates, ammonium, nitrates, sea salts, crusts, and metal oxides) and organic species (e.g., organic carbon (OC) and elemental carbon). As a class, secondary organic aerosol (SOA) produced from gas-phase reactions of volatile organic compounds (VOCs) with atmospheric oxidants (e.g., OH, O3, and NOx) is a significant constituent of atmospheric OC. Overall, concentrations of SOA vary seasonally by region, ranging from 20% to 90% of the total ambient OC. Although OC constitutes a major portion of ambient aerosol mass, with influences on climate forcing (CitationHansen and Sato 2001; CitationKanakidou et al. 2005), cloud chemistries (CitationBlando and Turpin 2000; CitationHoffer et al. 2004; CitationZahardis et al. 2006), and health (CitationGrahame and Schlesinger 2005; CitationJang et al. 2006b; CitationMaisonet et al. 2001), our knowledge of SOA formation mechanisms is still very limited.
Our recent laboratory studies (CitationCao and Jang 2007; CitationCzoschke and Jang 2006; CitationJang et al. 2002; CitationJang et al. 2006a; CitationJang and Kamens 2001; CitationLee et al. 2004; CitationNorthcross and Jang 2007) suggest that atmospheric organics such as carbonyls can be transformed to higher molecular weight products via heterogeneous acid-catalyzed reactions between the gas and particle phases. Furthermore, laboratory studies by other research groups also show that heterogeneous reactions in the particle phase are important mechanisms for the formation of SOA (CitationEdney et al. 2005; CitationGao et al. 2004; CitationGarland et al. 2006; CitationIinuma et al. 2004; CitationKalberer et al. 2004; CitationLiggio et al. 2005; CitationLimbeck et al. 2003). The net result of heterogeneous reaction in the aerosol phase is an increase in SOA mass and the formation of oligomers (CitationGao et al. 2004; CitationKalberer et al. 2004; CitationLiggio et al. 2005; CitationTolocka et al. 2004). Equally of concern is that SOA is produced by another pathway, in which carbonyls that are less important in a partitioning mode are integrated into SOA formation, particularly in acidic particles.
The formation of organic sulfates from aldehydes and alcohols exposed to acidic sulfates has been characterized by a number of previous laboratory studies. For example, CitationLiggio et al. (2005) reported organic sulfate formation from reactive uptake of glyoxal onto acidic sulfate particles. CitationLevitt et al. (2006) reported the uptake of alcohol by an acidic sulfate surface, suggesting the formation of organic sulfate. Surratt et al. (Citation2007a, Citation2007b) characterized organic sulfates from alcohol species in SOA exposed to acidic sulfate aerosol. CitationIinuma et al. (2007) report organic sulfate formation in SOA through the reaction of epoxy products with acidic sulfate. In a recent field study, CitationReemtsma et al. (2006) characterized organic sulfates and organic nitrates in water-soluble organic fractions of atmospheric aerosol samples collected in Riverside, CA, in summer 2005 using electrospray ionization Fourier transform ion cyclotron resonance mass spectrometry.
When atmospheric aerosol produces organic sulfates, particle acidity changes and can deviate from that determined solely by inorganic species. Either aerosol acidity or the significance of acidity effects on SOA formation will be dynamic, and it will vary with the history of titration of ammonia and the inorganic composition of the aerosol. The evaluation of the effects of particle acidity on ambient SOA is limited by current analytical methods, which use a pH meter (EPA Method IO-4.2, 1999) or ion chromatography. These methods measure the major inorganic ions such as sulfate, nitrate, and ammonium, assuming that the consumption of inorganic acids is dominated by ammonia titration. These types of analytical methods, which require water extraction, may incorrectly estimate proton concentration in aerosol by failing to take into account the formation of organic sulfates in SOA. These techniques are also unsuitable for the monitoring of changes in aerosol acidity over short periods of time.
In general, field studies that evaluate the influence of particle acidity on SOA formation are extremely complex due to the limitations of current analytical methods and the interference of various meteorological factors. There have also been large discrepancies among studies analyzing the contribution of acid-catalyzed reactions to ambient organic aerosol, due to differences in sampling location and various artifacts associated with different particle sampling methods and analytical instrumentations. For example, Brock et al. reported rapid organic aerosol mass increases within localized air plumes rich in both SO2 and VOCs (CitationBrock et al. 2002a; CitationBrock et al. 2002b). CitationLewandowski et al. (2007) reported that in Research Triangle Park, North Carolina, USA, higher PM2.5 and organic mass concentrations in ambient particle samples were generally observed under acidic conditions. CitationChu et al. (2004) reported that PM2.5 summertime episodes (Urban PM2.5 speciation data) are dominated by high quantities of acidic sulfates and organic aerosols, suggesting that in summer, heterogeneous acid-catalyzed reactions may participate in SOA production along with photooxidation and partitioning. CitationHinkley et al. (2008), in their recent study, examined ambient aerosols smaller than 0.3 μ m at a sampling site 7 km away from two large Australian coal-fired power stations equipped with fabric filters. In their chemical composition analyses using energy-dispersive X-rays, the ultrafine aerosol in low SO2 conditions was dominated by diesel soot from vehicle emissions, while considerable quantities of particles containing significant carbon peak were observed in the high SO2 samples, suggesting that secondary organic aerosol formation is catalyzed by these acid seed particles.
Citing recent field evidence from Pittsburgh, CitationZhang et al. (2007) report that the average concentrations of oxygenated organic aerosol analyzed using highly time-resolved organic mass spectra obtained with an Aerodyne Aerosol Mass Spectrometer during acidic periods is higher than those during periods of neutralized aerosol by up to 25%. This is in contrast to a previous study by CitationTakahama et al. (2006) that showed only small enhancements of SOA production (2%–4% SOA mass increases) due to inorganic acidity. CitationPeltier et al. (2007) reported in their aircraft-based study of ambient particles in the Atlanta, GA, area that no increase in water-soluble organic carbon (WSOC) concentrations was observed in the acidic plumes originating from coal power plants compared to out-of-plumes, within a WSOC measurement uncertainty of 8%.
To evaluate the significance of heterogeneous reactions on SOA formation in the presence of acidic sulfates, the measurement of dynamic particle acidity over time is critical. In this study, we demonstrate a new operational method that employs a colorimetric analysis integrated with a reflectance UV-Visible spectrometer to measure the proton concentration in a particle filter sample. This method can significantly reduce sampling time to less than one minute for the SOA created in a chamber study. Furthermore, this technique eliminates the workup procedure associated with water extraction and provides a particle acidity that directly corresponds to proton concentrations in aerosol filter samples. The testing method used in the present research permits us to study the kinetics and the potential significance of the formation of organic sulfates through the interaction of sulfuric acid and organic species in atmospheric SOA.
EXPERIMENTAL SECTION
Colorimetry
A 13 mm diameter sampling filter (Borosilicate microfibers reinforced with woven glass cloth and bonded with Teflon, Gelman Science Palflex, Type: TX40H120-WW) was dyed with a 0.02% aqueous solution of metanil yellow (Aldrich) for 10 min. Metanil yellow was used in low concentration so that it would exert essentially no control on the proton concentrations of the aerosol collected on the filter (see section “Indicator applied to air filters” of Results and Discussion). The dyed filters were dried by gentle streams of nitrogen and were kept in a tightly sealed bottle to avoid contact with ambient air until used for aerosol sampling.
The aerosol for colorimetric analysis was collected from a Teflon chamber on a filter dyed with metanil yellow, using a pump (Gast, DOA-P704-AA) at 13 L/min. The sampling filters were weighed (MX5 Mettler-Toledo Ltd., England) before and after sampling to estimate the aerosol mass collected on the filter. Both SMPS data and the aerosol mass measurements were used to estimate proton concentrations. No mass change by gas adsorption onto the small-size filter, tested using two (front and back) 13 mm filters, was observed.
The filter sample color changes associated with proton concentrations were monitored by reflectance UV-Visible spectroscopy (UV-3600 spectrometer, Shimadzu, Kyoto, Japan), which measured a wavelength range of 300 to 800 nm in our study. The UV-3600 spectrometer coupled with the integrating sphere attachment (ISR-3100) was used to measure the reflectance spectra for all of the data in and and NC series ambient filter samples in . The photomultiplier (PMT) measures wavelengths in the range of 300–700 nm, while the Indium/Gallium/Arsenide (InGaAs) photodiode detector measures those in the range of 700–800 nm. The ambient filter samples collected from the campus of University of Florida at Gainesville, FL were monitored by reflectance UV-Visible spectroscopy (Lambda 35 UV WinLab V5.2, PerkinElmer, Shelton, CT, USA) coupled with the integrating sphere attachment (50 mm integrating Sphere Lambda 2–40). The deuterium lamp covers over 190–1100 nm. The wavelength interval of UV-Visible spectral data was 1 nm and the slit width was 2.0 nm. Packed barium sulfate was used for reference and to establish a baseline. The temperature for the instrumentation ranged from 295 K–298 K, and the relative humidity level was 40%–45%.
TABLE 1 Indoor Teflon film chamber experiments involving inorganic seed aerosol of known composition
TABLE 2 Indoor Teflon film chamber experiments for SOA formation in the presence of acidic inorganic seed aerosolFootnote a
TABLE 3 Measurement of proton concentrations in the ambient particles using colorimetric analysisFootnote a
Chamber Experiment
The indoor chamber operation has been reported previously (CitationCzoschke and Jang 2006; CitationJang et al. 2006a; CitationNorthcross and Jang 2007). All experiments were conducted in a 2 m3 indoor Teflon film chamber without photoirradiation. The chamber was flushed with clean air from two clean air generators (Aadco Model 737, Rockville, MD; Whatman Model 75–52, Haverhill, MA) prior to each experiment. The chamber humidity was controlled by bubbling clean air through distilled water. The Whatman Model 75–52 is designed to deliver dry CO2 free air and the membrane air dryer (Aadco Model 737), to reduce the hydrophilic gas such as water (dew point = −40°C). Thus, we assume that concentrations of the hydrophilic ammonia gas in the chamber air created from clean air generators followed by a water bubbler, are significantly low. A seed aerosol was injected into the chamber using an atomizer (TSI, Model 3076, Shoreview, MN). Inorganic seed aerosols were made from an aqueous solution (0.01 M) of ammonium sulfate [(NH4)2SO4, AS], ammonium hydrogen sulfate (NH4HSO4, AHS), and sulfuric acid (H2SO4). After the injection of seed aerosols, ozone was injected into the chamber by passing clean air through a photolytic ozone generator (Jelight Model 600, Irvine, CA). The ozone was monitored using a photometric ozone detector (Thermo Environmental Instruments, Model 49). An excess of ozone was injected to achieve an α-pinene limited experiment. α-Pinene (Aldrich, 98%) as a 20% solution in carbon tetrachloride (99.9%, Aldrich) was introduced into the chamber by passing the clean air through a T-shaped glass tube that was gently heated using a heat gun.
The particle population was measured using a scanning mobility particle sizer (TSI, SMPS Model 3080, Shoreview, MN) associated with a condensation nuclei counter (TSI, Model 3025A). The particle number concentration was corrected for particle loss to the wall using a semi-empirical exponential decay function for each particle diameter over time (CitationMcMurry and Grosjean 1985). Temperature and humidity were measured with an electronic thermo-hygrometer (Hanna Instruments, Italy). The temperatures for the experiments were 294–297 K. The experimental conditions and the resulting data producing the external calibration curve are shown in . summarizes the experimental conditions applied to SOA formation using an indoor chamber.
Ambient Aerosol Sampling
The feasibility of colorimetry for the measurement of the proton concentrations of ambient aerosol, which was collected on both dyed and undyed filters, was also evaluated. The aerosol sampling system consisted of two 3-channel annular denuders (242 mm), a sampling holder, and a pump. Ambient particulates were sampled from two different locations: from the roof of McGavran-Greenberg Hall, located on the campus of the University of North Carolina at Chapel Hill, NC, and from the terrace of Black Hall, at the University of Florida at Gainesville, FL. Two denuders were placed upstream of the sampling filter (CitationSemmler et al. 2006): a potassium carbonate-coated denuder to remove acidic gases such as nitric acid and hydrochloric acid, and a citric acid-coated denuder to remove basic gases such as ammonia. The sampling flow rate was 13.0–13.3 L/min. The aerosol mass collected on the filter was obtained by weighing the filter mass before and after sampling. summarizes the experimental conditions for the ambient aerosol sample. Overall, the sampling site at Chapel Hill, NC is closely surrounded by busy local traffic roads within 100 m, and thus more affected by anthropogenic fossil combustion pollutants (automobile soot) than at Gainesville, FL.
RESULTS AND DISCUSSION
Indicator Applied to Air Filters
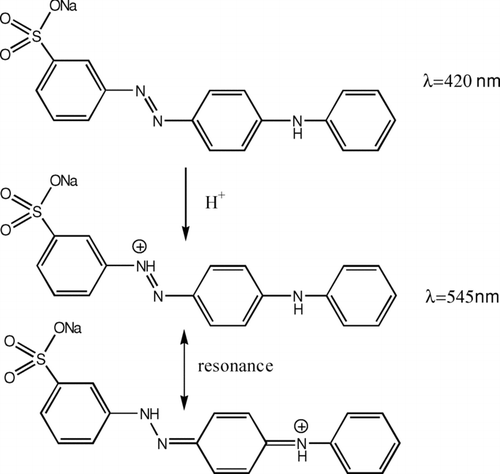
The molecular structure of metanil yellow used as an indicator is shown in . The pH interval associated with color change of metanil yellow is pH 1.5 (red) to pH 2.7 (yellow) in aqueous solution. Metanil yellow was chosen because (1) the color change between the acid-base conjugate pair is dramatic; (2) metanil yellow is sensitive to strong inorganic acids such as sulfuric acid, nitric acid, and ammonium hydrogen sulfate; and (3) the UV-Visible spectra of the protonated metanil yellow is shifted to a longer wavelength near 545 nm that is unlikely to overlap with the UV-Visible absorbance of atmospheric organics. In general, the UV-Visible absorption of atmospheric organic aerosol is lower than 400 nm (CitationKiss et al. 2003). Metanil yellow is stable in natural light for the duration of sampling (CitationNakano et al. 1993).
FIG. 1 Molecular structures of metanil yellow and protonated metanil yellow.
The indicator is added in a low concentration so that it exerts essentially no control on acidity of the system. For an indicator, the acid ionization constant (K a) is written as
If [H+] = a before interaction between protons and indicator molecules, the K a after interaction can be described as follows:
The total amount of the dye on the sampling area of the filter is extremely small (≈4 ng) compared to the filter mass (≈10 mg) and does not influence the aerosol collection efficiency of the filter. Both the filter and the aerosol are exposed to the chamber air and are influenced by humidity for the duration of the aerosol sampling. The filter materials, which are Teflon-coated glass fibers, neither are mixable with particulate matter nor affect the chemical properties of the aerosols. Hence, the influence of the filter material on the water uptake of the collected aerosols is insignificant in our chamber experiments. In general, the water uptake by Teflon-coated glass filters is trivial and not sensitive to the change of humidity, while the acidic inorganic seed comprising sulfuric acid and ammonium sulfate is hygroscopic and sensitive to humidity. By relocating the filter from a sampling holder to a spectrometer, amounts of water in aerosols and the resulting proton concentrations can be altered when the humidity of the chamber air differs from that of a spectrometer in an off-line mode. To overcome this difference, most of the chamber experiments in this study were carried out under humidity conditions close to those of the laboratory holding the spectrometer, except for several SOA experiments reported in . When the humidity levels of the laboratory and the chamber air differed, either the seed mass linked to aerosol water content or the proton concentrations were corrected based on the laboratory humidity condition using the inorganic thermodynamic model ISORROPIA (CitationNenes et al. 1998). To increase the feasibility of aerosol colorimetry in future studies of this nature, the development of an on-line colorimetry measurement technique or the control of humidity in the integrating sphere attachment of a spectrometer will be necessary.
Theoretical Proton Concentrations
The estimated proton mass (Mass H + ) for each aerosol filter sample at given experimental conditions is obtained as follows:
Reflectance UV-Visible Spectra
The color of the filter impregnated with the metanil yellow changes from yellow (λmax = 420 nm) to reddish-violet (λmax = 545 nm) as the filter is exposed to acidic aerosols. The color changes, which correspond to the quantity of protons sampled on the filter, were monitored via the absorbance spectra of the filter samples using a reflectance UV-Visible spectrometer. shows the absorbance UV-Visible spectra of the dyed filter and the filters exposed to acidic aerosols, specifically, the filter samples collecting acidic inorganic aerosols (Aerosol I) and those collecting the SOA created from ozonolysis of α-pinene in the presence of acidic inorganic aerosol (Aerosol II; see the section “Acidity of SOA”).
FIG. 2 (a) Absorbance spectra of the filter blank dyed with metanil yellow and the acidic aerosol collected on the dyed filter. Aerosol I: Filter sample of the high concentration of acidic inorganic aerosol comprising sulfuric acid and ammonium hydrogen sulfate (1:1 mixture) at relative humidity = 45%. Aerosol II: SOA from ozonolysis of α-pinene in the presence of acidic seed (H2SO4: ammonium bisulfate = 1:1). (b) Curve fitting of Aerosol I, half-width at half-height (HWHH) = 50 nm for Absλ = 420,In and HWHH = 70 nm for Absλ = 545,HIn + .
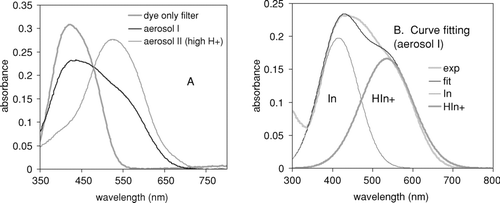
As shown in , recognizable absorption at 545 nm (Absλ = 545) appears for all acidic inorganic aerosol samples (S1–S15 in ) comprised of ammonium sulfate and sulfuric acid. The Absλ = 545 resulting from a neutral inorganic salt such as ammonium sulfate (S16 and S17 in ) and from an organic carboxylic acid such as citric acid (C1 and C2 in ) was negligible. Thus, the results indicate that color changes in the filter are mainly due to the presence of inorganic acids such as sulfuric acid and ammonium hydrogen sulfate.
Calibration Curve
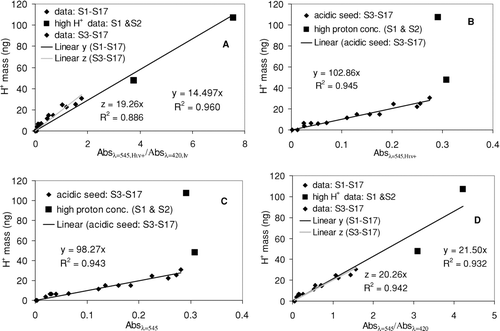
The available protons in aerosol are estimated using the correlation between Mass H + (ng) and the absorbance at λ = 420 nm (Absλ = 420) and at λ = 545 nm (Absλ = 545). An external calibration curve is obtained from Equations (3) and (5). The Mass H + for each aerosol sample applied to the calibration curve is estimated using Equation (Equation6). Based on the Lambert-Beer law, which describes the correlation between the concentration of a substance and its absorption behavior in a medium, [In] is directly proportional to Absλ = 420,In (absorbance of In at λ = 420 nm) and [HIn +] is proportional to Absλ = 545,HIn + (absorbance of HIn + at λ = 545 nm). When Mass H + is relatively high, Equation (Equation3) can be rewritten as follows:
The accuracy of both Absλ = 545,HIn + and Absλ = 420,In is essential in order to obtain the correct external calibration curve required for the estimation of proton concentrations in aerosols. Overall, the carryover from the UV-Visible spectrum of the unprotonated metanil yellow on the Absλ = 545,HIn + is negligible (i.e., less than 0.005). Therefore, we assume that Absλ = 545 ≈ Absλ = 545,HIn + . The impact of [HIn +] on Absλ = 420,In is somewhat larger than that of [In] on Absλ = 545,HIn + , particularly when [HIn +] is high. However, the carryover of [HIn +] onto Absλ = 420 is still trivial compared to the relative magnitude of Absλ = 420,In when aerosol systems have the Mass H + lower than 30 ng (S3-S17 in ).
To obtain the true Abs λ = 420,In without cross-absorption due to [HIn +] at high proton concentrations, we decoupled the individual reflectance UV-Visible spectra into Absλ = 420,In by metanil yellow only and Absλ = 545,HIn + by protonated metanil yellow only using least-squares curve fitting. The fitting parameters include the center frequency (ν), the peak absorbance (A), and the half-width at half-height (HWHH). Most band shapes in the UV-Visible absorbance spectra were approximated by a Gaussian mode (CitationJang and Kamens 2001). shows the results of the curve-fitting as applied to one of the spectra in .
summarizes the results for Absλ = 420,In and Absλ = 545,HIn + , which were applied to a calibration curve. illustrates the calibration curve plotting Mass H + versus Absλ = 545,HIn + /Absλ = 420,In with slope = 14.497 at intercept = 0. The good correlation (R 2 = 0.96) including data points S1 and S2 indicates that Equation (Equation8) is appropriate for high Mass H + data. The regression coefficient in Equation (Equation9) was also calculated using the same data set in to obtain the calibration curves for Mass H + vs. Absλ = 545,HIn + with curve fitting () and also Mass H + vs. Absλ = 545 with no curve fitting (). Data points S1 and S2 in high Mass H + become outliers in and , because Equation (Equation9) was originally designed for relatively low Mass H + . The good correlation is also observed in both (R 2 = 0.945) and (R 2 = 0.943) using only data points S3–S17. More importantly, the slope in is not statistically different from the slope in , at higher than a 0.99 confidence level. This indicates that if proton concentrations are not extremely high (as they are in, e.g., S1 and S2), the concentrations can be reasonably predicted using the data from the single wavelength at λ = 545 nm without the decoupling of UV spectra into the two components associated with [HIn +] and [In] of metanil yellow. This simplification will be valuable when the method is used for in situ and online techniques in the future. also shows the calibration curve for Mass H + vs. Absλ = 545/Absλ = 420 with no curve fitting. The slope in using data points S3–S17 is not statistically different from the slope in (S3–S17), at the 0.99 confidence level.
FIG. 3 (a) Calibration curve between Mass H + and Absλ = 545,HIn + /Absλ = 420,In . (b) Calibration curve from Mass H + vs. Absλ = 545,HIn + with curve fitting of spectra. (c) Calibration curve from Mass H + vs. the absorbance at λmaxe = 545 without curve fitting. (d) Calibration curve between Mass H + and Absλ = 545/Absλ = 420.
Acidity of SOA
The feasibility of colorimetry for the measurement of proton concentrations has been demonstrated for SOA created from ozonolysis of α-pinene in the presence of acidic inorganic seed aerosol. Atmospheric aerosols are often found to be a mixture of organics and inorganics. Thus, the measurement of aerosol acidity should also consider interactions between organics and inorganic species, to reflect actual aerosol compositions. The reflectance UV-Visible spectrum of SOA without any inorganic seed aerosols confirms that there is no detectable absorption of SOA for wavelengths longer than 400 nm. Thus, the Absλ = 545 of an internal mixture of SOA and inorganic seeds mainly originates from the [HIn +] of metanil yellow.
The experimentally observed proton mass (Mass H +, color ) of the aerosol collected on the filter was determined from the calibration curve (Equation [Equation10]) and the absorbance at 545 nm, which was monitored by a reflectance UV-Visible spectrometer.
The experimental conditions for SOA formation and the resulting Mass H +, color are summarized in . The total aerosol composition, and thus the inorganic seed fraction (f inorg ) of the total aerosol, changes as SOA coats on inorganic seed aerosols over time. Mass H +, inorg , the theoretical proton mass estimated from the composition of the aerosol, is calculated by the following equation:
FIG. 4 (a) Time profile of Mass H +, color and Mass H +, inorg of a1, a2, and a3 in as ozonolysis of α-pinene progresses in the presence of the acidic seed aerosol. The proton concentration at time = zero was estimated with Mass H +, inorg . (b) Time profile of the proton concentration [H+] (ng/μ g) of a1, a2, and a3. [H+] is obtained by dividing Mass H + by the inorganic mass in the aerosol collected on the filter. (c) Time profile of Mass H +, color and Mass H +, inorg of b series and c series in as α-pinene ozone SOA coats on the acidic inorganic seed aerosol.
![FIG. 4 (a) Time profile of Mass H +, color and Mass H +, inorg of a1, a2, and a3 in Table 2 as ozonolysis of α-pinene progresses in the presence of the acidic seed aerosol. The proton concentration at time = zero was estimated with Mass H +, inorg . (b) Time profile of the proton concentration [H+] (ng/μ g) of a1, a2, and a3. [H+] is obtained by dividing Mass H + by the inorganic mass in the aerosol collected on the filter. (c) Time profile of Mass H +, color and Mass H +, inorg of b series and c series in Table 2 as α-pinene ozone SOA coats on the acidic inorganic seed aerosol.](/cms/asset/e790f4d2-b1f9-4964-b0c1-e39d6325e75f/uast_a_315652_o_f0004g.gif)
FIG. 5 Proposed mechanisms for the formation of organic sulfate by the reaction of sulfuric acid with organic carbonyls.
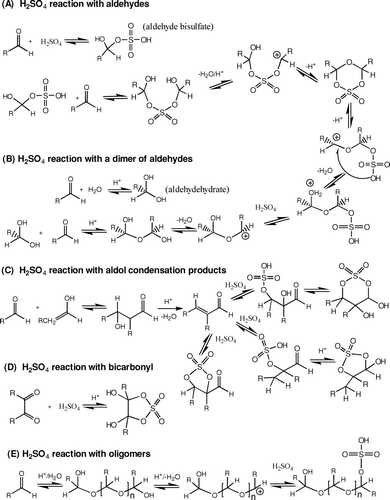
The results of this study strongly suggest that H2SO4 in aerosols can be consumed by other pathways such as the formation of organic sulfates, which has not been considered in conventional titration through the inorganic interaction between H2SO4 and ammonia. The acid dissociation constant (pK a ) of organic bisulfates is unknown. We assume that the pK a of organic bisulfates ranges between H2SO4 (pK a = −5) and the second proton dissociation in bisulfate (HSO4 −, pK a = 2). When organic sulfates are diluted with water, they are hydrolyzed and may return to the original parent compounds (H2SO4 and organic compounds). The concentration of organic sulfates also depends on the sulfuric acid fraction in the aqueous phase. Hence, the conventional extraction procedure with protic solvents such as water and alcohols can modify the properties of the actual aerosol.
The fraction of conversion of sulfuric acid to organic sulfate (f os ) is estimated as follows:
Colorimetric Analysis of the Ambient Particles
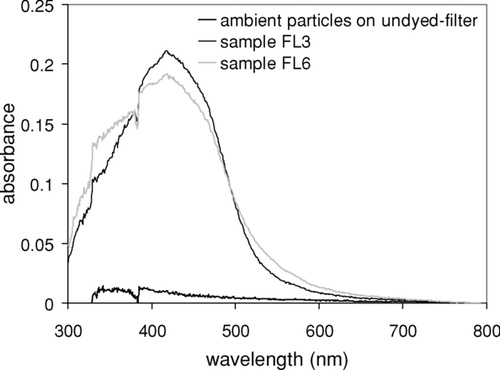
Colorimetric analysis was also applied to the ambient aerosol collected on the dyed filter. summarizes the experimental conditions, UV spectral data, and the resulting Mass H +, color estimated using Equation (Equation10). The duration of the sampling ranged from 20 to 64 min, with a sampling flow rate of 13–13.3 L/min. The colorimetric technique allowed the sampling time to be significantly reduced by 20 min.
shows the UV spectra of the ambient particles collected on the dyed filter and the UV spectrum of ambient particulate matter sampled on the filter with no dye. Our results shows that color changes associated with ambient particle samples is significant and easily separated from the interference of black carbon in the ambient sample as shown in . The absorbance (at λ maxe = 545 nm) of particle acidity of the ambient particulates sampled on the dyed filter was corrected for both the dyed filter blank and the absorbance originating from the natural color (gray) of the ambient particulate matter. The Mass H +, color value was estimated using the slope obtained from the calibration curve (Equation [Equation10]). The feasibility test demonstrates that the applied colorimetry successfully measures the proton concentration present in the ambient sample collected on the methanil yellow-dyed filter. Overall, in our episodes the [H +] (ng/μ g) at the sampling site at Gainesville, FL (0.09–0.38) is higher, than particle acidity in Chapel Hill, NC (0.04–0.28).
FIG. 6 UV-Visible spectra of ambient samples collected on either a dyed filter or a filter with no dye.
Atmospheric Implications and Uncertainty
The colorimetric analysis measures dynamic changes at realistic particle acidities due to the short sampling time and the simple technique using a reflectance UV-Visible spectrometer. Our results are also consistent with those of previous studies (CitationJang et al. 2006a) in showing that aerosol-phase heterogeneous reactions in the presence of an acid catalyst rapidly progress within a short time (minute scale). The present study concludes that the particle acidity in acidic SOA filter samples decreases due to the formation of organic sulfate. The ability of different aerosol systems to form organic sulfates should be compared in future studies. In addition, the feasibility of this study's applied colorimetry methods for ambient aerosol should also be tested to various aerosols in different episodes varying locations coupled with seasons, the sources of air pollutants, and meteorological conditions.
The colorimetric analysis linked to the reflectance UV-Visible spectroscopy is repeatable and sensitive, with a low detection limit of 0.15 ng for the proton mass sampled on the colorimetry filter. This technique is simple and economical because it does not require any workup procedure after particle collection on a filter. The major uncertainty of the colorimetry is the Mass H + value estimated using an inorganic thermodynamic model, as the accuracy of thermodynamic calculation affects the quality of the calibration curve for absorbance at λmaxe = 545 nm vs. Mass H + (Equation [Equation9]). Once the optimal range of proton concentrations covered by a calibration curve is set for the type of dye (e.g., metanil yellow), the filter type, and the dye solution concentration, colorimetric analysis can be successfully employed to measure the proton concentration in the aerosol sample.
This study has focused on the measurement of particle acidity incorporated with acidic sulfate, which is mainly present in the aerosol phase due to low volatility. However, the actual atmosphere contains nitric acid, which is semivolatile and requires a more delicate sampling method due to its volatility. In a future study, colorimetry associated with reflectance UV-Visible spectrometry will be extended into a nitric acid system. Further advancements in instrumental design, as well as in situ and online techniques enabling researchers to maintain equal humidity between the sampling air and instrumentation, will increase the usefulness of this method as a simpler and more economical approach to the measurement of proton concentrations in aerosol.
Acknowledgments
This work was supported by grants from the National Science Foundation (ATM0703941) and the start-up fund at University of Florida.
Notes
a The fraction of sulfuric acid described by [H2SO4]/([NH3]+[H2SO4]) [e.g., 0.33 for (NH4)2SO4; 0.36 at (NH4)2SO4:NH4HSO4 = 4:1; 0.42 at (NH4)2SO4:NH4HSO4 = 2:3; and 0.67 at H2SO4:NH4HSO4 = 1:1].
b Experiments testing the color change by a carboxylic acid.
c M inorg is estimated using Equation (Equation7). The sampling flow rate was 13 L/min.
d The density of inorganic systems is estimated using the method reported by CitationSemmler et al. (2006).
e Absorbance at 545 nm without curve fitting.
f Absorbance at 420 nm and 545 nm with curve fitting.
g The proton concentration, Mass H + , is estimated using M inorg , and the mass fraction of H+ is predicted using a thermodynamic model such as ISORROPIA.
h Using a calibration curve in .
a Temperature for all SOA experiments ranges between 294–295 K. For h and a series data, the composition of inorganic seed aerosol is H2SO4:NH4HSO4 = 1:1. For b and c series data, the seed aerosol is composed of sulfuric acid aqueous solution. M inorg and the mass fraction of protons of b and c series data are corrected to % RH = 45, which was the humidity of the laboratory containing the spectrometer, and are then applied to the estimation of the proton mass concentrations.
b The initial α-pinene concentration.
c The initial ozone concentration.
d The inorganic seed fraction of the total aerosol.
e Estimated using Equation (Equation7). The sampling flow rate is 13 L/min. The density of both inorganic and organic components is 1.4 g/mL.
f The Mass H +, color is the proton concentration estimated using the calibration curve obtained from . The error for Mass H +, color is, on average, 13%.
g The associated error for Mass H +, inorg is, on average, 10%.
h The conversion fraction of sulfuric acid to organic sulfate (f os ) is obtained using Equation (Equation12). n.a.: not applicable.
a The %RH of the laboratory for instrumentation was 40–45%, and the temperature ranged from 294–296 K. The sampling flow rate ranged 13–13.3 L/min.
b The aerosol mass was obtained by weighing the filter mass before and after sampling. The error associated with the aerosol mass is ± 1 μ g.
c The absorbance was corrected for the natural color of the particulate matter and for the dyed filter blank. The spectral data of the ambient filter samples at Chapel Hill, NC (NC series) were monitored using UV-3600 spectrometer and those at University of Florida at Gainesville (FL series), using Lambda 35. The Absλ = 545 in FL series was corrected using a calibration factor (1.48) originated from two different instruments (two different calibration curves).
d The estimation of proton mass was not corrected for different humidity between instrumentation and ambient sampling conditions. The associated error for Mass H +, inorg is, on average, 10%. n.a.: not applicable.
Related Research Data
REFERENCES
- Blando , J. D. and Turpin , B. J. 2000 . Secondary Organic Aerosol Formation in Cloud and Fog Droplets: A Literature Evaluation of Plausibility . Atmos. Environ , 34 : 1623 – 1632 .
- Brock , C. A. , Trainer , M. , Ryerson , T. B. , Neuman , J. A. , Parrish , D. D. and Holloway , J. S. Particle Growth in Urban and Industrial Plumes in Texas . Conference on Atmospheric Chemistry: Urban, Regional, and Global Scale Impacts of Air Pollutants, 4th . Jan. 13–17 2002 , Orlando, FL, United States.
- Brock , C. A. , Washenfelder , R. A. , Trainer , M. , Ryerson , T. B. , Wilson , J. C. , Reeves , J. M. , Huey , L. G. , Holloway , J. S. , Parrish , D. D. , Hubler , G. and Fehsenfeld , F. C. 2002b . Particle Growth in the Plumes of Coal-Fired Power Plants . J. Geophys. Res. [Atmos.] , 107 : AAC9-1 – AAC9/14 .
- Cao , G. and Jang , M. 2007 . Effects of Particle Acidity and UV Light on Secondary Organic Aerosol Formation from Oxidation of Aromatics in the Absence of NOx . Atmos. Environ , 35 : 7603 – 7613 .
- Chu , S.-H. , Paisie , J. W. and Jang , B. W. L. 2004 . PM Data Analysis-A Comparison of Two Urban Areas: Fresno and Atlanta . Atmos. Environ , 38 : 3155 – 3164 .
- Czoschke , N. M. and Jang , M. 2006 . Acidity Effects on the Formation of Á-pinene Ozone SOA in the Presence of Inorganic Seed . Atmos. Environ. , 40 : 437 – 4380 .
- Edney , E. O. , Kleindienst , T. E. , Jaoui , M. , Lewandowski , M. , Offenberg , J. H. , Wang , W. and Claeys , M. 2005 . Formation of 2-Methyl Tetrols and 2-Methylglyceric Acid in Secondary Organic Aerosol from Laboratory Irradiated Isoprene/NOX/SO2/Air Mixtures and Their Detection in Ambient PM2.5 Samples Collected in the Eastern United States . Atmos. Environ , 39 : 5281 – 5289 .
- 1999 . Determination of the strong acidity of atmospheric fine-particles (< 2.5 micrometer) , U.S. EPA, Center for Environmental Research Information, Office of Research and Development . EPA Method IO-4.2
- Gao , S. , Ng , N. L. , Keywood , M. , Varutbangkul , V. , Bahreini , R. , Nenes , A. , He , J. , Yoo , K. Y. , Beauchamp , J. L. , Hodyss , R. P. , Flagan , R. C. and Seinfeld , J. H. 2004 . Particle Phase Acidity and Oligomer Formation in Secondary Organic Aerosol . Environ. Sci. Technol , 38 : 6582 – 6589 .
- Garland , R. M. , Elrod , M. J. , Kincaid , K. , Beaver , M. R. , Jimenez , J. L. and Tolbert , M. A. 2006 . Acid-Catalyzed Reactions of Hexanal on Sulfuric Acid Particles: Identification of Reaction Products . Atmos. Environ , 40 : 6863 – 6878 .
- Grahame , T. and Schlesinger , R. 2005 . Evaluating the Health Risk from Secondary Sulfates in Eastern North American Regional Ambient Air Particulate Matter . Inhal. Toxicol , 17 : 15 – 27 .
- Hansen , J. E. and Sato , M. 2001 . Proceedings of the National Academy of Sciences of the United States of America . 98 : 14778 – 14783 .
- Hinkley , J. T. , Bridgman , H. A. , Buhre , B. J. P. , Gupta , R. P. , Nelson , P. F. and Wall , T. F. 2008 . Semi-Quantitative Characterisation of Ambient Ultrafine Aerosols Resulting from Emissions of Coal Fired Power Stations . Sci. Total Environ , 391 : 104 – 113 .
- Hoffer , A. , Kiss , G. , Blazso , M. and Gelencser , A. 2004 . Chemical Characterization of Humic-Like Substances (HULIS) Formed from a Lignin-Type Precursor in Model Cloud Water . Geophys. Res. Lett , 31 : L06115-1 – L06115/4 .
- Iinuma , Y. , Böge , O. , Gnauk , T. and Herrmann , H. 2004 . Aerosol-Chamber Study of the a-pinene/O3 Reaction: Influence of Particle Acidity on Aerosol Yields and Products . Atmos. Environ , 39 : 761 – 773 .
- Iinuma , Y. , Mueller , C. , Berndt , T. , Boege , O. , Claeys , M. and Herrmann , H. 2007 . Evidence for the Existence of Organosulfates from Beta-Pinene Ozonolysis in Ambient Secondary Organic Aerosol . Environ. Sci. Technol , 41 : 6678 – 6683 .
- Jang , M. , Czoschke , N. M. , Lee , S. and Kamens , R. M. 2002 . Heterogeneous Atmospheric Aerosol Production by Acid-Catalyzed Particle-Phase Reactions . Science , 298 : 814 – 817 .
- Jang , M. , Czoschke , N. M. , Northcross , A. L. , Cao , G. and Shaof , D. 2006a . SOA Formation from Partitioning and Heterogeneous Reactions: Model Study in the Presence of Inorganic Species . Environ. Sci. Technol , 40 : 3013 – 3022 .
- Jang , M. , Ghio , A. and Gang , C. 2006b . Exposure of BEAS-2B Cells to Secondary Organic Aerosol Coated on Magnetic Nanoparticles . Chem. Res. Toxicol , 19 : 1044 – 1050 .
- Jang , M. and Kamens , R. M. 2001 . Atmospheric Secondary Aerosol Formation by Heterogeneous Reactions of Aldehydes in the Presence of a Sulfuric Acid Aerosol Catalyst . Environ. Sci. Technol , 35 : 4758 – 4766 .
- Kalberer , M. , Paulsen , D. , Sax , M. , Steinbacher , M. , Dommen , J. , Prevot , A. S. H. , Fisseha , R. , Weingartner , E. , Frankevich , V. , Zenobi , R. and Baltensperger , U. 2004 . Identification of Polymers as Major Components of Atmospheric Organic Aerosols . Science , 303 : 1659 – 1662 .
- Kanakidou , M. , Seinfeld , J. H. , Pandis , S. N. , Barnes , I. , Dentener , F. J. , Facchini , M. C. , Van Dingenen , R. , Ervens , B. , Nenes , A. , Nielsen , C. J. , Swietlicki , E. , Putaud , J. P. , Balkanski , Y. , Fuzzi , S. , Horth , J. , Moortgat , G. K. , Winterhalter , R. , Myhre , C. E. L. , Tsigaridis , K. , Vignati , E. , Stephanou , E. G. and Wilson , J. 2005 . Organic aerosol and global climate modelling: A review . Atmos. Chem. Phys. , 5 : 1053 – 1123 .
- Kiss , G. , Tombacz , E. , Varga , B. , Alsberg , T. and Persson , L. 2003 . Estimation of the Average Molecular Weight of Humic-Like Substances Isolated from Fine Atmospheric Aerosol . Atmos. Environ. , 37 : 3783 – 3794 .
- Lee , S. , Jang , M. and Kamens , R. M. 2004 . SOA Formation from the Photooxidation of a-Pinene in the Presence of Freshly Emitted Diesel Soot Exhaust . Atmos. Environ , 38 : 2597 – 2605 .
- Levitt , N. P. , Zhao , J. and Zhang , R. 2006 . Heterogeneous Chemistry of Butanol and Decanol with Sulfuric Acid: Implications for Secondary Organic Aerosol Formation . J. Phys. Chem. A , 110 : 13215 – 13220 .
- Lewandowski , M. , Jaoui , M. , Kleindienst , T. E. , Offenberg , J. H. and Edney , E. O. 2007 . Composition of PM2.5 During the Summer of 2003 in Research Triangle Park, North Carolina . Atmos. Environ , 41 : 4073 – 4083 .
- Liggio , J. , Li , S.-M. and McLaren , R. 2005 . Heterogeneous Reactions of Glyoxal on Particulate Matter: Identification of Acetals and Sulfate Esters . Environ. Sci. Technol , 39 : 1532 – 1541 .
- Limbeck , A. , Kulmala , M. and Puxbaum , H. 2003 . Secondary Organic Aerosol Formation in the Atmosphere via Heterogenous Reaction of Gaseous Isoprene on Acidic Particles . Geophys. Res. Lett. , 30 : ASC6-1 – ASC6/4 .
- Maisonet , M. , Bush , T. J. , Correa , A. and Jaakkola , J. J. 2001 . Relation Between Ambient Air Pollution and Low Birth Weight in the Northeastern United States . Environ. Health Perspect , 109 ( Suppl 3 ) : 351 – 356 .
- McMurry , P. H. and Grosjean , D. 1985 . Gas and Aerosol Wall Losses in Teflon Film Smog Chambers . Environ. Sci. Technol. , 19 : 1176 – 1182 .
- Nakano , N. , Yamamoto , A. , Kobayashi , Y. and Nagashima , K. 1993 . Development of a Monitoring Tape for Hydrogen Chloride Gas Using Metanil Yellow . Analyst , 118 : 1539 – 1542 .
- Nenes , A. , Pandis , S. N. and Pilinis , C. 1998 . ISORROPIA. A New Thermodynamic Equilibrium Model for Multiphase Multicomponent Inorganic Aerosols . Aquatic Geochem , 4 : 123 – 152 .
- Northcross , A. L. and Jang , M. 2007 . Increases in Heterogeneous SOA Yield from Ozonolysis of Monoterpenes . Atmos Environ. , 41 : 1483 – 1493 .
- Peltier , R. E. , Sullivan , A. P. , Weber , R. J. , Brock , C. A. , Wollny , A. G. , Holloway , J. S. , de Gouw , J. A. and Warneke , C. 2007 . Fine Aerosol Bulk Composition Measured on WP-3D Research Aircraft in Vicinity of the Northeastern United States—Results from NEAQS . Atmos. Chem. Phys , 7 : 3231 – 3247 .
- Reemtsma , T. , These , A. , Venkatachari , P. , Xia , X. , Hopke , P. K. , Springer , A. and Linscheid , M. 2006 . Identification of Fulvic Acids and Sulfated and Nitrated Analogues in Atmospheric Aerosol by Electrospray Ionization Fourier Transform Ion Cyclotron Resonance Mass Spectrometry . Anal. Chem , 78 : 8299 – 8304 .
- Semmler , M. , Luo , B. P. and Koop , T. 2006 . Densities of liquid H+/NH4 +/ SO4 2−/NO3 −/H2O solutions at tropospheric temperatures . Atmos. Environ , 40 : 467 – 483 .
- Surratt , J. D. , Kroll , J. H. , Kleindienst , T. E. , Edney , E. O. , Claeys , M. , Sorooshian , A. , Ng , N. L. , Offenberg , J. H. , Lewandowski , M. , Jaoui , M. , Flagan , R. C. and Seinfeld , J. H. 2007a . Evidence for Organosulfates in Secondary Organic Aerosol . Environ. Sci. Technol , 41 : 517 – 527 .
- Surratt , J. D. , Lewandowski , M. , Offenberg , J. H. , Jaoui , M. , Kleindienst , T. E. , Edney , E. O. and Seinfeld , J. H. 2007b . Effect of Acidity on Secondary Organic Aerosol Formation from Isoprene . Environ. Sci. Technol. , 41 : 5363 – 5369 .
- Takahama , S. , Davidson , C. I. and Pandis , S. N. 2006 . Semicontinuous Measurements of Organic Carbon and Acidity during the Pittsburgh Air Quality Study: Implications for Acid-Catalyzed Organic Aerosol Formation . Environ. Sci. Technol , 40 : 2191 – 2199 .
- Tolocka , M. P. , Jang , M. , Ginter , J. M. , Cox , F. J. , Kamens , R. M. and Johnston , M. V. 2004 . Formation of Oligomers in Secondary Organic Aerosol . Environ. Sci. Technol , 38 : 1428 – 1434 .
- Zahardis , J. , LaFranchi , B. W. and Petrucci , G. A. 2006 . Direct Observation of Polymerization in the Oleic Acid-Ozone Heterogeneous Reaction System by Photoelectron Resonance Capture Ionization Aerosol Mass Spectrometry . Atmos. Environ , 40 : 1661 – 1670 .
- Zhang , Q. , Jimenez , J. L. , Worsnop , D. R. and Canagaratna , M. 2007 . A Case Study of Urban Particle Acidity and Its Influence on Secondary Organic Aerosol . Environ. Sci. Technol , 41 : 3213 – 3219 .