Abstract
Airborne concentration of micron-sized particulate matter (PM) is an important index of indoor air quality. While human activity is considered the main reason causing indoor particle resuspension, theoretical particle adhesion force models give predictions of adhesion force much larger than the disturbance forces introduced by human activity. This work suggests that the imperfect contact between particles and surfaces can greatly reduce the adhesion bond. Electrostatic detachment method is used to measure the actual adhesion force distribution of micron-sized particles to such common indoor flooring materials as vinyl and rubber. Comparisons are made between the theoretical predictions and experimental measurements. Factorial experiments are also designed to study the influence of particle type, flooring type and contact time on particle adhesion force.
INTRODUCTION
Airborne concentration of micron-sized particulate matter (PM), such as pollen, fungal spores, and smoke, is an important index of indoor air quality. The Environmental Protection Agency (CitationEPA 1997) defines “inhalable particles” as having an aerodynamic diameter smaller than 10 μm (PM10) and capable of depositing in the respiratory system. The EPA defines “respirable particles” as having an aerodynamic diameter smaller than 2.5 μm (PM2.5) and capable of penetrating into the lungs. Micron-sized particulate sources are commonly found in the enclosed indoor environment. Researches (NIEHS 1997; CitationDockery 2001; CitationClancy et al. 2002; CitationGold et al. 2005; CitationSarnat et al. 2006) have demonstrated the strong correlation between the changes in airborne particulate concentration and human health.
Human activity is considered the main reason causing indoor particle resuspension, which leads to human secondary exposure to PM (CitationClayton et al. 1993; CitationKamens et al. 1991; CitationLefcoe and Inculet 1975; CitationLioy et al. 1990; CitationRaunemaa et al. 1989; CitationThatcher and Layton 1995). Research (CitationHu et al. 2005) shows that the disturbance forces on particles introduced by human activity are a few orders of magnitude lower than the particle adhesion force predicted by theoretical models. Although this result may lead to the intuitive conclusion that indoor particles can hardly be resuspended by human activity, the strong dependence of indoor air particulate concentrations on human activity is obvious, based on both phenomenological observation and reported research. It is suggested in this study that imperfect contact and limited contact time between particles and surfaces can greatly reduce the actual adhesion force magnitudes. When the adhesion force under imperfect contact is comparable to the disturbance forces from human activity, resuspension can happen for micron-sized particles.
This study intends to measure the actual adhesion force distribution of micron-sized particles to such common indoor flooring materials as vinyl and rubber with electrostatic detachment method. Comparisons are made between the theoretical predictions and experimental measurements. Factorial experiments are also designed to study the influence of particle type, flooring type, and contact time on micron-sized particle adhesion force.
EXPERIMENTAL SETUP
Principles of Electrostatic Detachment Method
Electrostatic detachment method has been used in the study of adhesion force between particles and substrates (CitationFukuchi and Takeuchi 1998; CitationNagayama and Takeuchi 2000). The basic principle of this method is to charge the particles residing on the surface of a plate by induction and to detach the charged particles from the plate with a controlled electrostatic field. The particle adhesion force F adh can be determined by measuring the electrostatic field strengthE and the induction charge q p carried by the particles, as shown in Equation (Equation1).
In the force balance of Equation (Equation1), the gravitational force F g is neglected due to its small magnitude as compared to the adhesion force (CitationHu et al. 2005), and the adhesion force is approximated by the electrostatic detaching force F e . shows the basic testing setup of the electrostatic detachment method.
FIG. 1 Electrostatic detachment method for particle adhesion force measurement
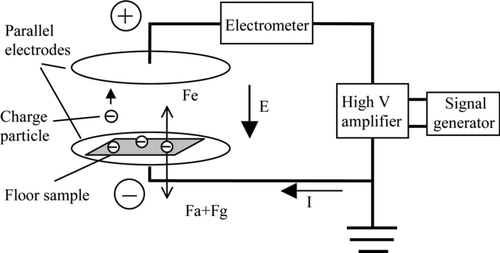
High voltage is applied on the parallel electrode plates (capacitor) to create an electrostatic field within the space of the two plates. A floor sample with micron-sized particles dispersed on the surface is placed on the lower electrode plate. The direct current (DC) voltage applied to the electrodes is increased at a constant rate of 5 V/s from zero to a preset voltage. A DAQ board (PCI-6259, National Instrument, USA) is used to output the DC voltage signal from 0 to 10 v. A high voltage amplifier (AMS-10B2, Matsusada, Japan) is used to amplify the low voltage signals from the DAQ board into high-voltage profiles. As the field strength between the two electrode plates increases with the increasing voltage, the induction charge on particles residing on floor sample increases. The increases of both field strength and particle charges lead to the increase of electrostatic detaching force on surface particles. When the electrostatic force is strong enough to overcome the adhesion force and gravitational force, particles begin to jump from the floor sample surface to the upper electrode plate under the electrostatic force. The transfer of charged particles from one electrode to the other introduces an electric current. The occurrence of the particle detachment is observed by measuring such electric current flowing between the electrodes with an electrometer (6514, Keithley, USA) in the circuit. The measured current can be expressed in Equation (Equation2).
With Equation (Equation2), given that C and dV/dt are known, I particle (t) can be solved with measured I(t). Then, if the detached particles are of single diameter, the number of particles undergoing plate-to-plate transfer during the experiment can be solved as a function of time, as shown in Equation (Equation3).
The saturation limit of induction charge q s , carried by each dielectric particle under electrostatic field, can be determined by the charge model of Equation (Equation4) (CitationWu et al. 2004).
It takes time for particle charge to reach saturation level under electrostatic field. In practice, the saturation charging time can be defined as the time that particles take to achieve 95% of q s . Equation (Equation6) is used to calculate the saturation charging time t charge of particles.
For alumina particles, ρ is 5.0× 10⁷Ω · m and ε is 4.5× 10− 11 C 2/(N · m 2) (CitationWu et al. 2004). Thus, the charging time needed for alumina particles to achieve 95% of the saturation induction charge is about 6.64 × 10− 3s. It can be concluded from this value that induction charging is a very quick process. When the capacitor voltage is increased at a slow rate, such as 5 V/s, it is assumed that the particles have achieved saturation charge before the detachment. The reasonability of this assumption is to be tested in following experiments.
Particle Size Distribution
Two types of micron-sized polydisperse particles are studied in this experiment: alumina and Bacillus Thuringiensis spore. The size distribution of the alumina particles is measured with an optical particle counter (Spectro .3, CLiMET, USA) and the size distribution of the spore particles is measured with an optical particle counter (Mastersizer 2000, Malvern, USA).
For polydisperse particles, the total particle mass M poly and total particle charge Q poly can be calculated by Equation (Equation7) and Equation (Equation8), based on the measured particle size distribution.
The values of d S and d V for the spore and alumina particles can be calculated based on the measured particle size distribution. A conception of equivalent diameter is introduced here for the study of electrostatic charging of polydisperse particles. The relationships between polydisperse particles and equivalent monodisperse particles are shown by Equation (Equation9) and Equation (Equation10).
When particle charge/mass ratio is considered, polydisperse particles of number n with d V and d S can be represented by monodisperse particles of number n e with a diameter of d e . When the polydisperse particles have the same total mass as the equivalent monodisperse particles, both of the particles should have the same total surface area and thus can acquire the same saturation charge. In the following analysis, all the polydisperse particles will be represented by corresponding equivalent monodisperse particles for comparison convenience, when charge/mass ratios are of concern.
From the above equations, the equivalent diameter and number of equivalent particles can be calculated by Equation (Equation11) and Equation (Equation12).
TABLE 1 Characteristic diameters of polydisperse particles
EXPERIMENTAL DESIGN FOR MEASURING ADHESION FORCE DISTRIBUTION
An experiment is designed to measure the actual adhesion force distribution between particles and common indoor flooring materials. In this experiment, two types of particles are studied: Bacillus Thuringiensis spore and alumina. These two particle types represent organic and mineral particles, respectively. In the adhesion force measurement experiments, two flooring materials are used as the particle contacting surfaces: vinyl tile and rubber tile. These materials are commonly used for indoor flooring and have flat surfaces. Both particle types were tested for each of the two floor materials.
Floor samples from brand-new and clean flooring materials are prepared in 9 × 9 cm2 plates and placed on the bottom of a particle dispersion box (PDB) after cleaned by vacuum. Micron-sized particles are injected into the top space of the PDB by pressurized air. During the injection process, four small fans within the PDB are used to mix the injected particles with the air in the PDB to generate a uniform aerosol of the particles. The suspended particles are left in the PDB to deposit freely onto the surface of floor samples. The density of alumina is 3.95 g/cm3 and the density of spore is 1.30 g/cm3. The particle mass load on each sample surface is about 3 mg/cm2 for alumina and about 1 mg/cm2 for spore particles. An ideal-even distribution can lead to multi-layers of particles on the flooring surface under these loads, but, in the experiments, the flooring surfaces are not fully covered by particles with such loads mainly due to particle agglomeration. As the mean volume diameters of the two particles are close to each other (), the surface particle number concentrations ratio between these two types of particles is close to 1. Three days after the particle injection, floor samples are taken out of the PDB for experiments.
Before a detachment experiment, the mass of a floor sample with particles on the surface is measured by an analytical balance (AAA, Adam, USA) with a resolution of 0.1 mg. Then, the floor sample is placed on the lower plate of the capacitor as shown in . The distance between the two parallel plates is 1 cm. The voltage between the capacitors is increased at a constant rate of 5 V/s. The field strength is initially increased from 0 kV/cm to 4 kV/cm and the capacitor charging current is measured and recorded during the process. After the field strength reaches 4 kV/cm, the applied voltage is reduced to zero and the floor sample is taken out to measure the mass change due to particle transfer. The particles transferred to the upper plate are wiped off. Then the floor sample is placed back into the capacitor. This procedure is repeated two times, with terminal field strength of 6 kV/cm and 8 kV/cm, respectively.
All the experiment procedure is carried out in a lab with an area of about 25 m2. Because relative humidity is a very important factor to influence particle adhesion force (CitationHinds 1999), a dehumidifier (DH 540EL, Goldstar, USA) is used in the lab to maintain a relative humidity level of 40% ± 2.5%.
Before the induction charge model of Equation (Equation4) can be used with measured particle mass transfer to determine the particle adhesion force distribution, the applicability of this model needs to be validated. For the validation purpose, the measured mass of transferred particles is compared with the particle mass calculated from measured transfer charge and particle induction model, as indicated by Equation (Equation3).
Factorial Experimental Design on Adhesion Force
Factorial experiments are also designed to study the influence of such factors as particle type, floor type, and contact time on particle adhesion force.
In order to have a better study of the flooring type influence, one more flooring material, brand-new round-loop carpet with 3 mm loop-layer thickness, is added for this factorial analysis. Thus, three types of flooring materials are studied in the factorial analysis: round-loop nylon carpet, vinyl tile, and rubber tile. These materials are widely used in the indoor environment. The particles to be studied are alumina and spores, the same as mentioned above. With the PDB, particles are dispersed on the surfaces of floor samples, each with an area of 9× 9 cm2. Two surface-contact time lengths for particles are considered: 1 day and 10 days.
For each type of particles, 18 floor samples are prepared to accommodate the study on 3 flooring types and 2 contact time lengths, with 3 repetitions for each combination of flooring material and contact time length. With this arrangement, there are 36 floor samples in total to be tested in the experiments.
The consideration of floor sample surface particle load is the same as that in the experiments of adhesion force measurement, which is about 3 mg/cm2 for alumina and about 1 mg/cm2 for spore particles. One day after the particles are dispersed into the PDB, half of the 18 floor samples, 3 for each flooring material, are randomly picked out for electrostatic detachment experiments, while the other half are tested 10 days after the dispersion in order to study the contact time effects on adhesion force distribution. As in the adhesion force measurement experiments, the relative humidity of the lab is controlled at 40% ± 2.5%.
This is a three factor factorial design. For simplicity, the response variable is the particle mass transfer ratio after the field strength is gradually increased to 8 kV/cm.
RESULTS AND ANALYSIS
Validation of Particle Charging Model
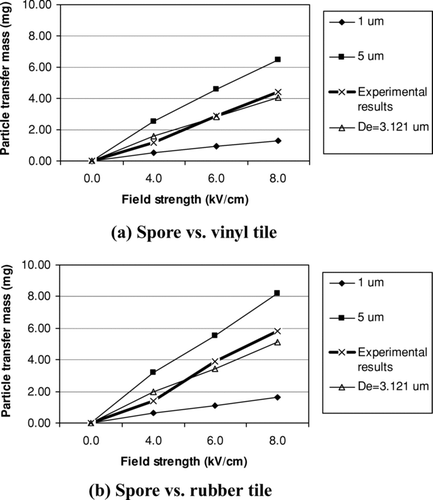
With the measured charging current of the detachment experiments, the particle transfer mass can be calculated based on the particle charging model (Equation [4]). Then, the calculated mass transfer is compared with the measured particle mass transfer. With the introduction of equivalent monodisperse diameter, it is possible to use equivalent diameter to represent polydisperse particles for the induction charge/mass property comparisons, as shown in and .
FIG. 2 Mass transfer comparisons for alumina particles.
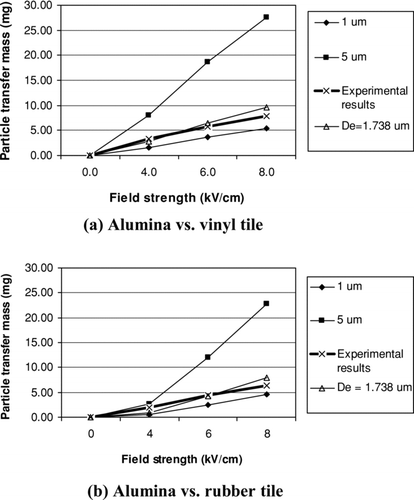
FIG. 3 Mass transfer comparisons for spore particles.
In , lines of 1 μ m and 5 μ m represent the calculated transfer mass of monodisperse particles with diameter of 1 μm and 5 μm, respectively, given the measured transfer charge and induction charge model. The line of “D e = 1.738 μm” is calculated for monodisperse particles with the equivalent diameter of the alumina particles under test. These three calculated lines are compared with the measured particle transfer mass in the plot. shows that the measured transfer mass line lies between the lines of 1 μ m and 5 μ m, and is very close to the equivalent diameter line. From this comparison, it can be concluded that the particle induction charge model is applicable in this study and the alumina particles can be considered as being charged to saturation before being pulled away from attaching surface.
shows the similar comparison results for the spore particles. Thus for different combinations of particles and substrates, the induction charge model as shown in Equation (Equation4) is validated and thus can be used for the calculation of particle adhesion force.
Adhesion Force Distribution Measurements and Comparisons
With the measured particle transfer mass, the validated particle induction charging model can be used to calculate the particle adhesion force distribution. shows the measured adhesion force distributions for the alumina and the spore particles.
FIG. 4 Particle adhesion force distribution.
The theoretical adhesion force F
adh,theo
of the polydisperse particles can be calculated by Equation (Equation12) (CitationHinds 1999) with mean particle diameter ![]() .
.
shows the comparison between measured particle adhesion force distributions and the theoretically calculated adhesion force from Equation (Equation13).
TABLE 2 Comparison between calculated and experimental adhesion force
shows that, for both the alumina and the spore particles, there is a significant portion of particles with adhesion forces that are much smaller than the theoretically calculated adhesion forces, but larger than the gravitational force. The major reason for this is considered to be the imperfect contact between particles and indoor surfaces, which in turn makes the indoor particles more possible to be resuspended by human activity.
It can also be concluded that, on such flat surfaces as vinyl and rubber tiles, the adhesion force of alumina is generally larger than that of spore particle, given similar particle size distribution. For alumina, about 25% of all the particles on the surface have adhesion forces less than the value of 1.08× 10− 10N. For spore particles, about 40% of all the particles have adhesion forces less than the value of 2.93× 10− 11N. Under the same electrostatic field strength, the mass transfer ratio of alumina is much smaller than that of spores.
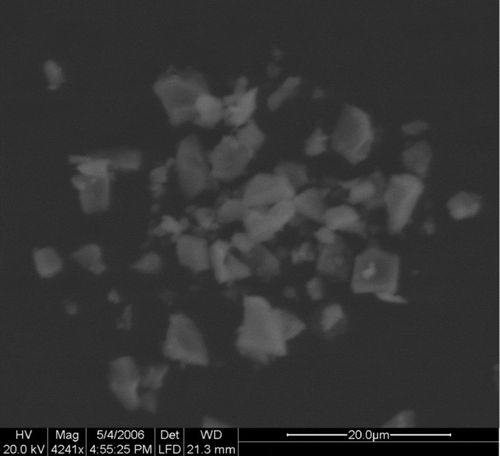
is a photo of the surface alumina particles, taken with electronic scanning microscope (Fei Quanta 200 ESME). This photo shows that the irregular shape of particles and particle clustering greatly reduced the contact area between particles and flat surface. The reduced adhesion force makes surface particles apt to be resuspended under such exterior disturbance as human activity.
FIG. 5 Surface alumina particles under SEM.
Factorial Analysis
Although this is a three-factor factorial experiment, the three-way interaction among the three factors is not easy to interpret and is not of the research interest here. Thus, the 36 tests are classified into two groups based on the test time. The first group includes the 18 floor samples tested one day after particle dispersion, while the second group includes the other 18 floor samples tested 10 days after the dispersion.
The statistical software Minitab is used to analyze the test results. A two way analysis of variance (ANOVA) is carried out with particle type and flooring type as the two factors and particle mass transfer ratio as the response. The statistical analysis results are reported in .
TABLE 3 Statistical analysis for particle adhesion force
The p values for interaction are 0.030 for 1-day deposition and 0.001 for 10-day deposition, which are both smaller than normally used significance level of 0.05. This means the interaction between flooring type and particle type on particle adhesion force is significant. The p values for factor “particle type” and factor “flooring type” are also smaller than 0.05, which means the particle type and flooring type each can have great influence on particle adhesion force. For a better interpretation of the factor effect on particle adhesion force, the mean mass transfer ratio for the experiments are shown in .
FIG. 6 Mean mass transfer ratio plot.
In , the nonparallel property of mass transfer ratio of alumina and spore particles on both 1-day deposition and 10-day deposition shows the strong interaction between particle type and floor type.
For 1-day deposition, it can be observed that the mass transfer ratio of spore is much larger than that of alumina on the rubber floor, as compared to the carpet floor and vinyl floor. When the three floor materials are compared, the carpet gives the strongest adhesion forces to particles while the rubber floor adhere particles most loosely to its surface.
For 10-day deposition, alumina particles, again, show larger adhesion forces on rubber tiles and vinyl tiles than spore particles. However, on carpet floor, the adhesion bond between carpet and spore become stronger than that between carpet and alumina after a contact of 10 days.
Because the strong interaction between particle and flooring type on particle adhesion force, the time effects on adhesion force are to be tested on each combination of particle and floor material, as shown in . The one day group represents freshly deposited particles, while the other group has ten days to allow possible increase in adhesion force due to time effect.
TABLE 4 Analysis of time effects on adhesion force
From , it can be seen that there is a general decrease trend of particle mass transfer ratio as the contact time between particles and surfaces increases. This means the adhesion forces between particles and surfaces increase as contact time increase. The p values from one way ANOVA also show that most of the experiments detect significant time effects on particle adhesion force. A practical meaning of this finding is that freshly deposited particles have a lower adhesion bond with the surface and thus, are much easier to be resuspended from the surface than particles with a long contact time with surfaces. Besides the particle type and flooring type, contact time of particles is also an import factor that needs to be specified in order to determine particle adhesion force to surface.
CONCLUSIONS
Electrostatic detachment method is used in this work to measure the adhesion force between particles and common indoor flooring materials. The experimental results first validated the applicability of induction charge model in the adhesion force measurement. Experimental measurements show that there are large portions of deposited particles that have adhesion forces much smaller than the theoretical predictions. For the measured alumina particles (d e = 1.738 μm), about 25% of all particles on the surface of vinyl and rubber tiles have adhesion forces below the value of 1.08× 10− 10 N. For the measured spore particles (d e = 3.121 μm), about 40% of all the particles have adhesion forces below the value of 2.93× 10− 11 N. These values are a few orders of magnitude lower than those predicted by the theoretical model, mainly due to imperfect contact.
Particle type, flooring type and particle–surface contact time are all important factors that can influence particle adhesion force and hence, particle resuspension phenomena. The experiments in this study also show that, with similar size distribution, alumina particles generally have higher adhesion forces than spore particles on flat surfaces. The adhesion force of newly deposited particles is lower than that of aged surface particles, which means a higher resuspension coefficient can be achieved for newly deposited particles given the same disturbance input. The interaction effects on adhesion force between particle type and flooring type are significant. For example, for 1-day deposition experiment, although particle adhesion force generally decrease from vinyl surface to rubber surface, such decrease trend is more obvious for spore particles than for alumina particles.
The support of this work by US Army Center for Health Promotion and Preventive Medicine (USACHPPM) contracts DABJ05-03-P-1210 and W91ZLK-05-P-0838 is gratefully acknowledged.
Notes
∗Shaping factor d Vi /d Si is 0.7752 for individual particle (CitationWu et al. 2005)
∗At field strength of 8 kV/cm.
∗∗The Hamaker constant is assumed to be 10 × 10− 20.
Related Research Data
REFERENCES
- Clancy , L. , Goodman , P. , Sinclair , H. and Dockery , D. W. 2002 . Effect of Air-Pollution Control on Death Rates in Dublin, Ireland: An Intervention Study . Lancet , 360 ( 9341 ) : 1210 – 1214 .
- Clayton , C. A. , Wallace , L. A. , Ozkaynak , H. and Spengler , J. D. 1993 . Particle Total Exposure Assessment Methodology (PTEAM) Study: Distributions of Aerosol and Elemental Concentrations in Personal, Indoor, and Outdoor Air Samples in a Southern California Community . J. Expos. Anal. Envir. Epidemi. , 6 : 227 – 250 .
- Dockery , D. W. 2001 . Epidemiologic Evidence of Cardiovascular Effects of Particulate Air Pollution . Environ Health Perspect , 109 ( Suppl 4 ) : 483 – 486 .
- EPA . 1997 . Exposure Factors Handbook , 5 – 5 . Washington, DC : USEPA . Environmental Protection Agency
- Fukuchi , Y. and Takeuchi , M. 1998 . A comparative Study on Toner Adhesion Force Measurements by Toner Jumping and Centrifugal Methods . 1998 International Conference on Digital Printing Technologies . 1998 .
- Gold , D. R. , Litonjua , A. A. , Zanobetti , A. , Coull , B. A. , Schwartz , J. , MacCallum , G. , Verrier , R. L. , Nearing , B. D. , Canner , M. J. , Suh , H. and Stone , P. H. 2005 . Air Pollution and ST-Segment Depression in Elderly Subjects . Environ. Health Perspect , 113 ( 7 ) : 883 – 887 .
- Hinds , W. C. 1999 . Aerosol Technology: Properties, Behavior, and Measurement of Airborne Particles , New York : John Wiley & Sons, Inc. .
- Hu , B. , Freihaut , J. , Gomes , C. and Bahnfleth , W. 2005 . Literature Review and Parametric Study: Indoor Particle Re-Suspension by Human Activities . Proceedings of the 10th International Conference on Indoor Air Quality and Climate . 2005 , Beijing, China.
- Kamens , R. , Lee , C. , Wiener , R. and Leith , D. 1991 . A Study to Characterize Indoor Particle in Three Non-Smoking Homes . Atmos. Environ. , 25A : 939 – 948 .
- Lefcoe , N. M. and Inculet , I. I. 1975 . Particulates in Domestic Premises II. Ambient Levels and Indoor-Outdoor Relationships . Arch. Envir. Health , 30 : 565 – 570 .
- Lioy , P. J. , Waldman , J. M. , Buckley , T. , Butler , J. and Pietarinen , C. 1990 . The Personal Indoor, and Outdoor Concentrations of PM-10 Measured in an Industrial Community During the Winter . Atmos. Environ. , 24B : 57 – 66 .
- Nagayama , M. and Takeuchi , M. 2000 . Particle Adhesion Force Measurement by Electric Field Detachment Method . 2000 International Conference on Digital Printing Technologies . 2000 .
- National Institute of Environmental Health Sciences (NIEHS) . 1997 . Fact Sheet #9 “ASTHMA and its Environmental Triggers: Scientists Take A Practical New Look at a Familiar Illness
- Raunemaa , T. , Kulmala , M. , Saari , J. , Olin , M. and Kulamala , M. H. 1989 . Indoor Air Aerosol Model: Transport Indoors and Deposition of Fine and Coarse Particles . Aerosol Sci. Technol. , 11 : 11 – 25 .
- Sarnat , S. E. , Suh , H. H. , Coull , B. A. , Schwartz , J. , Stone , P. H. and Gold , D. R. 2006 . Ambient Particulate Air Pollution and Cardiac Arrhythmia in a Panel of Older Adults in Steubenville Ohio . Occup. Environ. Med. , 6
- Thatcher , T. L. and Layton , D. W. 1995 . Deposition, Resuspension and Penetration of Particles within a Residence . Atmos. Environ. , 29 ( 13 ) : 1487 – 1497 .
- Wu , Y. , Castle , G. S. P. , Inculet , I. I. , Petigny , S. and Swei , G. S. 2004 . The Effect of Electric Field Strength on the Induction Charge of Freely Levitating Particles . IEEE Transaction on Industry Application , 40 ( 6 ) : 1498 – 1502 .
- Wu , Y. , Castle , G. S. P. and Inculet , I. I. 2005 . Induction Charging of Granular Materials in an Electric Field . IEEE Transaction on Industry Application , 41 ( 5 ) : 1350 – 1357 .