Abstract
The significant and largely unregulated presence of ultrafine particles in the atmosphere is a growing environmental concern. Understanding the formation and sources of ambient ultrafine particles represents a major goal, but analyzing such small particles is a considerable analytical challenge. This study demonstrates how real-time measurements of particle size and chemistry, coupled with gas-phase measurements, can provide unique insight into the daily and seasonal variations of the sources and chemistry of ultrafine particles. Measurements of ambient ultrafine particles are compared from three different single particle techniques which provide high temporal resolution during the 2005 summer (August) and fall (November) seasons in Riverside, CA in conjunction with the Study of Organic Aerosols at Riverside (SOAR) field campaign. During both seasons, vehicle exhaust emissions strongly contributed to the ultrafine particle concentrations during the weekday morning rush hour periods. SMPS measurements during the summer season showed high ultrafine particle concentrations during the afternoons most likely formed by photochemical events. In this study, different sources (and hence chemistry) contributed to the particles during periods of high ultrafine particle concentrations. Therefore, it is important to obtain simultaneous information on ultrafine particle sources as well as concentrations and advance beyond relying just on ultrafine particle concentrations as a proxy in future studies on health effects.
INTRODUCTION
High concentrations of atmospheric ultrafine particles (aerosols with diameters less than 100 nm) have been observed worldwide, from arctic areas and remote regions to coastal marine locations and urban environments (CitationKulmala et al. 2004). Growing evidence suggests that the inhalation of ultrafine particles may have more adverse health effects than larger particles has raised interest in the sources and atmospheric processing of these particles (Cohen 2005). Ambient particles can be divided into two basic categories based on their production mechanism: primary, which are directly emitted from sources such as vehicles and industrial processes, and secondary, which are formed via gas-to-particle conversions (Harrison et al. 2003). The formation and growth of secondary ultrafine particles during nucleation events have been the focus of intensive research recently, leading to the proposal of several different formation mechanisms (CitationZhang and Wexler 2002; CitationKulmala et al. 2004; CitationZhang et al. 2004). From a regulation perspective, it is important to be able to distinguish the origin of the ultrafine particles, as primary and secondary particles require different means of control (direct emissions versus gaseous precursors).
The small size of ultrafine particles makes them much more challenging to detect than larger particles. Despite accounting for greater than 80% of the number of particles in PM2.5 (particulate matter with diameters less than 2.5 μ m), estimates suggest that ultrafine particles collectively represent very little mass (< 20%) (CitationWoo et al. 2001; Harrison et al. 2003; CitationRodríguez et al. 2007). Therefore, PM2.5 regulations based on mass concentrations do not provide a good control for the concentrations of ultrafine particles (CitationWatson et al. 2006). The poor correlation between PM2.5 and ultrafine particles suggests that number-based measurements may be better suited for studying ultrafine particles than a bulk PM2.5 mass approach. Size-fractionated mass measurements by a NanoMOUDI (Nano-micro orifice uniform deposit impactor) have been obtained (CitationChow and Watson 2007), but the continuous sampling time required to collect sufficient material for mass and chemical analysis can be as long as two weeks (CitationSardar et al. 2005). With such long sampling periods, it is difficult to extract details about specific short-lived ultrafine particle episodes (CitationWoo et al. 2001; CitationStanier et al. 2004; CitationWatson et al. 2006), which can be captured by high temporally resolved continuous measurements. Techniques that rely on optical detection are problematic, because as the particle diameter becomes increasingly smaller than the wavelength of light, the intensity of the scattering signal quickly plummets; the minimum practical observable particle size using optical techniques commonly is ∼ 100 nm (Mark 1998; CitationHinds 1999). Therefore, in order to efficiently detect ultrafine particles optically, it is necessary to enhance previously developed instrumentation. Several approaches have been tried successfully, such as growing small particles into detectable sizes for counting via the condensation particle counter (CPC) (CitationSem 2002) or by using specific critical orifices to create an upstream pressure that focuses particles of a given size range such as with the single particle mass spectrometer known as RSMS (CitationLake et al. 2003; CitationPhares et al. 2003; CitationRhoads et al. 2003).
The main goals of this study involve comparing the seasonal variability of ultrafine particle concentrations in Riverside, CA from three different techniques with high temporal resolution and to use the combined data in conjunction with other peripheral instrumentation for deriving a better understanding of ultrafine particle chemistry. Riverside is located east of the Los Angeles (LA) Basin and, due to generally consistent meteorological patterns, is regularly downwind of the pollutants emitted in the LA area. The instruments used in this study include a scanning mobility particle sizer (SMPS), an ultrafine condensation particle counter (UF-CPC), and an ultrafine aerosol time-of-flight mass spectrometer (UF-ATOFMS). Supporting data from co-located gas- and particle-phase instruments, as well as meteorological measurements, are used to provide additional insight into the origin of the ultrafine particles.
EXPERIMENTAL
Sampling on the campus of the University of California, Riverside (33°58′ 18′′ N, 117°19′ 22′′ W) during the summer (July–August) and fall (October–November) of 2005 occurred in conjunction with the Study of Organic Aerosols at Riverside (SOAR) field campaign. Details on the sampling location and inlets of the mobile laboratory can be found elsewhere (Qin et al. in preparation). provides the acronym, model, measurement, and sampling interval for each instrument used in this manuscript. All instrumentation, except for the CPCs and summer CO analyzer, were housed in a mobile laboratory; the other instruments were located in nearby trailers with similar sampling inlets (PM2.5 inlet cutoffs and reflective insulation wrap on the sampling lines). Ambient temperature, relative humidity (RH), and photosynthetically active radiation (PAR) measurements were provided by the Goldstein group of the University of California, Berkeley. The work presented here focuses on one week of data collected in the summer (Sunday, August 7 through Saturday, August 13) and fall (Sunday, November 6 through Saturday, November 12) seasons. Though Santa Ana events, characterized by dry easterly winds, tend to occur during fall and winter months, they do not represent the average fall conditions. Therefore, the representative fall week for this study does not contain any Santa Ana events (Qin et al. manuscript in preparation). Results are presented in Pacific Standard Time (PST), which is one hour behind local time during the summer.
TABLE 1 Instrumentation
It is important to briefly review the main operating principles of each instrument in order to understand how the measurements are made and upon which aerosol properties they depend. In this study, ultrafine particles are defined as having diameters less than 100 nm; although, each of the techniques in this study use different size metrics. CPCs provide continuous real-time ambient number concentration measurements by optically counting particles upon which a vapor has condensed. The CPC effectively lowers the minimum size detection cutoff by enlarging the particle diameter by the use of a condensable vapor such as an alcohol (CitationSem 2002). The butanol-based TSI 3025A UF-CPC has a minimum diameter cutoff of 3 nm. An SMPS measures the number-based particle size distributions based on their electrical mobility diameter through the combination of a differential mobility analyzer (DMA) connected to a CPC. By scanning through the set voltage range, a range of mobility diameters can be selected and counted. In this study, the SMPS used a TSI 3010 CPC with a TSI 3080 electrostatic classifier (DMA) and was set to have a lower mobility diameter limit of 15 nm. The UF-ATOFMS simultaneously acquires positive and negative ion mass spectra, as well as aerodynamic diameter information, for single particles in real-time. It has improved detection efficiency for small particles (< 300 nm) over the standard transportable ATOFMS (CitationGard et al. 1997) by replacing the converging nozzle inlet with an aerodynamic lens inlet (CitationSu et al. 2004). The lens system tightly collimates the particle beam, so that smaller ultrafine particles will be more efficiently transmitted in the instrument (CitationLiu et al. 1995a; CitationLiu et al. 1995b). The UF-ATOFMS also has enhanced light-scattering detection by the use of focusing lens to tighten the continuous laser beams, increasing the laser beam power density, and by employing a fast amplifier to improve the signal-to-noise ratio (CitationSu et al. 2004). All these enhancements, in addition to the aerodynamic lens systems, are necessary to improve the minimum optical detection size of ∼ 100 nm down to 50 nm. In this study, chemical information was obtained for approximately 20.5% and 28.6% of the ultrafine particles that were sized by the UF-ATOFMS during the summer and fall, respectively. Just like ambient particles of larger sizes, less than 100% of the particles that are sized produce mass spectra due to factors such as the interaction between the particle beam and the 266 nm laser beam, chemical composition, and desorption/ionization capability of the particle (CitationKane and Johnston 2000; CitationSu et al. 2004). The percentages of ultrafine particles that were chemically analyzed fit well within the overall range (15–35%) of all ambient particles chemically analyzed by the UF-ATOFMS throughout both studies. Most of the observed variability in the percentage of particles that were chemically analyzed could be explained by busy time issues, as previously discussed in CitationSodeman et al. (2005). During periods with very high particle concentrations (all sizes), the older data acquisition system used for this study was unable to save the spectra as quickly as they were produced, lowering the overall percentage of chemically analyzed particles.
The instruments detect particles based on their optical, electrical mobility, or aerodynamic diameters. The electrical mobility diameter of a particle is the diameter of a sphere with an identical migration velocity in a constant electric field (Flagan 2001), and the aerodynamic diameter of a particle is the diameter of a sphere of unit density with the same terminal velocity (CitationHinds 1999). DeCarlo and coworkers present a detailed theoretical review of the relationship between the electrical mobility and aerodynamic diameters of a particle (CitationDeCarlo et al. 2004). Briefly, both diameters are dependent upon the shape of the particle. With increasing irregularity, the mobility diameter increases, whereas the aerodynamic diameter decreases. As opposed to the electrical mobility diameter, the aerodynamic diameter also is governed by the density of the particle, increasing with higher particle densities. The particle density is mainly dictated by the chemical composition and shape of the particle. Spherical particles of unit density will have the same electrical mobility and aerodynamic diameters.
Among these instruments, only the UF-ATOFMS obtains chemical information in addition to the size of single particles. The UF-ATOFMS chemically analyzed 16,321 ultrafine particles during the summer week-long period and 20,320 ultrafine particles during the fall period. In order to group the ultrafine particle (aerodynamic diameter 50–100 nm) mass spectra measured by the UF-ATOFMS into chemical classes, an adaptive resonance theory neural network algorithm (ART-2a) was employed. ART-2a sorts and categorizes individual particles into clusters based on similar mass spectral characteristics (CitationSong et al. 1999). The main user-defined parameters for ART-2a are the learning rate, number of iterations, and vigilance factor, which were set to 0.05, 20, and 0.80, respectively, for this work. The resulting most populated 50 clusters, which represent ∼ 97% of the total sampled particles, were further combined by hand (based on chemical similarities) to yield the general classes presented herein.
RESULTS AND DISCUSSION
Ambient Measurements
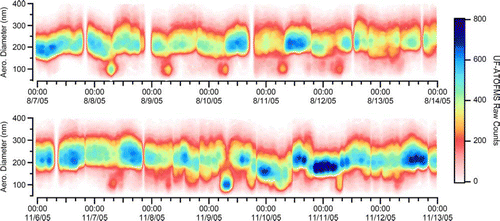
The UF-ATOFMS measured the chemistry of individual ultrafine particles detected during the SOAR campaigns. displays the hourly number of particles for which the UF-ATOFMS obtained both size and chemical information as a function of aerodynamic diameter between 50–400 nm. Upstream of the UF-ATOFMS, a modified micro-orifice uniform deposit impactor (MOUDI) decreased the transmission of larger particles so that the UF-ATOFMS had more opportunity to analyze the smaller particles, which are harder to detect due to their lower transmission efficiencies. The figure shows that the UF-ATOFMS primarily detected particles with aerodynamic diameters between 150 and 300 nm, which was due to a combination of the high ambient concentrations and instrument detection abilities. The top plot clearly shows that the number of detected ultrafine particles (50–100 nm) spiked each morning during weekday rush hour periods.
FIG. 1 Hourly UF-ATOFMS counts of single particles for which chemical information was obtained as a function of aerodynamic diameter during the summer (top) and fall (bottom). (Figure provided in color online.)
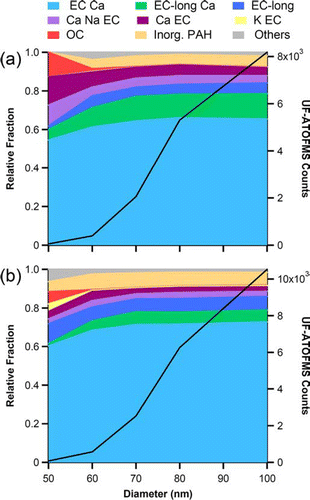
While the UF-ATOFMS measurements do not represent true counting statistics due to its transmission efficiencies (CitationSu et al. 2004), it does provide chemical information about the single particles it detects and the relative percentages of each type. The top mass spectra representing each of the general chemical classes are shown in . provides the relative size distributions of the particle types during both the summer and fall seasons and also shows the size dependence of the particles that are chemically analyzed by the UF-ATOFMS. The 50–60 nm bin had the least number of chemically analyzed particles (55 and 78 particles for summer and fall, respectively), because they were the smallest and, therefore, most difficult to detect. The top five particle types have carbon cluster peaks (C1, C2, C3, etc.) indicative of elemental carbon (EC) and a peak of calcium at m/z 40 [Ca]+ with the dominating class (EC Ca) representing over 60% of the ultrafine particles. These spectra very closely resemble the variations in the mass spectral signatures detected in previous source characterization studies of vehicle exhaust, showing Ca due to lubricating oil as well as EC (CitationSodeman et al. 2005; CitationToner et al. 2006; CitationShields et al. 2007). These particle types vary in their intensities of EC, calcium, sodium (23 [Na]+), phosphate (79 [PO3]– and 97 [H2O· PO3]−), sulfate (97 [HSO4]–), and nitrate (46 [NO2]– and 62 [NO3]–) peaks. The K EC class, marked by intense potassium (39 [K]+) and EC peaks, represents a very small percentage (< 1%) of the ultrafine particles in Riverside. It is not surprising that most of the particles detected by the UF-ATOFMS belonged to these EC classes, because EC particles are fractal and thus optically larger. Laboratory test with the commonly used standard of polystyrene latex spheres (PSLs) have indicated that the UF-ATOFMS does not detect spherical particles with diameters below 90 nm as well. Therefore, this observation indicates that the UF-ATOFMS is very sensitive and uniquely suited to measuring the impact of ultrafine particles from vehicle emissions. The organic carbon (OC) particle type contains hydrocarbon envelopes with peaks at m/z 27 [C2H3]+/[NCH]+ and 43 [C2H3O]+/[CHNO]+. It also contains peaks at m/z 86 and 118, which are markers for amines (CitationAngelino et al. 2001). The OC type is likely the only spherical particle type detected in the ultrafine mode, and it represents less than 1% of the ultrafine particles detected by the UF-ATOFMS. The final class shown in (Inorganic w/ PAH) is dominated by the inorganic species of sodium and potassium but also contains polycyclic aromatic hydrocarbons (PAH) at high m/z. The final class shown in (Inorganic w/ PAH) is dominated by the inorganic species sodium and potassium but also contains polycyclic aromatic hydrocarbons (PAH) at high m/z. This class describes ∼ 6% of the ultrafine particles analyzed by the UF-ATOFMS. It is likely that this inorganic ash particle type adsorbs semivolatile PAH as they partition from the gas to particle phase during the cooling of emissions. It is worth noting that a high percentage (∼ 70%) of the particles in the two non-EC classes (OC and Inorganic w/ PAH) did not produce appreciable negative ion signals, and thus these two classes are represented in without negative ion peaks.
FIG. 2 Representative mass spectra for the general chemical classes of ultrafine particles as determined by the UF-ATOFMS. “CT” in the negative spectra represents crosstalk due to the interference of extremely intense peaks in the positive polarity.
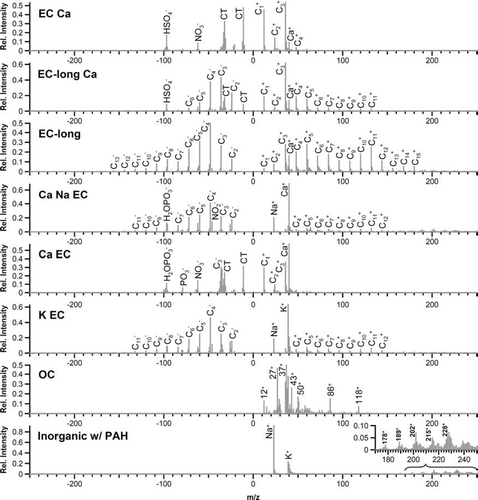
FIG. 3 Relative size distribution (10 nm bins) of ultrafine particle types during the summer (a) and fall (b). The black trace represents the total number of ultrafine particles chemically analyzed by the UF-ATOFMS in each 10 nm size bin. (Figure provided in color online.)
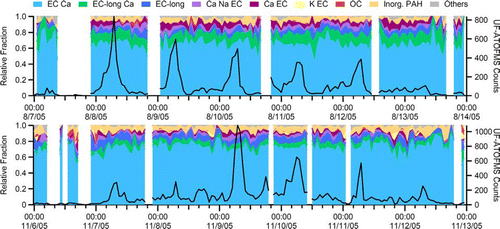
provides the hourly relative fractions for the general chemical classes of the ultrafine particles (50–100 nm) observed by the UF-ATOFMS during the summer (top) and fall (bottom) seasons. The black trace represents the hourly total number of ultrafine particles sized and chemically analyzed by UF-ATOFMS to highlight the periods of higher detection. The missing periods (in white) occur during times when quality control procedures or effective density measurements were being conducted or some other factor led to low particle statistics (< 10 ultrafine particles in that hour). The figure clearly illustrates that the chemical classes associated with vehicle exhaust emissions dominate the ultrafine size mode. Regardless of the time of day, the relative fractions of the ultrafine particle types remain comparatively constant and show no diurnal trend. This agreement is further confirmed by the source apportionment of the SOAR campaigns (Shields et al. in preparation). Although vehicle exhaust emissions are a major contributor of primary ultrafine particles and the local vehicle emissions can influence the sampling site at all times, it is expected that the largest contribution will occur during the weekday rush hour periods, which agrees with peaks in the number of ultrafine particles detected by the UF-ATOFMS. Despite the lack of large differences in the relative fractions of the chemical classes over time, the number of ultrafine particles detected by the UF-ATOFMS does change significantly. Therefore, the UF-ATOFMS unscaled counts represent a good tracer of periods of intense vehicle activity at this location. This observation makes sense, because vehicle exhaust emissions were the only significant source of primary ultrafine particles in close proximity to the sampling site. Any other potential source of ultrafine particles was too far away and the particles would have either coagulated or grown outside of the ultrafine size range before reaching the sampling site. It is also likely that any sources of spherical ultrafine particles would not be detected efficiently by the UF-ATOFMS, as described above.
FIG. 4 Hourly relative fractions of ultrafine particle types during the summer (top) and fall (bottom). The black trace represents the hourly total of ultrafine particles (50–100 nm) chemically analyzed by the UF-ATOFMS. (Figure provided in color online.)
Multiple gas- and particle-phase instruments, in addition to the UF-ATOFMS, were sampling in Riverside, CA in 2005. These supporting ambient measurements can provide complementary information to the observations made with the UF-ATOFMS. displays the temporal trends of these other measurements observed for one week (Sunday through Saturday) during the summer. The top panel shows the overall PM2.5number concentration (particles cm−3) as measured by the UF-CPC, as well as the meteorological parameters (PAR, RH, and temperature). The middle panel presents the black carbon (BC) concentrations determined using the 880 nm wavelength of the aethalometer, in addition to the gas-phase measurements of CO, NOx, and O3. The bottom contour plot illustrates the particle number concentration detected by the SMPS as a function of electrical mobility diameter (15–200 nm).
FIG. 5 Temporal trends of gas- and particle-phase measurements, as well as meteorological variables, for one week (Sunday through Saturday) during the summer season. (Figure provided in color online.)
The SMPS measurements showed increased ultrafine particle number concentrations during the weekday morning rush hour period from approximately 5:00 to 10:00 PST, as shown in . The morning rush hours also were the main time window during which the smallest particles observed by the SMPS (< 30 nm) showed the highest concentrations. In addition, the BC, CO, and NOx measurements, which all tracked each other well (lowest R2 value was 0.71), peaked during this same period (specifically between 8:00 and 9:00 PST). All three measurements correlate with the ultrafine counts from the UF-ATOFMS. For example, the R2 value between NO x concentrations and UF-ATOFMS ultrafine counts is 0.68. Previous studies have reported high correlations between ultrafine number concentrations with both CO and NO/NOx measurements at traffic-orientated sampling sites (Toner et al. submitted; Noble et al. 2003; CitationMarconi et al. 2007). Even the mass-based BC concentration has shown significant correlation with ultrafine particle number concentrations (CitationRodríguez et al. 2007; CitationToner et al. 2008), as also illustrated here. Based on these results, it appears the ultrafine particle number concentration can serve as a good proxy for traffic activity; however, the highest number concentrations (red regions between 30 and 60 nm) measured by the SMPS occurred during the afternoons and not during the traffic-dominated morning rush hour period. Therefore, at least during the summer, the ultrafine particle number concentrations measured by the SMPS are not a unique indicator of traffic activity. The next section explores the SMPS afternoon ultrafine particle peaks in more depth.
Afternoon Photochemical Events
Previous studies of the diurnal trends of ultrafine particles in the source and receptor sites of the LA Basin have determined that an additional source or sources, other than direct emissions by vehicles, make significant contributions to the number of ultrafine particle in the afternoons of warm months in Riverside. Using the chemical composition date from MOUDI measurements, these studies identified photochemically generated secondary species as the source (CitationKim et al. 2002; CitationFine et al. 2004). This same photochemical source explains the high concentrations of particles with electrical mobility diameters between 30 and 60 nm in the afternoon hours (13:00–18:00 PST) in . The daily ultrafine particle event started at the temperature peak which occurs just after the maximum levels of solar radiation and O3 have been reached on both weekdays and weekends, when traffic activity is reduced. Moreover, the gas-phase tracer concentrations of fresh traffic emissions (CO and NOx) were at their minimum values. A detailed study of the aethalometer measurements made during the SOAR campaign also indicated a change in the afternoon mixing state consistent with the condensation of secondary species on account of the diurnal weekday pattern in the absorption cross section, signifying that traffic is not the dominant source of ultrafine particles in the afternoons (CitationSnyder and Schauer 2007). Additionally, the chemistry of the afternoon particles is expected to be different, because the cloud condensation nuclei (CCN) activity was observed to peak in the afternoon during the summer SOAR campaign (CitationCubison et al. 2008). As shown in , few ultrafine (sub-100 nm) particles were observed by the UF-ATOFMS during the afternoon photochemical events in the summer. Rather, the UF-ATOFMS detected mostly large (> 100 nm) and aged vehicle particle types and only a few fresh (ultrafine) vehicle particle types during the afternoons. As mentioned, the SMPS measurements indicate that the majority of the ultrafine particles during these events were between 30 and 60 nm, which is below the minimum detection size (50 nm) of the UF-ATOFMS. shows that the smallest number of ultrafine particles that were chemically analyzed by the UF-ATOFMS are in the 50–60 nm size bin. The fact that the UF-ATOFMS detected few ultrafine particles during the afternoon serves as further indication that these afternoon particles are not from vehicle exhaust emissions. If the SMPS had been the only instrument sampling at this location, it would have been difficult to rule out the possibility that the high concentrations of ultrafine particles in the afternoon were from vehicles. This study demonstrates how a combination of several different instruments can be used to uniquely identify the source or formation pathway of ultrafine particles.
It is noteworthy that while the SMPS measurements differ based on the time of day, the relative fractions of the particle types detected by the UF-ATOFMS stay relatively constant. Soot-like particles, formed from fossil fuel combustion in vehicles, have irregular shapes and effective densities less than unity. Based on these properties, such particles will have aerodynamic diameters smaller than and electrical mobility diameters larger than their physical diameters (CitationDeCarlo et al. 2004; CitationSpencer et al. 2007). In other words, the ultrafine particles characterized by the UF-ATOFMS based on their aerodynamic diameters would not be considered ultrafine particles based on their electrical mobility diameters. The effect of this size distinction was observed directly in experiments coupling a DMA with the UF-ATOFMS during the same field campaign; for example, elemental carbon particles with electrical mobility diameters of 400 nm had aerodynamic diameters of 100 nm (CitationSpencer et al. 2007). Under these circumstances, correcting the aerodynamic-based size distribution of the UF-ATOFMS by scaling directly (size for size) to the electrical mobility distribution measured by the SMPS without adjustments for the particle density and shape factor will lead to erroneous results. This discrepancy must always be taken into consideration, especially for the smallest particles (≥ 200 nm) which are the most fractal and have the greatest difference between their aerodynamic and electrical mobility diameters. Although the particles detected by the UF-ATOFMS indeed are considered ultrafine particles according to their aerodynamic diameters, the ultrafine particles observed by the SMPS, especially those during the summer afternoon photochemical events, are too small to be optically detected in the UF-ATOFMS. This fact explains why the UF-ATOFMS did not detect a change in the relative number fraction of particle types during the summer afternoon periods.
The lack of a diurnal trend in particles detected by the UF-ATOFMS could arise for the following reasons: only large fractal (non-spherical) vehicle particles with ultrafine aerodynamic diameters are able to optically trigger the timing circuit of the instrument and spherical ultrafine particles from non-vehicular UF particles sources produce particles that are too small to optically to be detected with the current configuration. The UF-ATOFMS detection efficiency decreases rapidly with the decreasing diameter of spherical particles; for example, the detection efficiency for the common standard of polystyrene latex spheres (PSLs) is only ∼ 0.3% for 95 nm PSL particles, as opposed to ∼ 44.5% for 290 nm PSL particles (CitationSu et al. 2004). Additional improvements will be needed to directly obtain the chemical information of the ultrafine particles during the afternoon photochemical events by UF-ATOFMS, as they clearly originate from a different source than direct vehicle exhaust emissions and are currently below the UF-ATOFMS detection limit. One possibility is to grow the ultrafine particles by water condensation up to an optically detectable size; however, this condensation process can change the chemistry of the individual particles by gas-to-particle partitioning of water-soluble organic compounds (CitationRavishankara 1997; CitationBlando and Turpin 2000; CitationReid and Sayer 2003; CitationSu et al. 2006). Laboratory experiments since the SOAR campaigns have indicated that placing a neutralizer upstream of the UF-ATOFMS significantly improves the transmission of ultrafine particles to the ionization region of the mass spectrometer. Without the neutralizer, charged particles are deflected from the source region due to the voltages on the source plates of the mass spectrometer with smaller particles deviating more.
Closer examination of the particles analyzed by UF-ATOFMS that were ultrafine particles based on their size during the summer revealed little difference in the chemistry of the ultrafine particles during the morning rush hour and the afternoon periods. This result suggests that some of the fresh ultrafine vehicle exhaust particles were transported to the site without undergoing significant aging transformations, which led them to grow into larger sizes. On the other hand, larger particles (> 100 nm), which are not shown here, do illustrate chemical differences between the mornings and afternoons (Qin et al. in preparation). Many of these larger afternoon particles are morning ultrafine particles that have grown and transformed by aging processes, becoming CCN active (CitationCubison et al. 2008; Shields et al. in preparation). Once spherical ultrafine particles from non-vehicle sources have aged and grown into larger sizes, they can then be optically detected with the UF-ATOFMS.
The afternoon photochemical events in Riverside have different properties from the different types of nanoparticle and ultrafine particle events observed elsewhere, because they show a reduction in particle size rather than growth behavior (CitationWatson et al. 2006). The loss of chemical species from the particles via evaporation is most likely not the cause of the reduction in particle size during the afternoon events in Riverside, because the temperature is cooling down and the RH is increasing at the start of the event. Moore et al. reported similar behavior with their summer 2006 campaign near downtown LA; however, their photochemical event began immediately following the morning commute and before the peak in O3 (CitationMoore et al. 2007). In Riverside, there are at least a few hours between the end of the morning traffic event and the beginning of the afternoon photochemical event. Because Riverside is downwind of the LA Basin, this time difference suggests that, unlike in downtown LA, some of the necessary precursors responsible for the afternoon photochemical events are not immediately available in Riverside and must be transported to the site. Therefore, these results suggest that different sources and processes control the formation and most likely the chemistry of ultrafine particles throughout the day in Riverside; primary sources are dominant during the morning hours, and secondary sources control the afternoon hours.
Seasonal Differences
The temporal trends of the gas- and particle-phase measurements for one week (Sunday through Saturday) during the fall season are shown in . As described in Qin et al. the summer weekdays in Riverside exhibited consistent diurnal trends, whereas PM2.5 during the fall season was better characterized as being episodic; the week shown features a high mass period (November 6 15:00–November 7 18:00) of stagnant meteorological conditions and a PM2.5 mass concentration of 106 μ m m− 3, as well as a scavenging period (November 8 22:00–November 11 13:00) with light precipitation events and low mass concentrations (Qin et al. in preparation). Likewise, the fall trends of ultrafine particle number concentrations show less diurnal trends than in the summer with the exception of the morning rush hour period, as shown in . During the high mass period, few ultrafine particles existed, most likely due to the presence of high numbers of larger particles (and therefore large surface areas available) with which the ultrafine particles could quickly coagulate. The precipitation events during the scavenging period reduced the concentrations of particles in all size ranges; however, after the rain ended, the ultrafine particles from local sources were the first to appear again at high concentrations. The highest number concentrations (based on the UF-CPC and SMPS measurements) correlate with the BC, CO, and NO x peaks, agreeing with previous reports that vehicle emissions are the major contributor to particle number concentrations during the fall season in Riverside (CitationSardar et al. 2005). The photochemical activity (and therefore afternoon photochemical ultrafine events) is seasonal (CitationNa et al. 2004), as the November PAR values are nearly 50% of those during August. Consistent with this lower PAR, very low afternoon ultrafine particle number concentration peaks were detected. The lack of afternoon ultrafine events during the fall season helps explain why the average ultrafine (15–100 nm) number concentration according to the SMPS measurements during the fall (6.7 × 10⁵ particles cm−3) was ∼ 70,000 particles cm−3 lower than that during the summer (7.4 × 10⁵ particles cm−3).
FIG. 6 Temporal trends of gas- and particle-phase measurements, as well as meteorological variables, for one week (Sunday through Saturday) during the fall season. (Figure provided in color online.)
Although the fall UF-ATOFMS raw ultrafine counts (shown at the bottom of ) tend to track the UF-CPC, BC, NO x , and CO measurements, the morning rush hour spikes are not exactly consistent with those observed during the summer season. The Monday and Tuesday morning peaks during the fall were not as intense as the morning increases observed during the summer. The nearest major freeway was located ∼ 600 m to the west of the sampling site. The local winds during the summer season came from a westerly direction most of the time, whereas the fall winds were split between the westerly (daylight hours) and easterly (nighttime hours) directions (Qin et al. in preparation). In addition, the summer wind speeds were much stronger than the fall wind speeds, carrying the freshly emitted vehicle exhaust particles more rapidly to the sampling site. Therefore, both the meteorological conditions and episodic behavior resulted in less ultrafine vehicle particles being detected by the UF-ATOFMS during the fall.
Comparison of Ultrafine Particle Measurements
Because each of the ultrafine instruments used in this study make measurements based on different particle properties, it is interesting to compare their results. Differences in ultrafine particle detection between the SMPS and UF-ATOFMS were already discussed above. As shown in , there is discrepancy between the summer SMPS measurements and the overall particle number concentrations determined by the UF-CPC. The UF-CPC shows increased concentrations during the morning rush hour periods (and likewise during the fall as seen in ), but it responds little to the afternoon photochemical ultrafine events, which displayed the highest concentrations observed by the SMPS during the summer. Because the fall season did not have significant afternoon photochemical events, the instruments agreed well with each other during the fall (). Previous studies have shown significant differences in SMPS and CPC performance when there are high number counts for small sized particles (CitationLiu and Deshler 2003; CitationBiswas et al. 2005). However, the numbers provided by the UF-CPC in the current study do not exceed its upper limit of 105 particles cm−3 nor are the particles (30–60 nm) of this event pushing the lower detection limit of the instrument (3 nm) (CitationSem 2002).
This disagreement was not unique to this specific instrument, because its measurements compared well to those of other CPCs at the same location, including ones that use an alternative vapor (water) for particle growth (Hering, in preparation). All CPC instruments followed the same temporal trend despite the use of different condensable vapors, and none appeared to detect the ultrafine particles during the photochemical events. Particles made of pure organic materials can be detected at 30 nm, so it is unlikely that the minimum detection cut point is higher than the diameters of these particles (CitationHering et al. 2005). It is possible to grow these particle through condensation, as they were optically counted by the CPC in the SMPS system. However, the particles introduced to the CPC after passing through the DMA were generally of uniform size and there was a lower overall concentration of particles at a given time compared to the other CPCs. It may be possible that when all particles of a broad size range are sampled at the same time by the CPC, particles composed mainly of secondary materials recondense on larger sized particles rather than grow themselves. In addition, a laboratory comparison of a SMPS and CPC using monodisperse NaCl aerosols determined that more efficient neutralization of the charged particles upstream of the instruments improves their agreement, because the neutralizer that is part of the SMPS system left more multiply charged particles than predicted, which falsely gave the SMPS higher measurements (CitationLiu and Deshler 2003). It is not yet known if this approach will work for the secondary aerosols produced in photochemical events. Most likely, the disagreement is caused by a combination of over-counting in the SMPS measurements due to inefficient neutralization and under-counting in the UF-CPC measurements due to high particle number concentrations, though it is important that future studies further explore this discrepancy occurring during the summer afternoon periods.
In summary, the UF-ATOFMS measurements provided single particle chemical information on ultrafine particles as a function of their aerodynamic diameters. The major ultrafine particle types observed in Riverside resembled the mass spectral signatures observed in vehicle exhaust emissions. With this information on the chemical classes in combination with the measurements by supporting gas- and particle-phase instruments, it was determined that vehicle exhaust emissions are the major local source contributing to primary ultrafine particles during weekday morning rush hour periods. During the summer season only, an additional source of secondary ultrafine particles was detected during afternoon photochemical events that occurred after LA pollutants were transported to the site.
Real-time measurements of particle size and chemistry coupled with gas-phase measurements have provided unique insight into the daily and seasonal variations of ultrafine particles. In this study, it is demonstrated how ultrafine particle sources (and hence chemistry) can rapidly change over the course of the day, as well as show a strong seasonal dependence. High ultrafine particle concentrations were observed during different periods and seasons, yet the chemistry of the particles was often different. Thus, future studies of health effects aimed at understanding the impacts of ultrafine particles must take into account their sources, degree of aging, and overall chemistry rather than solely relying on their number concentrations as a proxy.
Acknowledgments
The authors express their gratitude to the entire Prather group for their help in the preparation and overall support of these studies. We thank Megan McKay and the Goldstein research group at the University of California, Berkeley for the summer CO measurements and the meteorology data. We also acknowledge Professor Paul Ziemann (University of California, Riverside) for hosting the SOAR field campaigns, as well as Professor Jose Jimenez (Colorado University, Boulder) and Dr. Ken Docherty (Colorado University, Boulder) for setting up the logistics. Finally, we thank Dr. Susanne Hering (Aerosol Dynamics) for the use of her CPC data and helpful suggestions. Funding for this project was supplied by the California Air Resources Board (Contract 04-336) and by the University of Rochester EPA PM Center Grant R827354.
Related Research Data
REFERENCES
- Angelino , S. , Suess , D. T. and Prather , K. A. 2001 . Formation of Aerosol Particles from Reactions of Secondary and Tertiary Alkylamines: Characterization by Aerosol Time-of-Flight Mass Spectrometry . Environ Sci Technol , 35 : 3130 – 3138 .
- Biswas , S. , Fine , P. M. , Geller , M. D. , Hering , S. V. and Sioutas , C. 2005 . Performance Evaluation of a Recently Developed Water-Based Condensation Particle Counter . Aerosol Sci Technol , 39 : 419 – 427 .
- Blando , J. D. and Turpin , B. J. 2000 . Secondary Organic Aerosol Formation in Cloud and Fog Droplets: A Literature Evaluation of Plausibility . Atmos Environ , 34 : 1623 – 1632 .
- Chow , J. C. and Watson , J. G. 2007 . Review of Measurement Methods and Compositions for Ultrafine Particles . Aerosol Air Qual Res , 7 : 121 – 173 .
- Cubison , M. J. , Ervens , B. , Feingold , G. , Docherty , K. , Ulbrich , I. , Shields , L. , Prather , K. , Hering , S. and Jimenez , J. L. 2008 . The Influence of Chemical Composition and Mixing State of Los Angeles Urban Aerosol on CCN Number and Cloud Properties . Atmos Chem Phys Disc. , 8 : 5629 – 5681 .
- DeCarlo , P. F. , Slowik , J. G. , Worsnop , D. R. , Davidovits , P. and Jimenez , J. L. 2004 . Particle Morphology and Density Characterization by Combined Mobility and Aerodynamic Diameter Measurements. Part 1: Theory . Aerosol Sci Technol , 38 : 1185 – 1205 .
- Fine , P. M. , Chakrabarti , B. , Krudysz , M. , Schauer , J. J. and Sioutas , C. 2004 . Diurnal Variations of Individual Organic Compound Constituents of Ultrafine and Accumulation Mode Particulate Matter in the Los Angeles Basin . Environ Sci Technol , 38 : 1296 – 1304 .
- Gard , E. , Mayer , J. E. , Morrical , B. D. , Dienes , T. , Fergenson , D. P. and Prather , K. A. 1997 . Real-Time Analysis of Individual Atmospheric Aerosol Particles—Design and Performance of a Portable ATOFMS . Anal Chem , 69 : 4083 – 4091 .
- Hering , S. V . Manuscript in Preparation
- Hering , S. V. , Stolzenburg , M. R. , Quant , F. R. , Oberreit , D. R. and Keady , P. B. 2005 . A Laminar-Flow, Water-Based Condensation Particle Counter (WCPC) . Aerosol Sci Technol , 39 : 659 – 672 .
- Hinds , W. C. 1999 . Aerosol Technology: Properties, Behavior, and Measurement of Airborne Particles , New York : John Wiley & Sons .
- Kane , D. B. and Johnston , M. V. 2000 . Size and Composition Biases on the Detection of Individual Ultrafine Particles by Aerosol Mass Spectrometry . Environ Sci Technol , 34 : 4887 – 4893 .
- Kim , S. , Shen , S. , Sioutas , C. , Zhu , Y. F. and Hinds , W. C. 2002 . Size Distribution and Diurnal and Seasonal Trends of Ultrafine Particles in Source and Receptor Sites of the Los Angeles Basin . J Air Waste Manage Assoc , 52 : 297 – 307 .
- Kulmala , M. , Vehkamaki , H. , Petajda , T. , Dal Maso , M. , Lauri , A. , Kerminen , V. M. , Birmili , W. and Mcmurry , P. H. 2004 . Formation and Growth Rates of Ultrafine Atmospheric Particles: A Review of Observations . J Aerosol Sci , 35 : 143 – 176 .
- Lake , D. A. , Tolocka , M. P. , Johnston , M. V. and Wexler , A. S. 2003 . Mass Spectrometry of Individual Particles Between 50 and 750 nm in Diameter at the Baltimore Supersite . Environ Sci Technol , 37 : 3268 – 3274 .
- Liu , P. , Ziemann , P. J. , Kittelson , D. B. and Mcmurry , P. H. 1995a . Generating Particle Beams of Controlled Dimensions and Divergence. 1. Theory of Particle Motion in Aerodynamic Lenses and Nozzle Expansions . Aerosol Sci Technol , 22 : 293 – 313 .
- Liu , P. , Ziemann , P. J. , Kittelson , D. B. and Mcmurry , P. H. 1995b . Generating Particle Beams of Controlled Dimensions and Divergence. 2. Experimental Evaluation of Particle Motion in Aerodynamic Lenses and Nozzle Expansions . Aerosol Sci Technol , 22 : 314 – 324 .
- Liu , P. S. K. and Deshler , T. 2003 . Causes of Concentration Differences between a Scanning Mobility Particle Sizer and a Condensation Particle Counter . Aerosol Sci Technol , 37 : 916 – 923 .
- Marconi , A. , Cattani , G. , Cusano , M. , Ferdinandi , M. , Inglessis , M. , Viviano , G. , Settimo , G. and Forastiere , F. 2007 . Two-Years of Fine and Ultrafine Particles Measurements in Rome, Italy . J Toxicol Env Heal A , 70 : 213 – 221 .
- Moore , K. F. , Ning , Z. , Ntziachristos , L. , Schauer , J. J. and Sioutas , C. 2007 . Daily Variation in the Properties of Urban Ultrafine Aerosol—Part I: Physical Characterization and Volatility . Atmos Environ , 41 : 8633 – 8646 .
- Na , K. S. , Sawant , A. A. , Song , C. and Cocker , D. R. 2004 . Primary and Secondary Carbonaceous Species in the Atmosphere of Western Riverside County, California . Atmos Environ , 38 : 1345 – 1355 .
- Noble , C. A. , Mukerjee , S. , Gonzales , M. , Rodes , C. E. , Lawless , P. A. , Natarajan , S. , Myers , E. A. , Norris , G. A. , Smith , L. , Ozkaynak , H. and Neas , L. M. 2003 . Continuous Measurement of Fine and Ultrafine Particulate Matter, Criteria Pollutants and Meteorological Conditions in Urban El Paso, Texas . Atmos Environ , 37 : 827 – 840 .
- Phares , D. J. , Rhoads , K. P. , Johnston , M. V. and Wexler , A. S. 2003 . Size-Resolved Ultrafine Particle Composition Analysis—2. Houston . J Geophys Res-Atmos , 108 ( D7 ) : 8420
- Qin , X. , Shields , L. G. , Toner , S. M. and Prather , K. A. Single Particle Characterization in Riverside, CA During the SOAR 2005 Campaign—Part 1: Seasonal Comparisons Manuscript in Preparation
- Ravishankara , A. R. 1997 . Heterogeneous and Multiphase Chemistry in the Troposphere . Science , 276 : 1058 – 1065 .
- Reid , J. P. and Sayer , R. M. 2003 . Heterogeneous Atmospheric Aerosol Chemistry: Laboratory Studies of Chemistry on Water Droplets . Chem Soc Rev , 32 : 70 – 79 .
- Rhoads , K. P. , Phares , D. J. , Wexler , A. S. and Johnston , M. V. 2003 . Size-Resolved Ultrafine Particle Composition Analysis, 1. Atlanta . J Geophys Res-Atmos , 108 ( D7 ) : 8418
- Rodríguez , S. , Van Dingenen , R. , Putaud , J. P. , Dell'Acqua , A. , Pey , J. , Querol , X. , Alastuey , A. , Chenery , S. , Ho , K. F. , Harrison , R. , Tardivo , R. , Scarnato , B. and Gemelli , V. 2007 . A Study on the Relationship Between Mass Concentrations, Chemistry and Number Size Distribution of Urban Fine Aerosols in Milan, Barcelona and London . Atmos Chem Phys , 7 : 2217 – 2232 .
- Sardar , S. B. , Fine , P. M. , Mayo , P. R. and Sioutas , C. 2005 . Size-Fractionated Measurements of Ambient Ultrafine Particle Chemical Composition in Los Angeles Using the Nanomoudi . Environ Sci Technol , 39 : 932 – 944 .
- Sem , G. J. 2002 . Design and Performance Characteristics of Three Continuous-Flow Condensation Particle Counters: A Summary . Atmos Res , 62 : 267 – 294 .
- Shields , L. G. , Qin , X. , Toner , S. M. and Prather , K. A. Aging Effects on Source Apportionment from the Single Particle Perspective Manuscript in Preparation
- Shields , L. G. , Suess , D. T. and Prather , K. A. 2007 . Determination of Single Particle Mass Spectral Signatures from Heavy-Duty Diesel Vehicle Emissions for PM2.5 Source Apportionment . Atmos Environ , 41 : 3841 – 3852 .
- Snyder , D. C. and Schauer , J. J. 2007 . An Inter-Comparison of Two Black Carbon Aerosol Instruments and a Semi-Continuous Elemental Carbon Instrument in the Urban Environment . Aerosol Sci Technol , 41 : 463 – 474 .
- Sodeman , D. A. , Toner , S. M. and Prather , K. A. 2005 . Determination of Single Particle Mass Spectral Signatures from Light-Duty Vehicle Emissions . Environ Sci Technol , 39 : 4569 – 4580 .
- Song , X. H. , Hopke , P. K. , Fergenson , D. P. and Prather , K. A. 1999 . Classification of Single Particles Analyzed by ATOFMS Using an Artificial Neural Network, ART-2a . Anal Chem , 71 : 860 – 865 .
- Spencer , M. T. , Shields , L. G. and Prather , K. A. 2007 . Simultaneous Measurement of the Effective Density and Chemical Composition of Ambient Aerosol Particles . Environ Sci Technol , 41 : 1303 – 1309 .
- Stanier , C. O. , Khlystov , A. Y. and Pandis , S. N. 2004 . Nucleation Events During the Pittsburgh Air Quality Study: Description and Relation To Key Meteorological, Gas Phase, and Aerosol Parameters . Aerosol Sci Technol , 38 ( S1 ) : 253 – 264 .
- Su , Y. X. , Sipin , M. F. , Furutani , H. and Prather , K. A. 2004 . Development and Characterization of an Aerosol Time-of-Flight Mass Spectrometer with Increased Detection Efficiency . Anal Chem , 76 : 712 – 719 .
- Su , Y. X. , Sipin , M. F. , Spencer , M. T. , Qin , X. Y. , Moffet , R. C. , Shields , L. G. , Prather , K. A. , Venkatachari , P. , Jeong , C. H. , Kim , E. , Hopke , P. K. , Gelein , R. M. , Utell , M. J. , Oberdorster , G. , Berntsen , J. , Devlin , R. B. and Chen , L. C. 2006 . Real-Time Characterization of the Composition of Individual Particles Emitted from Ultrafine Particle Concentrators . Aerosol Sci Technol , 40 : 437 – 455 .
- Toner , S. M. , Shields , L. G. and Prather , K. A. Source Apportionment of Freeway-Side PM2.5 Using ATOFMS . Atmos Environ. , Submitted
- Toner , S. M. , Sodeman , D. A. and Prather , K. A. 2006 . Single Particle Characterization of Ultrafine and Accumulation Mode Particles from Heavy Duty Diesel Vehicles Using Aerosol Time-of-Flight Mass Spectrometry . Environ Sci Technol , 40 : 3912 – 3921 .
- Toner , S. M. , Shields , L. G. , Sodeman , D. A. and Prather , K. A. 2008 . Using Mass Spectral Source Signatures to Apportion Exhaust Particles From Gasoline and Diesel Powered Vehicles in a Freeway Study using UF-ATOFMS . Atmos Environ , 42 : 568 – 581 .
- Watson , J. G. , Chow , J. C. , Park , K. , Lowenthal , D. H. and Park , K. 2006 . Nanoparticle and Ultrafine Particle Events at the Fresno Supersite . J. Air Waste Manage. Assoc , 56 : 417 – 430 .
- Woo , K. S. , Chen , D. R. , Pui , D. Y. H. and Mcmurry , P. H. 2001 . Measurement of Atlanta Aerosol Size Distributions: Observations of Ultrafine Particle Events . Aerosol Sci Technol , 34 : 75 – 87 .
- Zhang , K. M. and Wexler , A. S. 2002 . A Hypothesis for Growth of Fresh Atmospheric Nuclei . J Geophys Res—Atmos. , 107 ( D21 ) : 4577
- Zhang , R. Y. , Suh , I. , Zhao , J. , Zhang , D. , Fortner , E. C. , Tie , X. X. , Molina , L. T. and Molina , M. J. 2004 . Atmospheric New Particle Formation Enhanced by Organic Acids . Science , 304 : 1487 – 1490 .