Abstract
We report on an ambient-pressure aerodynamic lens for particles in the 1–10 μ m diameter range, operating at a flow rate of about 1 lpm, that greatly increases the particle number density downstream of the lens. Intended for use with optical monitors, the lens's low pressure drop (10–30 Torr) minimizes pumping requirements and thus power consumption. Numerical modeling indicates that the orifice particle Stokes number and the ratio of orifice diameter to tube diameter are the critical determinants of lens performance. The gas Reynolds number (on the order of 1000, two orders of magnitude greater than typical lens systems used in aerosol mass spectrometers) has only a weak effect on both beam diameter and particle transmission efficiency. Model results, validated by light scattering experiments, indicate that a lens with a final tube with inner diameter 1.65 mm and a single orifice of 0.75 mm diameter can produce beam diameters of far less than 0.10 mm. The effective working distance of the system, ∼ 1 cm downstream of the orifice, is limited by transition to turbulence in the jet downstream of the orifice. This also limits the lens design to a single orifice. Calculated and measured transmission efficiencies range from unity for particles smaller than 3 μ m to ∼ 40% for 10 μ m particles. Simultaneous achievement of both a narrow beam and excellent transmission efficiency is limited to about a three-fold range in particle size, so no single lens of this design can simultaneously encompass the entire 1–10 μ m particle size design range.
INTRODUCTION
Airborne particulate matter with aerodynamic diameters less than 10 microns (referred to as PM10) is one of the six criteria pollutants used by the U.S. Environmental Protection Agency as indicators of air quality. Particles in the 1 to 10 micron size range are readily taken into and retained by the lungs. Therefore, this aerosol size range is of great concern as a source of adverse health effects due to ambient pollution. This is also the size range of interest for inhalation therapies and, unfortunately, for delivery of biological weapons. Thus, the development of real-time techniques for characterization of PM10 aerosol particles has become increasingly important (CitationFehsenfeld et al. 2004; CitationSullivan and Prather 2005). Single particle detection by point techniques such as laser-induced fluorescence, laser-induced breakdown spectroscopy, Raman scattering, and elastic light scattering yields detailed information about the chemical and physical properties of these particles. However, for such techniques to reach the desired sensitivity of 1–100 particles per liter, they must be coupled with a device which concentrates the particles of interest into the detection zone. In a continuous-flow sampling instrument, one such means is the creation of a focused beam of particles. Operation at or near ambient pressure, temperature, and humidity is desirable, since it lowers the size, weight, power requirement, cost, and complexity of the instrument.
A technique widely used to focus particles into narrow beams is the aerodynamic lens. In its simplest configuration, the aerodynamic lens is a series of orifices contained in a tube. Usually such a lens system is operated at low pressure (CitationLiu et al. 1995a, Citationb; CitationJayne et al. 2000), although efforts have also been made to develop focusing nozzles operating at higher pressures for impactors, optical particle counters and aerodynamic particle sizers. Particle beam generation with a single orifice (converging nozzle, capillary and sheathed nozzles) has been studied theoretically and experimentally (CitationDahneke and Padliya 1977; CitationDahneke 1978; CitationCheng and Dahneke 1979; CitationDahneke and Cheng 1979; CitationMallina et al. 1999, Citation2000). These studies concluded that only a narrow size range of particles can be effectively focused and transmitted by such devices. Schreiner et al. (Citation1998, Citation1999) developed an aerodynamic lens working in the pressure range from 40 to 200 Torr. It can be used to concentrate particles with diameters up to 4 μ m, significantly larger than the reported upper limit (about 700 nm) for a lens operating at 2 Torr (CitationJayne et al. 2000). CitationFuerstenau, Gomez, and Fernandez de la Mora (1994) studied the flow of a dilute airborne suspension of 3 μ m polystyrene spheres through a single thin plate orifice. Flow visualization provided an important experimental demonstration of focusing by a single lens. The study is also a source of significant qualitative insights, but few quantitative results were reported. CitationPan et al. (2003) used a conically shaped, 1 mm diameter nozzle to focus particles into narrow beams for fluorescence particle spectrometer measurements.
CitationLee et al. (2003) conducted a numerical analysis of an aerodynamic lens working in the atmospheric pressure regime. The orifice Reynolds number in their study ranges from 300 to 700 and particle Stokes number from 0.1 to 3. For orifice sizes of 2.5 and 5 mm, the particle beam diameters, averaged over their operating range, are close to 2.5 and 5 mm, respectively, which is greater than desired for online laser detection. In retrospect, it seems likely that the large beam diameter is due in part to the use of quite small orifice diameters relative to the tube diameter (typical values of the ratio were 0.1 to 0.2). In addition, the beam diameter was specified at a downstream distance of five tube diameters, which corresponds to 25 to 50 orifice diameters. Lee et al. did not report particle transmission efficiencies. This is an important parameter in an overall design since, if losses are large, some or all of the benefit of focusing is lost. Thus, a detailed study on the design and operation of aerodynamic lenses at atmospheric pressure and practical flow rates is still needed.
In this article, fluid dynamic calculations are used to examine the general features of gas flow and particle motion in a focusing lens working at atmospheric pressure. Special emphasis is placed on the effects of operating conditions, geometric structure and particle properties on transmission efficiency and beam width. Measurements of particle transmission efficiencies and beam widths for a lens built on the basis of those calculations are also presented and performance is compared to prediction. We also present experimental results for a lens with a slightly larger exit orifice. This small change results in a lens with almost no focusing capability, also in accord with fluid dynamic predictions.
PRELIMINARY CONSIDERATIONS
Prior work by CitationZhang et al. (2002) would suggest that a focusing lens should operate at a Stokes number (the time constant for response of a particle to a velocity change divided by the Lagrangian time scale of the velocity change) of about one, i.e.,
MODEL DESCRIPTION
In this study, the FLUENT computational fluid dynamics (CFD) software package was used to calculate the gas flow field as well as the particle trajectories. shows a schematic structure of the lens used for simulation. Air at a volumetric flow rate Q is introduced into a tube (diameter D, or radius R). Particles are computationally injected 10D downstream of the gas inlet, by which point the velocity profile is nearly parabolic. A plate (thickness T), in which there is a small orifice of diameter of d (or, radius R o ), is placed 10D downstream of the injection plane. The particle-laden flow passes through the orifice and issues into a much larger open tube. The gas is then discharged from the end of the open tube. The result is a narrow particle beam for which the beam width is given by B(x), where x is the axial distance downstream of the orifice. The whole process is conducted at room temperature (300K). For all calculations in this study, T is taken to be 0.25 mm, which is thin enough to avoid particle loss due to impacts with the side wall of the orifice. The choice of D (1.65 mm) is slightly different from the above estimate and was motivated partly by some preliminary simulations and partly by the availability of stock tube sizes for the accompanying experimental study. Given that most of the results can be expressed in dimensionless quantities, the choice is not important.
FIG. 1 (a) Schematic lens structure. (b) Typical gas streamlines and particle trajectories. The dashed area is used to identify the region expanded on the right to show the particle trajectories.
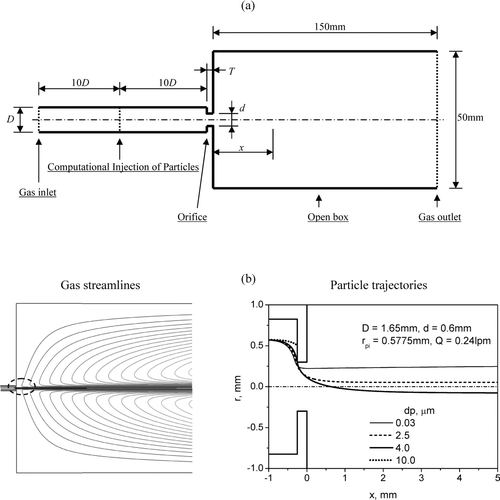
A grid to permit computation of the flow in the above structure was constructed as a two-dimensional mesh by the software package Gambit. The mesh size is not uniform; for example, a very dense mesh was adopted for zones around the orifice where the velocity gradient is high. The overall grid density is 80 points per mm in both the axial and the radial direction. The dependence of calculated results on grid size was checked and it was found that a further increase in grid density did not improve the accuracy of calculated gas streamlines and particle trajectories.
The mesh was then introduced into FLUENT for calculation of the particle-free gas flow field. Air was modeled as an ideal gas, and the flow was assumed to be spatially axisymmetric and temporally steady. Transition to turbulent flow, as suggested above, deserves further discussion. For jets, transition from laminar to turbulent flow is known to occur at relatively low Reynolds numbers. For example, CitationGomez-Moreno et al. (2002) indicated that a multi-stage aerodynamic lens could not be satisfactorily operated at high gas flow rates due to the appearance of turbulence. CitationMcNaughton and Sinclair (1966) studied submerged jets in short cylindrical vessels and found that fully laminar jets are found only if the Reynolds number is less than some value lying between 300 and 1000. For semi-turbulent jets (1000 < Re < 3000), there is a laminar length which depends on the Reynolds number and geometric parameters. When applied to the current situation, their results indicate that the assumption of a laminar flow at the detection point (x/d = 5) is valid. However, beyond some point around x/d = 10, turbulence may begin to take effect; and the results calculated here may not be useful at larger downstream distances.
The computational boundary at the inlet is set as a “mass flow inlet,” and the one at the outlet is “pressure-outlet” with an absolute pressure P of 101.3 kPa. Given the initial values for pressure and velocity, the continuity, momentum, and energy equations are then numerically solved. In order to obtain better convergence, the relaxation factors are gradually increased from an initial value of 0.1 to a final value of 0.6 as iterations progress. Usually, the residues decrease to about 10−6, which is adequate for full convergence. A typical result for the contours of the stream function can be found in the left portion of . As we had anticipated, the flow downstream of the orifice is a jet with weak recirculations in the surrounding tube. The jet diameter increases slowly with downstream distance.
The particle trajectories were obtained by using the particle tracking method of FLUENT which solves the equation of motion as applied to the particles. The possible forces exerted on the particles include those due to hydrodynamic drag, gravity, “virtual mass,” and Brownian motion. The dominant force is the drag force, which was calculated by the method described in Zhang et al. (Citation2002, Citation2004). It should be noted that Re p (Reynolds number defined on particle diameter and slip velocity) is less than one for all particles for which d p is less than 6 μ m. For larger particles, Stokes' law begins to be more approximate. Both gravitational and Brownian effects were found to be negligible and were therefore neglected. The sum of the above forces (exclusive of gravity) was equated to the rate of change of particle momentum, and the resultant force balance equation was then solved by stepwise integration to determine particle position and other flow parameters.
The particles used in this calculation are spherical and mono-disperse. Furthermore, they are much larger than the mean free path so the slip correction factor is essentially unity. Thus, the aerodynamic diameter can be calculated from (CitationMurphy et al. 2004)
EXPERIMENTAL DETAILS
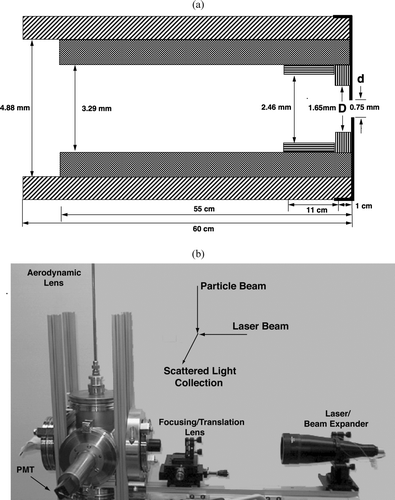
provides a schematic diagram of the lens (note that the diagram is not to scale). The lens is constructed from nested concentric pieces of thick and thin-walled brass telescope tubing. An end-cap containing the exit orifice also serves as a retainer for the nested pieces of tubing. The length and outer diameter of the lens structure were chosen purely for convenience and to allow the gas flow to develop fully before changes in channel diameter were made. The inner diameter of the final piece of tubing D is 1.65 mm. Two orifices with the diameter d of 0.75 mm and 1 mm were used, producing d/D values of 0.455 and 0.606. It should be emphasized that the ideal geometry of and the actual geometry of are significantly different. The former geometry was used in the general modeling studies. For comparison with experimental data, additional computational runs were made using the actual lens geometry.
FIG. 2 (a) Schematic diagram of the lens used in experiments and (b) photograph of light scattering apparatus.
In order to measure both transmission and focusing properties of the lenses, monodisperse polystyrene latex (PSL) particles (Duke Scientific) with diameters ranging from 1 to 8 μ m were used. The particles were aerosolized using a medical nebulizer (Hudson RCI). The flow from the nebulizer was diluted with a sufficient amount of dry air to evaporate the water from nebulized droplets containing PSL particles. The drying air flows through an annular porous metal sheet, producing a slow flow surrounding and mixing with the nebulizer flow, and then passes directly into an exhaust duct. A small fraction of the total flow is extracted through a length of 1 cm i. d. tubing and is then drawn through the aerodynamic lens during testing.
In this article we present results from two types of diagnostic measurements, light scattering measurements of the particle beam diameter as a function of distance downstream from the lens exit, and measurements of particle losses in the aerodynamic lens as determined by an optical particle counter with size resolution. The apparatus used for light scattering measurements of particle beam diameters is shown in . The aerodynamic lens passes through a Cajon Ultra-Torr fitting in the top flange of a vacuum chamber constructed of a six-way cross. This allows adjustment of the vertical position of the lens with respect to the light scattering laser beam. A diaphragm pump and flow valve, attached to a port in the bottom flange of the vacuum chamber, are used to maintain the chamber under a slight vacuum (5 to 25 Torr below ambient pressure). This pressure drop in turn establishes the flow rate through the lens (in the range of 0.5 to 1.25 lpm). A flow rate of 1 lpm corresponds to a pressure drop through the lens of about 20 Torr. A collimated red (635 nm) diode laser beam is expanded and recollimated by a 10× beam expander and then refocused by a high quality f/8 lens. This produces a Gaussian beam with a measured 1/e width of 12 μ m and calculated depth of focus of 140 μ m. The focused laser beam enters and leaves the vacuum chamber through windows mounted at Brewster's angle on an axis which is orthogonal to the particle beam. A collecting lens and photomultiplier tube, both inside the vacuum chamber and mounted along the third orthogonal axis, collect light scattered from particles. The laser beam is scanned across the particle beam by moving the final focusing lens which is mounted on a translation stage. This stage is capable of motion in sub-micron increments, but data points were typically taken with radial position increments of the order of 10 or 20 μ m. Light pulses from the PMT were accumulated as a function of peak height by a multichannel analyzer. Peak height analysis was used to remove pulses resulting from random-sized particulates in the chamber and particles that were outside the focused region of the laser beam. Typically, pulses more than a factor of 3 below the maximum signal for the particle size of interest were not counted. With the f/8 optical system, this means that the sampling volume of the light scattering is hourglass-shaped, with the waist of 12 μ m expanding to about 21 μ m at each end and a total length of about 260 μ m. Pulses were also displayed, averaged, and saved in digital files by an oscilloscope. The light scattering pulse widths also provided estimates of particle velocity that proved very useful in distinguishing beam and background particles.
The lens transmission efficiency was measured for each particle diameter by counting particles emerging from the orifice with an optical particle counter (Grimm Model 1.105). This instrument contains a pump, which draws particle-laden air from the particle source through the aerodynamic lens (or a reference element, described below) into the size analyzer where particles are counted. We constructed a sampling line that contained a three-way valve after the nebulizer and drying column, allowing the flow of aerosol particles to be directed through one of two arms. One arm contained the aerodynamic lens, while the other had an identical outer tube but without any of the constricting elements. Additional identical lengths of tubing led to a Y-connector which led to the inlet of the optical particle counter. Switching quickly and frequently between these two arms and ratioing the particle counts for each provided a measurement of the lens transmission efficiency.
We found that this arrangement gave highly reproducible count rate ratios for particles of 1 and 3 μ m diameters, but produced less reliable results for larger particles, especially 8 μ m diameter PSL particles. Larger particles are more susceptible to wall losses in the transfer tubing, and we suspect that the jet flow from the lens carried particles onto the walls of the downstream tubing in a way that the flow from the larger diameter reference tube did not, leading to larger wall losses and the appearance of low transmission values that were not borne out by observations of particle deposition inside the lens. Another problem associated with the larger diameter particles was that the output of the nebulizer varied in intensity over time, greatly increasing the noise associated with the measurement. Therefore, we carried out additional measurements in which lenses with 0.75 mm and 1 mm exit orifices occupied the two arms of the apparatus. Both our calculations and observations suggested that the 1 mm diameter orifice lens should have very good transmission efficiency, above 95% for all particle sizes used. The transmission values for the two reference configurations were generally in good agreement. However, when 8 μ m diameter PSL particles were used in conjunction with the 0.75 mm orifice, the transmission efficiency was significantly larger relative to the 1 mm orifice than it was relative to the empty tube.
SIMULATION RESULTS AND DISCUSSION
Single Particle Trajectories
Consider a particle with a certain initial radial position r pi . As shown in , the particle can either be captured by impact on the face of the orifice plate or it can pass through the orifice itself. By numerically examining the fate of particles at various initial radial positions and marking those which are transmitted (blocked) with an open (filled) circle, we are able to obtain a phase diagram, as shown in .
FIG. 3 (a) A typical phase diagram for particle transmission. The open and filled circles denote particles with a certain diameter and initial radial position to be transmitted and to be blocked, respectively. (b) Loci separating blockage from transmission of particles for orifice diameters of 1.0, 0.75, 0.6, and 0.3 mm.
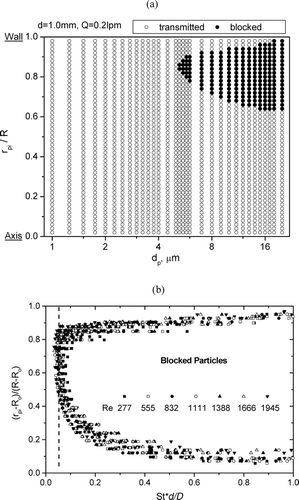
It can be seen that particles with diameters smaller than a critical value (e.g., d p,c1 = 5.22 μ m for the conditions shown in ) can always be transmitted through the orifice. This is reasonable because these particles can follow the gas quite well. When the particle diameter becomes larger than d p,c1 , some particles are lost at the orifice plate. An interesting phenomenon here is that the first particles to be captured are not those near the wall, but those with an intermediate initial radial position (e.g., r pi /R = 0.86 in ). This is counterintuitive because one might expect the particles close to the wall to have the highest probability of being trapped, since they must travel the greatest radial distance in order to reach the orifice. If transmission of particles near the axis is referred to as “bulk conveying,” then that for particles near the wall may be called “near-wall conveying.” Particles in the regime between bulk conveying and near-wall conveying are blocked. With increasing particle size, the blocked regime spreads toward both the wall and the center. If the particle size is larger than d p,c2 (equal to 17 μ m in ), near-wall conveying no longer exists. Similarly, the bulk conveying boundary approaches a lower limit determined by the lens geometry (r pi /R = R o /R). The mechanism for near-wall conveying may be related to the very low flow velocity in the wall regime, which results in ample time for the particles to negotiate the contraction and avoid impact on the face of the orifice plate. For example, if a 7 μ m particle originally located at r pi /R = 0.94 is compared to one on the centerline in , it is found that the latter will spend about 15 times as long in the region of –1.25 < x/d < –0.25 (at the upstream edge of the orifice) as do the former. According to Equation (Equation1), the local Stokes number (defined on local flow velocity) is very small for particles near the wall, so they are able to follow the gas flow.
Similar plots were constructed for other gas flow rates and orifice diameters. The results are summarized in . Note that the abscissa here is St*d/D, a quantity similar to the “spacer Stokes number” used by CitationWang and McMurry (2006). It can be seen that the data points essentially superpose to form a single curve. The blocked particle regime tends to broaden with increasing Stokes number, while Reynolds number is found to have only a marginal influence. The curve is slightly asymmetric relative to its average radial position. This diagram makes it possible to predict whether a particle with a certain r pi and St can be transmitted through a known orifice. The maximum value of St*d/D corresponding to full transmission of particles for all initial radial positions is about 0.05, as denoted by the dashed line in .
For those particles which pass through the orifice, one needs to know the downstream radial position as a function of the downstream axial position. Small values of the particle contraction ratio (η c ) are essential if particles are to be focused into a narrow beam. shows the radial position at different Reynolds numbers for particles with an initial radial position r pi /R of 0.2. Note that because this radial position is less than the orifice radius (R o /R = 0.364), the particle can always be transmitted through the orifice. All the r po vs. d p curves have a “V”-shape, and the bottom of the “V” occurs at a moderate particle diameter d pl . It is found that d pl shifts to smaller values with increasing gas flow rate. If d p and r po are replaced by St and η c (also shown in ), the contraction ratio can be expressed solely as a function of Stokes number. The “V” shape is easily explained. Very small particles nearly follow the gas motion. As a result, the corresponding contraction ratio is determined by the change in the radial position of that gas streamline which passes through the original position of the particle, i.e.,
FIG. 4 (a) Particle radial position after the orifice and corresponding contraction ratio versus particle diameter and Stokes number, respectively. The initial radial position of the particle, r pi /R, is 0.2. (b) Contraction ratio versus particle Stokes number for various Reynolds numbers and orifice diameters. The initial radial position of the particle, r pi /R, is 0.8. The detection plane is x/d = 5.
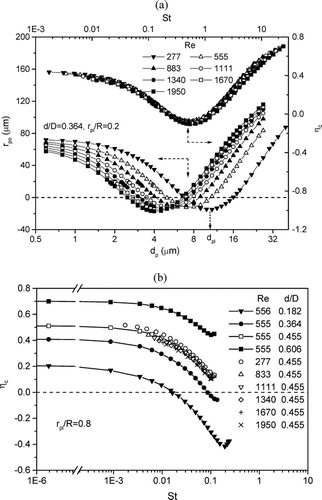
The contraction ratio for particles initially located at r pi /R = 0.8 is given in . Because r pi is larger than R o , a particle released from this initial radial position will hit the orifice plate if its inertia is high enough, as suggested by . As a result, none of the η c vs. St curves has a full “V”-shape. Instead they are terminated at certain Stokes numbers, although such a termination can occur at quite different contraction ratios. For example, the curves corresponding to d/D equal to 0.606 and 0.455 terminate at positive particle contraction ratios while those corresponding to d/D equal to 0.364 and 0.182 terminate at negative values. It can be seen that the data for a given orifice diameter form a single curve of η c vs. St, although the contraction ratio for Re = 277 is a little higher than those at higher Reynolds numbers.
shows the trajectories of 4 μ m particles originally released from different radial positions. It can be seen that particles with successively larger r pi cross the axis at successively smaller x/d, until their trajectories get blocked by the orifice plate. This complicates the determination of the particle beam width. For example, the trajectory for r pi /R = 0.42 is the outermost one from x/d = 0 to 0.94, but it is replaced by that for r pi /R = 0.28 when x/d > 0.94. The particles from r pi /R = 0.56 have the largest absolute radial position for x/d beyond 1.68. If the beam width B at some axial position is defined as twice the absolute radial position of the outermost particle trajectory, then B can be obtained only by examination of the particle trajectories originating from all radial positions, rather than a simple analysis of the particle trajectory from a specific initial radial position. Furthermore, due to this dependence on r pi /R, perfect focusing of even a monodisperse particle flow is not possible.
FIG. 5 (a) Trajectories of particles with different initial radial positions. Note that the radial position here is shown by the absolute distance between the particle and the axis. (b) Radial positions of particles and corresponding contraction ratios at x/d = 5 and 10 versus the dimensional and non-dimensional initial radial positions of particles, respectively.
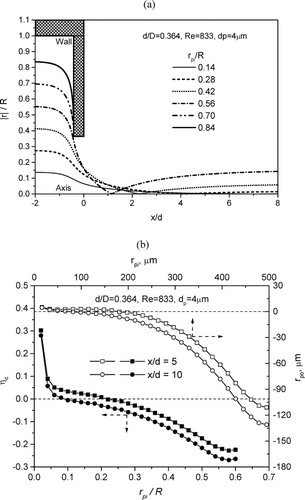
The dependence of r po and η c on particle initial radial position is shown in . The fact that η c varies considerably with r pi /R is different from the behavior observed for a low Reynolds number aerodynamic lens working at vacuum conditions, for which η c is nearly independent of r pi /R (CitationZhang et al. 2002).
Transmission Efficiency and Particle Beam Width
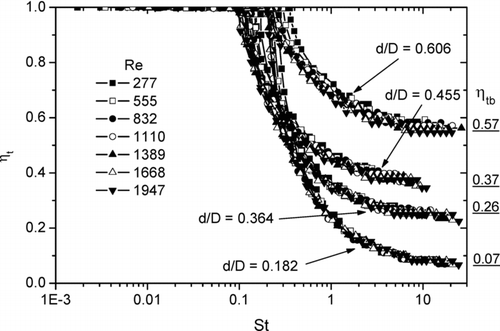
The transmission efficiency η t for various orifice sizes is given in . Here η t is defined as the rate at which particles cross the measurement plane (x/d = 5 or 10) divided by the rate at which they are injected into the lens. It can be seen that the transmission efficiency is largely dependent on the particle Stokes number, that is, all of the data nearly fall onto a single curve of η t vs. St for each orifice size; but the Reynolds number also has some influence on the maximum size, d pm , that is transmitted without loss. For a given Reynolds number, η t is unity for particles with Stokes number less than a critical value St pm ; beyond which, however, η t exhibits a sharp decrease with increasing St as a result of impact losses on the surface of the orifice plate. Finally, when Stokes number is sufficiently large, η t approaches a constant value η t,b , which is determined by the lens geometry. In that situation, particles for which r pi < R o are transmitted while all of those for which r pi ≥ R o are blocked. As expected, a larger orifice corresponds to a higher η t,b due to the higher fraction of particles for which r pi < R o . The maximum Stokes number with 100% particle transmission ranges from 0.1 to 0.3, which is comparable to that obtained by CitationZhang et al. (2002) in the vacuum aerodynamic lens system.
FIG. 6 Particle transmission efficiency versus Stokes number for orifices of various diameters. The underlined numbers on the right side show the η tb values for the corresponding curves.
The width of the particle beam is the single most important parameter for most applications of an atmospheric pressure lens. As stated above, the exact value of the beam width, B, at the measuring plane must be obtained by tracking the trajectories of all particles released from the particle injection plane in order to identify the radial position of the outermost particles. Our simulation results show that including/excluding the near-wall conveying leads to a difference in the particle transmission efficiency of less than 10%, so particles transmitted by near-wall conveying do not represent a large fraction of the total. In experiments, the beam width is often defined as that width which contains 95% of the transmitted particles (CitationSchreiner et al. 1999). Thus, in the following discussion on the results obtained from the geometry, near-wall conveying is consistently excluded from consideration when the beam width B is evaluated. However, it is important to recognize that some particles will be found well outside the primary beam if near-wall conveying is present.
The beam width at x/d = 5 for orifice diameters of 1.3, 1.0, 0.85, and 0.75 mm is shown in . For each curve, it can be seen that the beam width first decreases and then increases with increasing St, resulting in a “V”-shaped curve. However, some oscillations are observed in the right branch, which may be caused by the exclusion of near-wall conveying from the beam width calculation. For a given Stokes number, the beam width decreases with increasing Reynolds number when Re is less than 1110, beyond which the influence of Reynolds number is marginal. The effects of Reynolds number on beam width are also found to be less significant at larger Stokes numbers. For Re = 1110 and 0.45 < d/D < 0.8, an increase in the orifice size moves the B/d vs. St curve upwards and also flattens it. Thus, the beam becomes significantly wider when d/D is increased. The behavior of the beam width for d/D < 0.45 is very different, as shown in and . The B/d vs. St curves have a “W” shape. It was found that particles with moderate Stokes numbers (e.g., 0.1–1.5 for d/D = 0.364) cross the axis and produce the outermost trajectories at x/d = 5. Because the beam width is calculated from the absolute radial position, it is positive even when the particles cross the axis. As noted in the context of , an important feature of the B/d vs. St curve is that it never reaches zero. The reason is that, although there is always a Stokes number that causes the particle from a certain initial radial position to cross the axis at a specified measurement plane (η c = 0), no single value of St can enable particles from all radial positions to cross the axis at the same measurement plane, i.e., B is always larger than zero.
FIG. 7 Beam width versus particle Stokes number for orifice diameters (a) d = 1.3, 1.0, 0.85, and 0.75 mm; (b) d = 0.6 mm; and (c) d = 0.3 mm at x/d = 5. Panel (d) shows the dependence of beam width on dimensionless orifice diameter for particles of certain Stokes numbers. (Continued)

The above data can be cross plotted to examine sensitivity to the dimensionless orifice size d/D. As shown in , for particles with a certain Stokes number, there is always an optimal orifice size that minimizes the width of the particle beam. If d/D goes below the optimal value, the particle beam is broadened by the axis-crossing. On the other hand, in the absence of axis-crossing, B/d tends to increase with increasing orifice size due to the reduction of the radially inward velocity acquired by the particles as they approach the orifice. The optimal value of d/D is about 0.4 for 0.1 < St < 2. For St equal to either 0.03 or 5, the optimum is at a very low d/D. The beam width is acutely sensitive to d/D (note that the ordinate is logarithmic). This is perhaps best illustrated by the curve for St = 2.
Particle Flux Profile
We next examine the distribution of the particle flux as a function of radial position across the beam. The particle flux w can be calculated as the product of local particle concentration c and particle velocity u p . Because particle flux provides information on the intensity of the particle beam at various radial positions, it is a measure of beam quality. For particles initially located at r pi at the injection plane and then at r po at the detection plane, mass conservation applied to an annulus defined by two adjacent particle trajectory lines gives
Typical particle flux profiles are shown in , with the corresponding curves of r po vs. r pi shown in . The actual particle flux is dependent on C 0, which may vary in different applications; so the flux has been normalized by the local average flux w av . It can be seen from 1 that w increases from zero at the beam boundary (r po = 0.5B or –0.5B) to a maximum at the beam center (r po = 0), forming an “arch” shape. However, as particle size increases from 1 μ m to 7 μ m, the “arch” evolves gradually into a “double-peak” in which the particle flux is high at the beam boundary but low at the center (2). The reason for the above change can be found from the curves of outlet position versus inlet position. The r po versus r pi curve in 1 is almost a straight line, showing a nearly constant contraction ratio for particles from different initial radial positions. From Equation (Equation9) we see that the particle flux profile here depends only on the shape of the particle velocity profile at the injection plane, which is equal to the gas velocity profile for an almost fully developed flow. However, the curve of r po versus r pi in 2 deviates from a linear relationship for those particles originally near the wall. Thus, trajectories are “bunched up” at the outlet and this results in the presence of two peaks of finite intensity.
FIG. 8 Typical modes of particle flux profiles (panels a1–a5) and the corresponding radial positions (panels b1–b5) at the detection (x/d = 5) and injection planes. (a1, b1) Arch mode, d = 1 mm, Re = 277, d p = 1 μ m; (a2, b2) Double-peak mode, d = 1 mm, Re = 277, d p = 7 μ m; (a3, b3) Single-peak mode, d = 0.6 mm, Re = 1945, d p = 3 μ m; (a4, b4) Four-peak mode, d = 0.75 mm, Re = 555, d p = 3 μ m; (a5, b5) Three-peak mode, d = 0.3 mm, Re = 277, d p = 5 μ m. Here w av is the particle flux averaged over the detection plane. The arrows in panel (a) indicate infinite particle fluxes at those positions, which are highlighted by the dashed circles in panel (b).
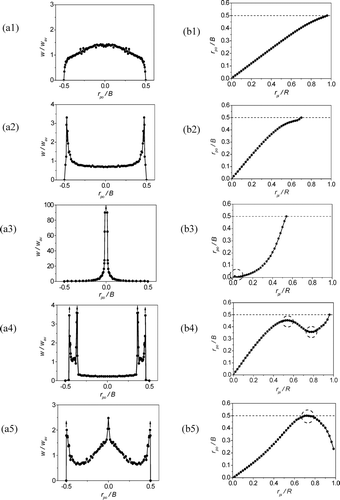
In applications, the single-peak mode shown in 3 is highly desirable. The formation of such a pattern implies particle trajectories that nearly cross the axis. That is, r po is nearly zero for nonzero r pi , or η c = 0. According to Equation (Equation9), this also means that the particle flux goes to infinity, resulting in a sharp peak at the beam center where r po = 0. For the four-peak mode in 4, the particle trajectories cross each other such that a larger r pi may end with a smaller r po . According to Equation (Equation9), the particle flux at this r po goes to infinity because dr po /dr pi equals zero. The two flat sections in the r po vs. r pi curve for 5 μ m particles result in four infinite peaks in the particle flux profile. The “three-peak” pattern shown in 5 is frequently observed for small orifices such as d/D = 0.182. In this case, two infinite peaks are always found at the boundary, due to substantial axis-crossing of different particle trajectories. Another peak of finite intensity and wide span appears at the center, following a mechanism similar to that responsible for the arch mode.
The influence of near-wall conveying of particles has been excluded in all the particle flux profiles shown above due to its limited contribution to the particle transmission. As can be seen from , the presence of near-wall conveying implies that particles with intermediate initial radial positions are blocked. Thus, the r po versus r pi curve will be discontinuous; and the flux profiles will contain corresponding discontinuities. In general, these may be expected to be small and of little consequence to the structure of the primary beam. However, the particles transmitted by near-wall conveying can create dispersions beyond the limit of the primary beam. These may appear as small peaks or fluctuations at radial positions outside the beam width in the plot of particle flux profile. Thus, it would not be surprising to observe a non-zero experimental particle flux when the probe is placed outside the expected beam width.
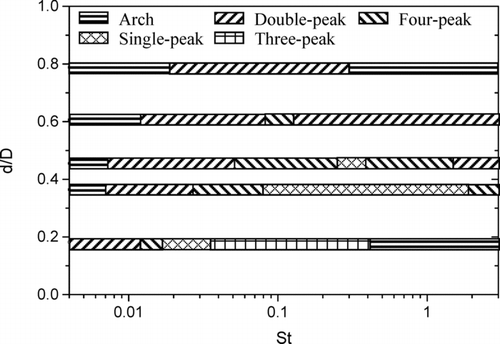
As for the other results obtained in this study, one might expect that St would be a useful index to categorize the particle flux profiles. The results show that this expectation is true. summarizes the regions in which the five particle flux structures are observed. It can be seen that orifice size has a strong effect on mode selection. With increasing orifice size, the arch and double-peak modes shift to large Stokes numbers. On the other hand, some modes appear only at a certain orifice size. For example, the single-peak mode is not observed for d/D = 0.606 and 0.788, and the three-peak mode is found only for d/D = 0.182.
EXPERIMENTAL OBSERVATIONS
The experimental results presented here are compared to calculations made using the model presented above. However, there are several differences in detail between the input parameters used in the calculations above and those used in calculations producing comparison predictions reported in the following. First, the above calculations assumed a simpler lens geometry, that of a straight tube and orifice without the steps in tube inner diameter. Calculations for the actual geometry were therefore performed, leading to some substantially different results for similar parameters. Second, the beam profiles presented above were point values of the flux as a function of radial position. The light scattering experiment would be directly comparable to these calculations if a laser beam with infinitely small depth of focus could be focused exactly at a given radial position. However, the laser beam depth of focus is, for the best focused particle beams, greater than the particle beam width. In this limit, the light scattering is proportional to an integral along a chord through the particle beam. Therefore, the calculated beam profiles displayed in the following are produced by carrying out an integration along the axis of the scattering laser beam. Fluid dynamic calculations allow a wide variety of definitions of “beam diameter.” These include distance between outermost particle trajectories (used in the preceding sections), widths of flux distributions, and full-width-at-half-maximum of the “line-integrated” calculated beam profiles. In the following, we only use this last definition of particle beam diameter.
Particle Beam Profiles
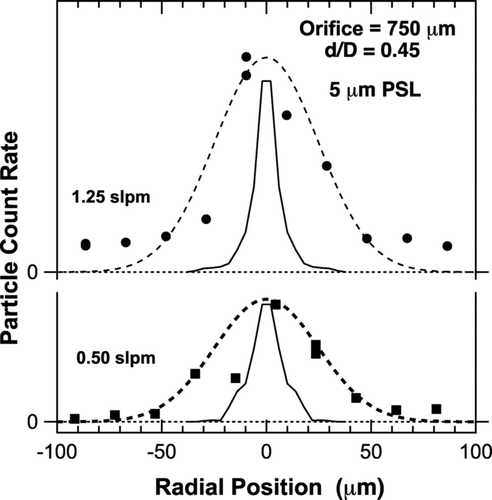
shows light scattering count rates for 5 μ m diameter PSLs at a mass flow rate of 1.25 lpm. The orifice diameter was 0.75 mm (d/D = 0.45) and the observations were obtained at a point 3 mm downstream of the lens exit (x/d = 4). It can be seen that almost all particles are confined to a beam within 50 μ m of the center of the 0.75 mm diameter exit orifice. The faint secondary peaks approximately 225 μ m from beam center are real and have been seen for other conditions. Also shown is the model profile resulting from fluid dynamic calculations, analyzed as described above to match the experimental results using the “line integration” approximation. shows a similar data set, but for an observation point 5 mm downstream of the lens exit (x/d = 7), and on an expanded radial scale. To guide the eye, a Gaussian shape with a beam width (FWHM) of 60 μ m is superimposed on the observed points. Also plotted in is a second data set, for the same particles and downstream position but at a lens flow rate of 0.5 lpm. We note that the two plots in have the same relative scales. In general we observe that the absolute particle count rates scale with the flow rates, although fluctuations in particle concentration from the nebulizers make this observation hard to quantify.
FIG. 10 Light scattering data obtained 3 mm downstream of a lens with a 0.75 mm diameter orifice using 5 micron diameter PSL particles at a flow rate of 1.25 lpm. The solid curve is a prediction based on the fluid dynamic model.
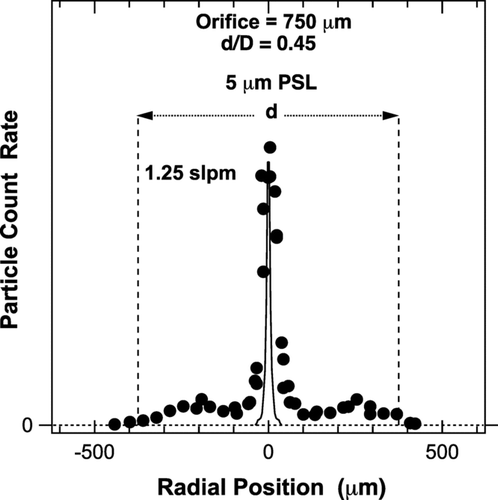
In , a 60 μ m value of FWHM could appear to be an overestimate of the observed width for the data sets, but our experience with a number of such data sets and the expected variance in the individual points led us to adopt this value as representative. The scatter in repeatedly observed points seen in each figure suggests a basis for estimating the reliability of the measurement. Contributions to the variance can come from changes in the particle flux as the nebulizer conditions change, from inaccuracies in positioning the laser beam, and from fluctuations in the particle beam position and width produced as the mixing layer turbulence disturbs the inner, non-turbulent flow. The latter two effects also result in a broader observed particle beam and, coupled with the 12 μ m laser beam waist diameter, suggest that the differences between the observations and calculations (which do not include any effects of turbulence) are reasonable. For these reasons, we do not expect to see a significant difference in beam width between the observations at downstream distances of 3 mm and 5 mm, and they are indeed indistinguishable.
FIG. 11 Similar data to those of , but obtained 5 mm downstream of the lens and plotted on expanded abscissa along with data obtained at a flow of 0.5 lpm. The dashed curves are simply drawn in to guide the eye, based on a larger number of data points, while the solid curves are based on the fluid dynamic model.
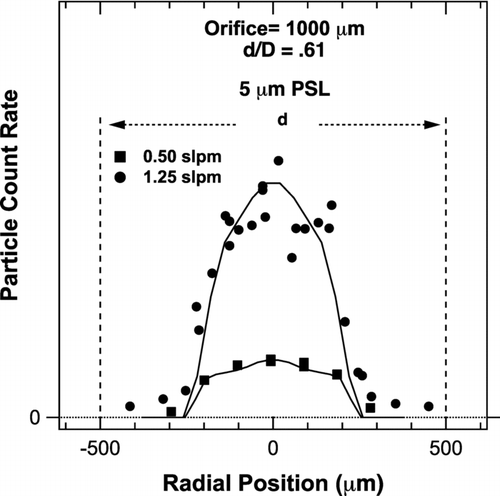
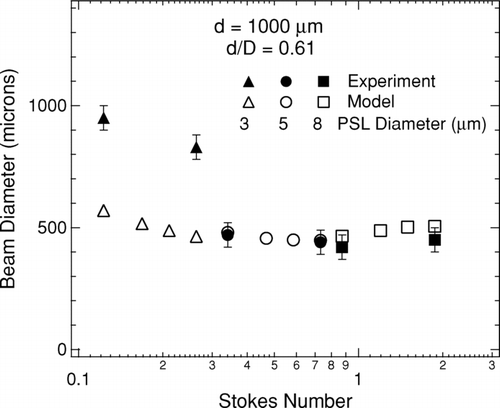
shows light scattering data sets for two cases identical to those in except that the lens exit orifice has been increased from 0.75 mm (d/D = 0.445) to 1 mm (d/D = 0.61). By comparing to and , it can be seen that this small change in exit orifice, with no change in any other lens parameters, changes the lens behavior from dramatic focusing to almost no focusing at all. This is in accord with the fluid dynamic predictions, also plotted in . The agreement between prediction and experiment is better for these larger beams due to the broadening of observed beams by a combination of instrumental effects and slight perturbations of the beam produced by the mixing layer turbulence.
FIG. 12 Light scattering data obtained 5 mm downstream of a lens with a 1.0 mm diameter orifice using 5 micron diameter PSL particles at flow rates of 0.5 and 1.25 lpm. The solid curves are based on the fluid dynamic model.
Similar data were obtained for 3 and 8 μ m diameter particles. All the beam width data are summarized in and , which present beam widths as a function of particle Stokes number for the 0.75 mm and 1 mm apertures, respectively. The error bars (1σ) are estimates of the systematic and random errors associated with the experimental measurements. The qualitative agreement with the modeling results is quite striking, especially with respect to the results for d = 0.75 mm. Both experimental and modeling results for the 0.75 mm aperture in show a distinct minimum within the particle Stokes number range of 0.2 to 1, with a rapid increase in beam width outside this region. As expected, the data in demonstrate that, if the focuser exit orifice is too big (corresponding to d/D > 0.5), focusing is minimal.
FIG. 13 Plot of all observed and calculated particle beam diameters for lens with 0.75 mm diameter exit orifice as a function of particle Stokes number.
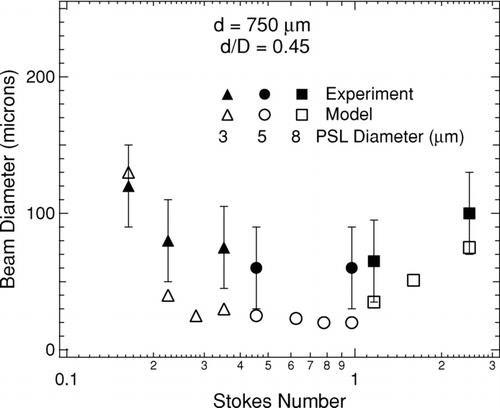
Quantitative agreement between the model and experimental results is also quite good given the limitations of both the experimental data (represented by the error bars in the figures) and the model presented in the preceding sections. One limitation of the model is that it employs an idealized representation of the focuser. For instance, it does not attempt to compute the effects of imperfections in the exit orifice such as rounded edges, surface roughness, and imperfect circularity. Another important limitation of the model is that it assumes completely laminar flow conditions, whereas the flow containing the particle beam may actually be slightly disturbed by the turbulent mixing layer around it. Neglect of these two effects could cause the model to systematically underestimate the beam widths, especially for conditions which produce the smallest beam widths. This expectation is borne out by the data, where the quantitative agreement is excellent for the larger beam widths (beam diameters greater than 100 μ m) but not as good for the smallest beam widths where the experimental values are systematically greater than the modeling results. The fact that the measured beam diameters shown in for 3 μ m diameter particles are much larger than the model predictions may be due to their stronger interaction with the turbulent mixing layer. The 5 μ m particle beams may be similarly dispersed by mixing, but slightly downstream of our observation point, while the somewhat larger 3 μ m particle beams encounter a turbulent mixing layer just upstream of the observation point, leading to discontinuous observations.
FIG. 14 Plot of all observed and calculated particle beam diameters for lens with 1 mm diameter exit orifice as a function of particle Stokes number.
The role of the turbulent mixing layer in eventually dispersing the focused particle beams is supported by additional observations of narrow particle beams downstream of the observation point used in . We observed the particle beam diameter to increase by an order of magnitude at distances between 5 mm and 12 mm downstream of the 0.75 mm orifice, depending on flow rate. All of these observations are consistent with a turbulent mixing layer which begins at the edge of the exit orifice and moves in towards the centerline of the flow, eventually disturbing the concentrated particle beam. In our flow regime, it is reasonable to expect that turbulence should put an upper limit on how far downstream the narrow particle beam can persist. The above observations suggest this limit is between 10 and 20 exit orifice diameters, within the expected range.
Transmission Efficiency
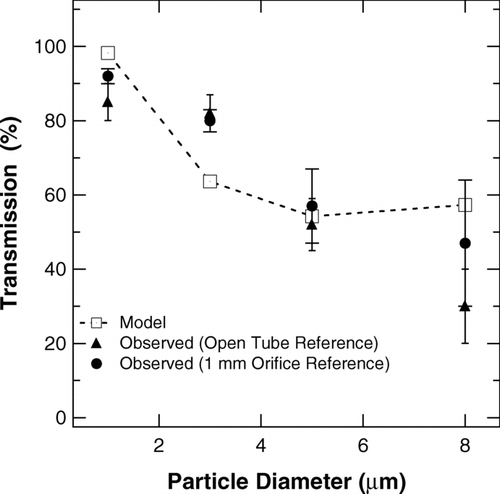
Measurements of transmission efficiency as a function of PSL diameter for a lens with a 0.75 mm diameter orifice (d/D = 0.45) are presented in . The average observed values and error bars (1σ) shown in were obtained from a number of transmission observations. Observed values are plotted for the two configurations described above: the 0.75 mm exit orifice lens compared to an open tube, and the 0.75 mm lens compared to a 1 mm exit orifice lens. Also shown are the values calculated from the simulation, which are in reasonable agreement with the experimental values. Other observations suggest that particle transmission through the lens is better at lower flow rates, presumably the result of fewer particles colliding with internal surfaces of the lens. Unfortunately, these results are only qualitative in nature because of the difficulty in obtaining quantitative information with the optical particle counter at lower flow rates. The flow rate through the optical particle counter analyzer, 1.2 lpm, is fixed by its internal pump. Lower flows through the lens can be obtained by introducing some “makeup” airflow downstream of the lens, near the inlet to the optical particle counter. This procedure, however, adds to the difficulty of obtaining reproducible transmission values. We note that the light scattering profiles in also show lower particle flux outside the central beam for the lower flow rate, again suggesting that fewer particles bounce off walls in the lens.
SUMMARY AND DISCUSSIONS
In summary, we have conducted a numerical and experimental study of the performance of an aerodynamic lens working at atmospheric pressure. A previously unreported “near-wall conveying” phenomenon was discovered, and the resultant phase diagram can be used to determine the fate of certain particles. The contraction ratio, transmission efficiency, beam width, and particle flux profiles were numerically studied for different particle diameters, gas flow rates, and orifice sizes. Based on these calculations, a single-orifice atmospheric pressure aerodynamic lens for particles in the 1 to 10 μ m diameter range was built and the beam width and particle transmission efficiency were characterized by laser light scattering and by a commercial particle counter. Polystyrene latex particles with 3, 5, and 8 μ m diameters were used. For a lens with a 0.75 mm diameter exit orifice, particle beam diameters for 3 to 8 μ m particles were observed to be appreciably less than 100 μ m. When the exit orifice diameter is increased to 1 mm, all particle beam diameters were greater than 400 μ m. Both sets of observations are in accord with fluid dynamic predictions. Due to turbulent mixing (not included in the calculations), the narrow beams persist for only short distances past the exit orifice, typically under 1 cm. This can still allow useful enhancements to the sensitivity of laser point diagnostic techniques. Lens transmission efficiencies are also in accord with the fluid dynamic calculations, and range from near 100% transmission for the small end of the particle size range of interest to around 40% for the largest particles studied.
It is instructive to return to the issue of lens design, as discussed under Preliminary Considerations. We now know that the treatment given there was exceptionally naïve; and that the real design problem involves a web of complex trade-offs. For instance, if transmission efficiency is the primary consideration, then might dominate the design considerations. However, if the ability to focus a range of particle sizes, without too much concern for efficiency, is important, then one would want the V-bottom behavior of , rather than the W-bottom behavior of and . But, if only a single particle size is important, then the behavior of could be desirable. Finally, if beam quality, as reflected by the shape of the flux profile, were to be a dominant concern, then would provide the most pertinent information. Thus, the design developed under Preliminary Considerations for St = 1, might do a rather good job of focusing a range of sizes (see ). In fact, B/d would be about 0.1 for 0.1 < St < 1; and the beam width would therefore be about 70 μ m for 2 μ m < d p < 5 μ m. However, at d p = 5 μ m, the transmission efficiency would only be about 50% (see ). The flux profile () would probably be of the two or four peaked variety; and near wall conveying () would be active. Alternatively, one could have designed a device for which the transmission efficiency would be unity, in which case, would require that St be no more than about 0.1. would then suggest that d/D should be about 0.35; and assures us that near-wall conveying will be absent under these conditions. Finally, indicates that the particle flux profile will be of the desirable single peak variety. Thus, given d/D = 0.35, St = 0.1, and Q = 1 lpm, a better design might have been d equals; 1.25 mm and D = 3.56 mm. This design also would have had the desirable effect of reducing the orifice Reynolds number from about 1800 to about 1050. The beam width would be about 150 μ m. Unfortunately, this design is aimed very specifically at particles with a diameter of 5 μ m; and performance degrades very rapidly if d p assumes any other value.
It is also interesting to ask about using a fixed device to focus particles of a different size than that for which the device was originally designed. For instance, one might want to focus 1 μ m particles in one of the above devices that were designed for 5 μ m particles. One would need to keep the Stokes number constant, so Equation (Equation1) requires that, if d p is decreased by a factor of five, the velocity must be increased by a factor of 25 – to 25 lpm. This is entirely feasible, but it might prompt an even earlier transition to turbulence within the jet. If one wished to build a new device to focus 1 μ m particles, but maintain the Reynolds number and the volumetric flow rate constant, it would be necessary to reduce the size of the device by a factor of five, in which case, the fabrication becomes difficult. Thus, using the existing device, but increasing the flow rate, raises a turbulence question to which the answer is currently unknown; and building a new device at constant volumetric flow rate leads to an unattractively small size. Some combination of smaller size and increased flow rate would likely work, but it can be demonstrated only through experimentation.
In conclusion, this study provides an experimentally verified basis for the design of aerodynamic lenses for a range of interrelated parameters including particle size, gas flow rate, operating pressure, beam diameter, and beam persistence length. While this is not the first report of focusing in beams of micron-size particles at ambient pressures using a single-orifice aerodynamic lens (see CitationFuerstenau, Gomez, and Fernandez de la Mora, 1994), it adds useful quantitative predictions and experimental observations in regimes of particle size and operating pressure that have received relatively little previous study.
Acknowledgments
This work was supported by Small Business Innovation Research Phase II contract DAAD19-03-C-0133 from the U.S. Army Research Office. The content of this article does not necessarily reflect the position or the policy of the Government, and no official endorsement should be inferred.
REFERENCES
- Cheng , Y. S. and Dahneke , B. E. 1979 . Properties of Continuum Source Particle Beams. II. Beams Generated in Capillary Expansions . J. Aerosol Sci. , 10 : 363 – 368 .
- Dahneke , B. E. 1978 . “ Aerosol Beams ” . In Recent developments in aerosol science , Edited by: Shaw , D. T. 187 – 223 . New York : John Wiley & Sons .
- Dahneke , B. E. and Cheng , Y. S. 1979 . Properties of Continuum Source Particle Beams. I. Calculation Methods and Results . J. Aerosol Sci. , 10 : 257 – 274 .
- Dahneke , B. E. and Padliya , D. 1977 . “ Nozzle-inlet design for aerosol beam instruments ” . In Rarefied Gas Dynamics , Edited by: Potter , J. J. Vol. II , 1163 – 1172 . New York : AIAA .
- Fehsenfeld , F. , Hastie , D. , Chow , J. and Solomon , P. 2004 . “ Particle and Gas Measurements ” . In Particulate Matter Science for Policy Makers: A NARSTO Assessment , Edited by: McMurry , P. , Shepherd , M. and Vickery , J. 159 – 189 . New York : Cambridge University Press .
- Fuerstenau , S. , Gomez , A. and Fernandez de la Mora , J. 1994 . Visualization of Aerodynamically Focused Subsonic Aerosol Jets . J. Aerosol Sci , 25 : 165 – 173 .
- Gomez-Moreno , F. J. , Rosell-Llompart , J. and Fernandez de la Mora , J. 2002 . Turbulent Transition in Impactor Jets and its Effects on Impactor Resolution . J. Aerosol Sci. , 33 : 459 – 476 .
- Jayne , J. T. , Leard , D. L. , Zhang , X. , Davidovits , P. , Smith , K. A. , Kolb , C. E. and Worsnop , D. R. 2000 . Development of an Aerosol Mass Spectrometer for Size and Composition Analysis of Submicron Particles . Aerosol Sci. Technol. , 33 : 49 – 70 .
- Lee , J.-W. , Yi , M.-Y. and sand Lee , S.-M. 2003 . Inertial Focusing of Particles with an Aerodynamic Lens in the Atmospheric Pressure Range . J. Aerosol Sci. , 34 : 211 – 224 .
- Liu , P. , Ziemann , P. L. , Kittelson , D. B. and McMurry , P. H. 1995a . Generating Particle Beams of Controlled Dimensions and Divergence: I. Theory of Particle Motion in Aerodynamic Lenses and Nozzle Expansions . Aerosol Sci. Technol. , 22 : 293 – 313 .
- Liu , P. , Ziemann , P. L. , Kittelson , D. B. and McMurry , P. H. 1995b . Generating Particle Beams of Controlled Dimensions and Divergence: II. Experimental Evaluation of Particle Motion in Aerodynamic Lenses and Nozzle Expansions . Aerosol Sci. Technol. , 22 : 314 – 324 .
- Mallina , R. V. , Wexler , A. S. and Johnston , M. V. 1999 . High-Speed Particle Beam Generation: Simple Focusing Mechanisms . J. Aerosol Sci. , 30 : 719 – 738 .
- Mallina , R. V. , Wexler , A. S. , Rhoads , K. P. and Johnston , M. V. 2000 . High Speed Particle Beam Generation: a Dynamic Focusing Mechanism for Selecting Ultrafine Particles . Aerosol Sci. Technol. , 33 : 87 – 104 .
- McNaughton , K. J. and Sinclair , C. G. 1966 . Submerged Jets in Short Cylindrical Flow Vessels . J. Fluid Mech. , 25 : 367 – 375 .
- Murphy , D. M. , Cziczo , D. J. , Hudson , P. K. , Schein , M. E. and Thomson , D. S. 2004 . Particle Density Inferred from Simultaneous Optical and Aerodynamic Diameters Sorted by Composition . J. Aerosol Sci. , 35 : 135 – 139 .
- Pan , Y. L. , Hartings , J. , Pinnick , R. G. , Hill , S. C. , Halverson , J. and Chang , R. K. 2003 . Single-Particle Fluorescence Spectrometer for Ambient Aerosols . Aerosol Sci. Technol. , 37 : 628 – 639 .
- Schreiner , J. , Schild , U. , Voigt , C. and Mauersberger , K. 1999 . Focusing of Aerosol into a Beam at Pressure from 10 to 150 Torr . Aerosol Sci. Technol. , 31 : 373 – 382 .
- Schreiner , J. , Voigt , C. , Mauersberger , K. , McMurry , P. and Ziemann , P. 1998 . Aerodynamic Lens System for Producing Particle Beams at Stratospheric Pressure . Aerosol Sci. Technol. , 29 : 50 – 56 .
- Sullivan , R. C. and Prather , K. A. 2005 . Recent Advances in Our Understanding of Atmospheric Chemistry and Climate Made Possible by On-Line Aerosol Analysis Instrumentation . Anal. Chem. , 77 : 3861 – 3886 .
- Wang , X. and McMurry , P. H. 2006 . A Design Tool for Aerodynamic Lens Systems . Aerosol Sci. Technol. , 40 ( 5 ) : 320 – 334 .
- Zhang , X. , Smith , K. A. , Worsnop , D. R. , Jimenez , J. , Jayne , J. T. and Kolb , C. E. 2002 . A Numerical Characterization of Particle Beam Collimation by an Aerodynamic Lens-Nozzle System: Part I. An Individual Lens or Nozzle . Aerosol Sci. Technol. , 36 : 617 – 631 .
- Zhang , X. , Smith , K. A. , Worsnop , D. R. , Jimenez , J. , Jayne , J. T. , Kolb , C. E. , Morris , J. and Davidovits , P. 2004 . Numerical Characterization of Particle Beam Collimation: Part II Integrated Aerodynamic-Lens-Nozzle System . Aerosol Sci. Technol. , 38 : 619 – 638 .
