Abstract
Online measurement of the effective density of both spherical aggregated and ordered porous particles was systematically investigated using differential mobility analyzer-aerosol particle mass analyzer (DMA-APM). Effective density was determined based on the relationship between electric mobility and mass; mobility and mass were measured using DMA and APM, respectively. The particles were prepared using a spray-drying method; a colloidal suspension of silica nanoparticles was used as the precursor, and both nanoparticles and polystyrene latex (PSL) particles were used to generate the aggregated and ordered porous particles. The effective density of aggregated particles decreased from 1916.0 to 1565.2 kg/m3 when the primary particle size was increased from 6 to 100 nm. The effects of pore size and fraction, which were controlled by PSL particle concentration and size, on the effective density of ordered porous particles were also investigated. The effective density of the ordered porous particles decreased from 922.2 to 682.3 kg/m3 with increasing the porosity from 58.1 to 69.0%, and negligibly affected by individual pore size in a particle. The accuracy of the effective density measurement based on the DMA-APM was greater than 97%. In addition, this method effectively determined particle porosity, as compared by the light-scattering method, with a difference of less than 5% between methods.
INTRODUCTION
Accurate online measurement of the effective density of suspended aerosol particles is needed in both atmospheric environments and fine particle production. Particle density is a determinant of particulate air quality (CitationPark et al. 2003b). Density is also needed to determine mass distribution from number distribution data (CitationMcMurry et al. 2002). In addition, the density of suspended aerosol particles is an important determinant of the adverse health effects of these particles, as it controls both particle transport and deposition in the lungs. However, determination of particle density is difficult because suspended aerosol particles are vary in shape from nearly spherical primary particles to fractal-like agglomerate structures. Particle density is influenced by particle morphology, size and porosity, and differs from the effective density of both the bulk and compact forms.
Several methods have been developed to measure the density of aerosol particles. Early density measurements were based on the determinations of aerosol particles volume and mass independently (CitationHanel and Thudium 1977). A comparison of the three methods of density measurement has been reported (CitationKousaka et al. 1981): (1) separate measurements of mass concentration by piezo-electric mass monitor and size distribution based on the Stokes diameter. The aerosol density is assumed first and re-measured to obtain the unchanged aerosol density value; (2) simultaneous measurement of gravitational settling velocity and electrical mobility; and (3) balance of gravitational and Coulomb's force. Balance between the gravitational and Coulomb's force was recommended for measurement of density for spherical aerosol particles greater than 500 nm in diameter because of its ease and accuracy. Particle porosity can be determined from their density. The use of light scattering for characterization of the aggregated particles, such as particle size, structure factor, mass density distribution and morphology analysis has been reviewed by CitationSorensen (2001). Previously, we used this method to determine the porosity of both spherical aggregated and macroporous silica particles (CitationChang and Okuyama 2002), as well as of porous silica-carbon composite particles (CitationChang et al. 2003). However, most of these density-measurement methods were off-line, complicated, and time consuming.
A new technique that measures particle density using a differential mobility analyzer-particle mass analyzer (DMA-APM) was recently introduced (CitationMcMurry et al. 2002). APM allows for particle classification by balancing the electrostatic and centrifugal forces according to the mass-to-charge ratio (CitationEhara et al. 1996). The DMA-APM method has been applied to measurement of the density of airborne particles, such as diesel exhaust particles (CitationPark et al. 2003a), airborne carbon nanofibers (CitationKu et al. 2006) and urban atmospheric particles (CitationGeller et al. 2006; CitationMcMurry et al. 2002). This method has also been used to determine the density of nanoparticle aggregates and of chains agglomerated particles (CitationLall et al. 2008; CitationPark et al. 2004). The evaluated particles had size range of 100–300 nm and the density measurement agreed well with accuracy about 5%. Particles evaluated using this method ranged in size from 50–300 nm and the density measurements were highly consistent—within approximately 5% of one another.
Controlled, ordered porous particles have the potential for use in many applications, such as catalyst materials (CitationIskandar et al. 2007) and controlled drug release (CitationVanbever et al. 1999). Porous particles with mass density of less than 0.4 g/cm3 can be used to deliver drugs to the lungs (CitationVanbever et al. 1999). We previously reported that ordered porous particles can be prepared within several seconds using a spray-drying method (CitationIskandar et al. 2001b). Ordered porous particles with controlled pore size and porosity have also been investigated by our group (CitationIskandar et al. 2002). To the best of our knowledge, measurement of the density of controlled aggregated and ordered porous particles, which were generated by spray-drying, using the DMA-APM method has not previously been reported. Therefore, accurate online measurement of the density of both suspended aerosol particles of aggregates and ordered porous particles is necessary for high performance particle-production applications. In addition, accurate online density measurement in environmental applications would reduce the negative effects of suspended aerosol particles on human health.
In this study, we investigated the DMA-APM method for measurement of the effective density of both spherical aggregate particles and ordered porous particles with controlled size prepared using the spray-drying method. Dense PSL and silica particles were selected for verification of the DMA-APM method. The effects of primary particle size on density were also examined in aggregated silica particles. The effects of both pore size and fraction on density measurement were also investigated. Furthermore, particle porosity was also evaluated using this method.
EXPERIMENTAL
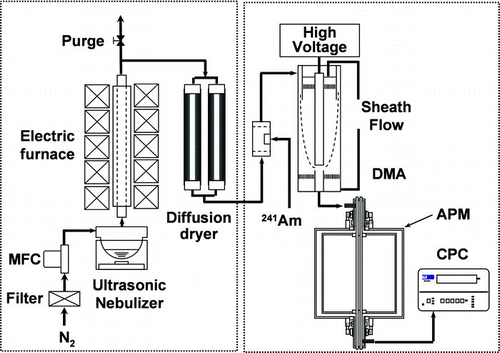
The experimental procedure consisted of particle generation and measurement of particle mass, as shown in . Particles were generated using a spray-drying process, as described previously (CitationIskandar et al. 2001a). The spray-drying apparatus consisted of an ultrasonic nebulizer (1.7 MHz, NE-U17, Omron Healthcare Co., Ltd., Japan) for droplet generation, an electrical tubular furnace, and two tubular diffusion dryers for absorption of water vapor that results from droplet evaporation in the furnace. The density measurement system consisted of a differential mobility analyzer (DMA, Model 3081, TSI Inc., USA), an aerosol particle mass analyzer (APM, Model 3600, Kanomax Inc., Japan) and a condensation particle counter (CPC, Model 3022, TSI Inc., USA).
FIG. 1 Schematic diagram of the experimental setup.
Particle Preparation
The conditions of sample preparation used in this study are summarized in . Spherical, dense PSL and silica particles were used as the standard particles for purposes of calibration. The PSL standard particles were 207 and 309 nm in diameter, whereas the silica particles were 320 nm in diameter; the standard particles were denoted as S1, S2, and S3, respectively. The standard particles were obtained by spraying a dilute solution (0.05 wt%) of colloidal particles into a 120°C furnace, using nitrogen as the carrier gas at flow rate of 1.2 L/min. Spherical, dense particles were derived from individual primary particles of the colloidal suspension.
TABLE 1 Experimental conditions for preparation of standard, aggregated, and ordered porous particles
Aggregated and porous silica particles were selected as model materials, as described in . Colloidal silica nanoparticles, with homogenous colloidal sizes of 6, 27, and 100 nm (Nissan Chemical Industry, Co., Japan), were used as precursors in the generation of aggregated silica particles of samples A, B, and C, respectively, as described in . The sizes of colloidal particles in precursor were homogenous because the standard deviation of particle size distribution was less than 1.4. Their standard deviation measured using TEM were in the ranges of 1.12–1.20 (CitationChang and Okuyama 2002). To preserve particle size, as-prepared colloidal silica nanoparticles were diluted with ultrapure water to obtain colloidal silica nanoparticle precursors at a concentration of 0.05 wt%. The colloidal precursor was then atomized using an ultrasonic nebulizer to generate droplets with an average diameter of approximately 5 μ m (CitationIskandar et al. 2003). Nitrogen carrier gas transported the droplets at a flow rate of 0.75 L/min into the 120°C tubular furnace.
FIG. 2 Schematic diagram of the formation of (a) aggregated and (b) ordered porous particles using the spray-drying method.
Porous silica particles were generated using colloidal silica nanoparticles and polystyrene latex (PSL) as precursors. The experimental procedure that was used to generate silica particles containing organized pores has been described previously (CitationIskandar et al. 2001b) The colloidal silica nanoparticles were 5 nm in diameter (Nissan Chemical Industry, Co., Japan) and the PSL particles were 80 and 100 nm in diameter (Japan synthetic rubber, Japan). Samples D and E of the ordered porous particles were prepared using the precursor by mixing 10 ml of the 0.05 wt% colloidal silica suspension with 0.5 and 1 ml of 1 wt% 100 nm PSL particles, respectively. Sample F, which consisted of smaller pore particles, was prepared by mixing 10 ml of the 0.05 wt% colloidal silica suspension with 1 ml of 1 wt% 80 nm PSL particles, which were used as the precursor. Droplets of the precursors were generated by spraying and carried by nitrogen gas at flow rate of 0.75 L/min into the tubular furnace that had two temperature zones—120 and 600°C. In the low-temperature zone, the solvent evaporated from the droplets, to generate composite silica particles and PSL nanoparticles. In the high-temperature zone, the PSL nanoparticles evaporated, resulting in ordered porous silica particles. The resulting particles were examined using a field-emission scanning electron microscope (FE-SEM, S-5000, Hitachi Corp., Japan).
Density Measurement
The DMA-APM method was used to determine the effective density of particle. This method involved two consecutive measurements: first, selection of particles of a known electrical mobility using DMA; and, second, measurement of particle mass using APM (CitationMcMurry et al. 2002). The DMA classifies the particles to their similarity of electrical mobilities, Z p . The relationship between electrical mobility and mobility equivalent diameter of particle, d p is given by the following equation:
The APM classifies particles based on mass-to-charge ratio (CitationEhara et al. 1996). The system consists of two rotating coaxial cylindrical electrodes, with outer and inner radii of 52 and 50 mm, respectively, and height of 250 mm, as shown in . The coaxial cylindrical electrodes rotate at the same angular velocity, ω. Voltage, V, is applied between the electrodes where the particles pass through. This method depends on the voltage and angular velocity of the electrodes. The particles are classified by balancing the centrifugal and electrostatic forces. When these forces are equal, particles will penetrate through the rotating cylinders to the downstream detector. The balance between the forces can be described by the following equation:
FIG. 3 Schematic diagram illustrating the principle behind the aerosol particle mass analyzer (APM).
RESULT AND DISCUSSION
Morphology of the Generated Aerosol Particles
shows the FE-SEM images of spherical, dense 207 and 309 nm PSL particles, and spherical, dense 320 nm silica particles, that were used as standard particles for measurement of density using the DMA-APM method.
FIG. 4 FE-SEM images of: standard particles, (a) S1, (b) S2, (c) S3; samples of aggregated particles, (d) A, (e) B, (f) C; and, samples of ordered porous particles, (g) D, (h) E, and (i) F. The details of the operation conditions are summarized in .
FE-SEM images of mono-dispersed, aggregated silica particles that were classified as 300 nm particles using DMA, are shown in . These aggregated particles were comprised of 6, 27, and 100 nm primary particles, as shown in , respectively; these sizes were equivalent to those of samples A, B, and C, respectively, as shown in . The effective porosity of the aggregated particles increased with increasing primary particle size.
FE-SEM images of porous particles with different pore fraction (porosity) and pore size are shown in . The three types of porous particles were DMA-selected particles, 300 nm in diameter, which have the same mobility equivalent diameters. Therefore, the porosity does not affect the mobility sizing. This result is confirmed by our previous observation that porous particles have the same mobility as dense particles (CitationChang and Okuyama 2002). Increasing the PSL concentration increased particle porosity, as shown in samples D and E (). This result demonstrates that the porosity was easily controlled by adjustment of the PSL concentration. shows the FE-SEM image of the ordered porous particles in sample F, which revealed an increase in pore number with the use of 80 nm PSL particles at the same concentration as used in sample E.
Density Measurement by DMA-APM Method
To calibrate the density measurement using the DMA-APM method, spherical, dense 207 and 309 nm PSL particles and 320 nm silica particles were used. The rotational speed of APM was kept constant at 2000 rpm. According to the manufacturers, densities of the dense PSL and silica particles were 1056 and 2200 kg/m3, respectively. These values were used to calculate the percent error of the density of standard particles, as measured using the DMA-APM method. shows the measurement of the concentration of APM outlet/inlet of 309 nm PSL standard particles (S2) as a function of APM response voltage. The measured and theoretical values provided by CitationEhara et al. (1996) were in agreement. Plots of response voltage as a function of APM outlet concentration for the other two standard particles (S1 and S3) are shown in . The percent error was 2.3 and 2.6% for the S1 and S3 particles, respectively. The peak response voltages that corresponded to the maximal APM outlet concentration of the 207 and 309 nm PSL particles and the 320 nm silica particles were 142.42, 476.16, and 1101.24 V, respectively, or 1079.9, 1084.4, and 2258.5 kg/m3, respectively, as calculated using Equation (Equation2). The measured densities of standard particles are summarized in . The maximum percent error was 3.0%, indicating that this method has good accuracy.
FIG. 5 Comparison of APM outlet/inlet concentrations of 309 nm PSL particles (S2), measured using APM as a function of response voltage, and the theoretical values provided by Ehara et al. 1996.
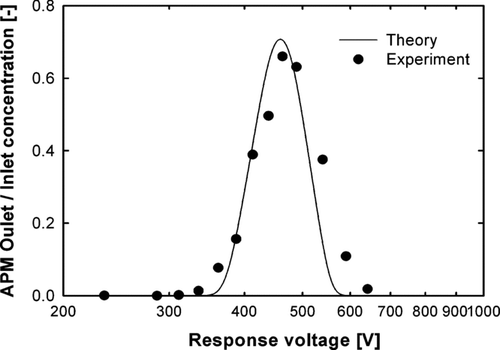
FIG. 6 APM outlet concentration as a function of response voltage of 207 nm PSL particles and dense, 320 nm, silica particles (S1 and S3).
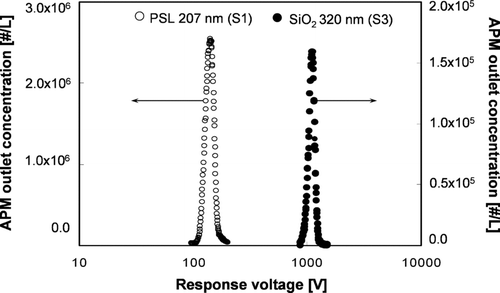
TABLE 2 Densities of the standard particles
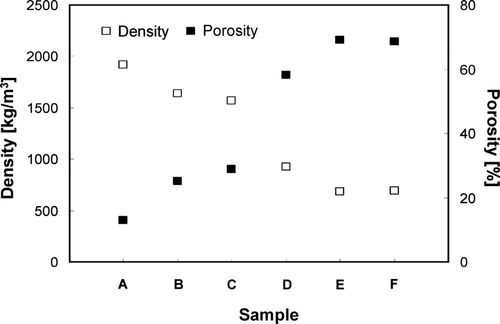
The response voltage distributions of 300 nm aggregate silica nanoparticles, as determined by DMA, and primary particles sizes of 6, 27, and 100 nm (samples A, B and C) are shown in . The maximum voltage response peaks of aggregate particles with primary particles sizes of 6, 27, and 100 nm were 740.3, 669.9, and 627.1 V, respectively. These voltages correspond to measured densities of 1916.0, 1640.3, and 1565.2 kg/m3, respectively. An increase in the primary particle size of aggregate particles leads to a decrease in response voltage, which results in a reduction in measured density. The measured densities of aggregate silica particles were less than that of dense silica particles, indicating that, in the aggregate silica particles, there are empty spaces among the primary particles. The volume of empty space increased with increasing primary particle size, leading to a reduction in measured density. The porosity values of aggregate particles with primary particles sizes of 6, 27, and 100 nm calculated using Equation (Equation4) were 12.9, 25.0, and 28.8%, respectively. Peak response voltage, measured density and porosity of the aggregate silica particles are given in .
FIG. 7 APM outlet concentration as a function of response voltage of aggregated silica particles.
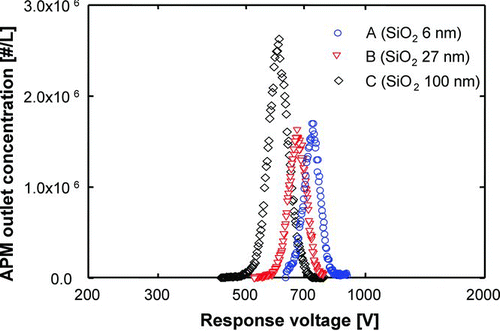
TABLE 3 Densities and porosities of aggregated and ordered porous particles
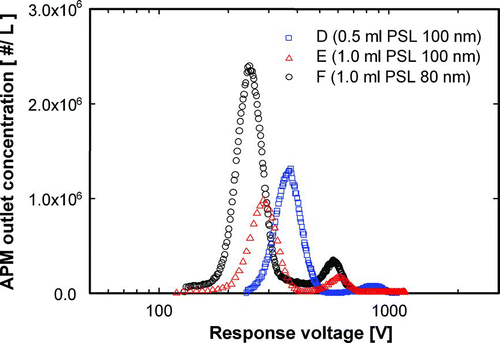
shows the distribution of the response voltage of spherical, ordered, porous particles of samples D, E, and F, the synthesis conditions of which are presented in . The effect of the fraction of empty space in porous particles on density measurement was evaluated using samples D and E, which were synthesized using precursors with silica-to-PSL volume ratio of 10:0.5 and 10:1, respectively. Using these precursor ratios, the porous fraction of sample D was less than that of sample E. The response voltage was correlated with the porous fraction, such that the response voltage peaks of samples D and E were 369.5 and 277.6 V, respectively. A second peak of the second mode of the response voltage distribution was observed. This peak was caused by the double-charged particles and can be considered noise. This noise was ignored because the single-charged particles out-numbered the double-charged particles, as shown in the figure. The densities of samples D and E measured using the DMA-APM method were 922.2 and 682.3 kg/m3, respectively, and the porosities, calculated using Equation (Equation4), were 58.1 and 69.0%, respectively. The response voltage peak, measured density and porosity of porous particles, which are summarized in , indicate that density is influenced by particle porosity, while the influence of pore size is negligible. Samples E and F were synthesized by spray-drying using a precursor with the same silica-to-PSL volume ratio of 10:1, but 100 and 80 nm PSL, respectively. As shown in , the APM measurement indicated that the response voltage distributions of samples E and F are similar, with peak values of 277.6 and 273.4 V. These voltages correspond to densities of 682.3 and 691.6 kg/m3 and porosities of 69.0 and 68.5% for samples E and F, respectively.
FIG. 8 APM outlet concentration as a function of response voltage of ordered porous silica particles.
more clearly illustrates the comparison of density and porosity of aggregated and ordered porous particles. The density of the aggregated particles decreased as the size of colloidal silica primary nanoparticles increased for same particle size. Conversely, porosity increases with the size of the primary particles, as shown in . The density of ordered porous particles was less than that of aggregate particles due to the increase in the fraction of unoccupied space in the ordered particles. When equivalent PSL fractions were used in the precursor, during synthesis, the densities were nearly identical. Density declined as the PSL fraction in the precursor was increased, leaving a larger fraction of unoccupied space in the ordered porous particles. As shown in , porosity was inversely correlated with density.
FIG. 9 Densities, as measured using the DMA-APM method, of aggregated and ordered porous silica particles of samples A, B, C, D, E, and F, the experimental conditions of which are described in .
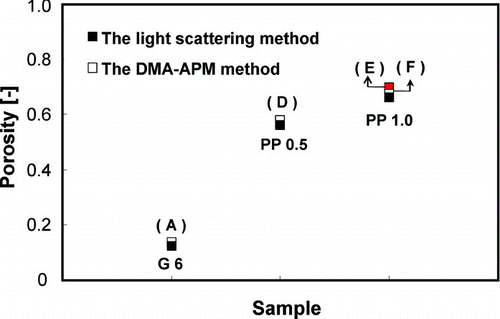
shows the comparison between porosity values calculated using the DMA-APM method and scattering intensity determined using a laser particle counter-pulse height analyzer (LPC-PHA) in our previous paper (CitationChang and Okuyama 2002). The porosity of aggregated silica particles with primary particle sizes of 6 (in CitationChang and Okuyama (2002) called G6), as measured using the LPC-PHA method, were compared to samples A. Ordered porous particles of PP0.5 and PP1.0, as measured by LPC-PHA (CitationChang and Okuyama 2002) under the same as conditions used for samples D and E measured using the DMA-APM method, were also compared. PP0.5 and PP1.0 denote the porous particles that were synthesized using an 0.5 and 1.0 ml of PSL suspension, respectively. Sample F, which was prepared using a precursor with the same PSL particle concentration with sample E, was also evaluated to verify that the effect of pore size on porosity can be ignored. As shown in , the two methods gave consistent results for the porosity of aggregate and porous particles, with maximal discrepancies of approximately 5%. This result suggests that DMA-APM is a very precise method for measurement of both particle porosity and density.
FIG. 10 Comparison of particles porosities determined using the DMA-APM and light-scattering methods.
CONCLUSION
Measurement of the density of aggregated and ordered porous silica particles that were prepared using the spray-drying method was investigated based on particle electrical mobility and mass obtained using the DMA-APM method. Silica nanoparticles 6, 27, and 100 nm in size were used as primary particles to investigate the effects of compactness on the measurement of density of aggregated particles that were selected to be 300 nm in diameter using DMA. Density decreased as primary particle size increased. In the case of ordered porous particles, density measurement was strongly influenced by the pore fraction. Particles that were synthesized using precursors with silica-to-PSL volume ratios of 10:0.5 and 10:1 were 922.2 and 682.3 kg/m3, respectively. In contrast, pore size had a negligible effect on density measurement. Pore sizes of 80 and 100 nm gave densities of 691.6 and 682.3 kg/m3, respectively. The accuracy of this method was high, with percent error less than 3% using the densities provided by the manufacturer as the basis of the calculation. In addition, the DMA-APM method can also be used to determine particle porosity, as confirmed by the light-scattering method with differences between the two methods of less than 5%.
Related Research Data
REFERENCES
- Chang , H. , Okuyama , K. and Szymanski , W. W. 2003 . Experimental Evaluation of the Optical Properties of Porous Silica/Carbon Composite Particles. . Aerosol Sci. Technol. , 37 : 735 – 751 .
- Chang , H. W. and Okuyama , K. 2002 . Optical Properties of Dense and Porous Spheroids Consisting of Primary Silica Nanoparticles. . J. Aerosol Sci. , 33 : 1701 – 1720 .
- Ehara , K. , Hagwood , C. and Coakley , K. J. 1996 . Novel Method to Classify Aerosol Particles According to their Mass-to-Charge Ratio—Aerosol Particle Mass Analyser. . J. Aerosol Sci. , 27 : 217 – 234 .
- Geller , M. , Biswas , S. and Sioutas , C. 2006 . Determination of Particle Effective Density in Urban Environments with a Differential Mobility Analyzer and Aerosol Particle Mass Analyzer. . Aerosol Sci. Technol. , 40 : 709 – 723 .
- Hanel , G. and Thudium , J. 1977 . Mean Bulk Densities of Samples of Dry Atmospheric Aerosol Particles: A Summary of Measured Data. . Pure Appl. Geophys. , 115 : 799 – 803 .
- Iskandar , F. , Gradon , L. and Okuyama , K. 2003 . Control of the Morphology of Nanostructured Particles Prepared by the Spray Drying of a Nanoparticle Sol. . J. of Colloid Interf. Sci. , 265 : 296 – 303 .
- Iskandar , F. , Lenggoro , I. W. , Kim , T. O. , Nakao , N. , Shimada , M. and Okuyama , K. 2001a . Fabrication and Characterization of SiO2 Particles Generated by Spray Method for Standards Aerosol. . J. Chem. Eng. Jpn. , 34 : 1285 – 1292 .
- Iskandar , F. , Mikrajuddin and Okuyama , K. 2001b . In Situ Production of Spherical Silica Particles Containing Self-Organized Mesopores. . Nano Lett. , 1 : 231 – 234 .
- Iskandar , F. , Mikrajuddin and Okuyama , K. 2002 . Controllability of Pore Size and Porosity on Self-Organized Porous Silica Particles. . Nano Lett. , 2 : 389 – 392 .
- Iskandar , F. , Nandiyanto , A. B. D. , Yun , K. M. , Hogan , C. J. , Okuyama , K. and Biswas , P. 2007 . Enhanced Photocatalytic Performance of Brookite TiO2 Macroporous Particles Prepared by Spray Drying with Colloidal Templating. . Adv. Mater. , 19 : 1408 – 1413 .
- Kousaka , Y. , Okuyama , K. , Endo , Y. and Tanaka , H. 1981 . Comparison Among Measuring Methods of Density of Spherical Aerosol Particles. . J. Chem. Eng. Jpn. , 14 : 214 – 218 .
- Ku , B. K. , Emery , M. S. , Maynard , A. D. , Stolzenburg , M. R. and McMurry , P. H. 2006 . In Situ Structure Characterization of Airborne Carbon Nanofibres by a Tandem Mobility-Mass Analysis. . Nanotechnology , 17 : 3613 – 3621 .
- Lall , A. A. , Rong , W. , Madler , L. and Friedlander , S. K. 2008 . Nanoparticle Aggregate Volume Determination by Electrical Mobility Analysis: Test of Idealized Aggregate Theory Using Aerosol Particle Mass Analyzer Measurements. . J. Aerosol Sci. , 39 : 403 – 417 .
- McMurry , P. H. , Wang , X. , Park , K. and Ehara , K. 2002 . The Relationship between Mass and Mobility for Atmospheric Particles: A New Technique for Measuring Particle Density. . Aerosol Sci. Technol. , 36 : 227 – 238 .
- Park , K. , Cao , F. , Kittelson , D. B. and McMurry , P. H. 2003a . Relationship Between Particle Mass and Mobility for Diesel Exhaust Particles. . Environ. Sci. Technol. , 37 : 577 – 583 .
- Park , K. , Kittelson , D. B. and McMurry , P. H. 2003b . A Closure Study of Aerosol Mass Concentration Measurements: Comparison of Values Obtained with Filters and by Direct Measurements of Mass Distributions. . Atmos. Environ. , 37 : 1223 – 1230 .
- Park , K. , Kittelson , D. B. , Zachariah , M. R. and McMurry , P. H. 2004 . Measurement of Inherent Material Density of Nanoparticle Agglomerates. . J. Nanopart. Res. , 6 : 267 – 272 .
- Sorensen , C. M. 2001 . Light Scattering by Fractal Aggregates: A Review. . Aerosol Sci. Technol. , 35 : 648 – 687 .
- Vanbever , R. , Mintzes , J. D. , Wang , J. , Nice , J. , Chen , D. H. , Batycky , R. , Langer , R. and Edwards , D. A. 1999 . Formulation and Physical Characterization of Large Porous Particles for Inhalation. . Pharm. Res. , 16 : 1735 – 1742 .