Abstract
Recent improvements in single particle mass spectrometers make it possible to optically detect, size, and characterize the compositions of individual particles with diameters larger than a micron and smaller than 100 nm. In these instruments, two stages of optical detection are used to generate a precisely timed trigger pulse that is used to fire the ion generation laser or lasers. However, experience shows that the wide particle size range results in significant differences in laser trigger timing between small and large particles. If not treated these differences produce an instrument with size dependent hit-rate. In this case the operator is forced to optimize the instrument for the desired size range, while contending with a significantly lower hit-rate for other particle sizes. This article presents an analysis of the phenomenon and demonstrates that the dependence of laser trigger timing on particle size stems from the differences in the particle position within the detection laser beam at the instant of detection. We demonstrate that it is possible to compensate for these differences by generating, for each particle, a laser trigger delay coefficient that is a function of particle's time of flight, i.e., its vacuum aerodynamic size. The study also shows that a single function can be used to eliminate the size bias for particles with a wide range of densities.
INTRODUCTION
Single particle mass spectrometers (SPMSs) are designed to characterize the size and composition of individual ambient particles (CitationHinz and Spengler 2007; CitationJohnston 2000; CitationMcMurry 2000; CitationMurphy 2007; CitationNash et al. 2006; CitationNoble and Prather 2000; CitationSuess and Prather 1999; CitationSullivan and Prather 2005). Here, ambient, most often refers to the atmosphere, in which particle compositions are complex and particle sizes range from a few nanometers to tens of microns. One of the challenges that SPMSs face is the need to develop the capability to characterize a wide-range of particle sizes and do so with minimal bias. Recent developments advanced the capabilities of SPMSs making it possible to use these instruments to characterize ultrafine particles, which often constitute the vast majority of the atmospheric aerosol population.
At present, there are two general approaches to simultaneously measure the size and composition of individual aerosol particles. One approach relies on pre-selecting a narrow distribution of particle sizes, either by aerodynamic focusing, or by using a Differential Mobility Analyzer to classify monodisperse aerosol, and firing an ablation laser at a constant rate to form ions and generate mass spectra (CitationKane et al. 2001; CitationPark et al. 2005; CitationPhares et al. 2002). While this approach has been proven to work, it relies on random coincidences for the laser to hit a particle and as a result suffers from a low sampling rate (CitationMurphy 2007) and hence provides poor temporal resolution.
An alternative approach is based on optical detection of individual particles and the generation of a laser trigger that is timed to coincide with the arrival of the particle into the ionization region of the mass spectrometer (CitationMckeown et al. 1991; CitationMurphy et al. 2004; CitationNash et al. 2005; CitationSu et al. 2004; CitationThomson et al. 2000; CitationZelenyuk and Imre 2005). These instruments typically use an aerodynamic lens inlet to efficiently transport particles from the atmospheric environment into the vacuum system, and two stages of optical detection to detect the particles and determine their sizes, by measuring their aerodynamic velocities.
Since the intensity of the light scattered by an individual particle, as it crosses the continuous visible laser beam, decreases extremely rapidly with particle size, a major limitation of these instruments has been their inability to detect and characterize small particles. A few years ago CitationSu et al. (2004) and CitationZelenyuk and Imre (2005) advanced the field and demonstrated the ability to detect 100 nm particles with probabilities of 0.5% and 1%, respectively. Most recently, we have improved our small particle detection sensitivity with SPLAT II and demonstrated detection probabilities of 0.02%, 1.5%, 40%, and 100% for particles that are 50 nm, 70 nm, 100 nm, and 125 nm in diameter, respectively (CitationZelenyuk et al. 2008).
Once a particle is detected in the two optical detection stages, its measured velocity is used to generate a trigger pulse for the ionization laser, with the trigger timed to coincide with the particle's arrival in the center of the ionization region of the mass spectrometer. The success of this scheme is measured by the hit-rate, which is defined as the ratio of the number of acquired individual particle mass spectra to the number of detected and sized particles during the same time period.
In SPMSs like SPLAT II, the 2nd optical stage is separated from the ionization region by a distance that provides room to place a large elliptical reflector, making it possible to improve detection of small particles. In these cases, special electronic circuits have to be used to process light scattering signals and generate properly timed triggers for the ionization lasers (CitationMysak et al. 2006; CitationPrather et al. 1994; CitationZelenyuk and Imre 2005; CitationZelenyuk et al. 2008).
To understand how challenging it is to construct a precise trigger generation scheme that does not result in size bias, it is worth noting that in the size range of interest, the light scattering cross-section decreases at a rate that is proportional to the particle diameter to the sixth power. Hence, the difference between the light scattering signals that are generated by particles that are 50 and 350 nm in diameter is more than five orders of magnitude.
Our experience with the first generation SPLAT (CitationZelenyuk and Imre 2005) showed that during instrument alignment the operator had to choose the laser trigger delay parameters to optimize the hit-rate for particles in the size range of interest, which in turn meant a lower hit-rate for other sizes. Similarly, CitationSu et al. (2004) note that in their experiments the position of the ionization laser was chosen to optimize the hit-rate for particles smaller than 200 nm. As a result the hit-rate of particles with diameters that are above ∼ 250 nm decreased rapidly with particle size. In other words, there was a clear need to choose the size range, in which precise timing is achieved, while instrument efficiency for other sizes is being sacrificed.
In this article we present an analysis that illustrates the root causes of the size bias and an implemented solution that virtually eliminates it.
EXPERIMENTAL
SPLAT II is a 2nd generation single particle mass spectrometer described in detail elsewhere (CitationZelenyuk et al. 2008). Similar to its predecessor, SPLAT (CitationZelenyuk and Imre 2005), SPLAT II uses an aerodynamic lens inlet to transport particles from the ambient atmosphere into the vacuum with extremely high efficiencies. Once in the high vacuum chamber, the particles enter the first optical detection stage, where they are detected by light scattering with a 300 mW, frequency doubled diode-pumped continuous wave (cw) Nd:YAG laser operated at 532 nm (CrystaLaser, Model GCL-300-L) and focused to a ∼ 330 μ m spot. The scattered light is collected with a large ellipsoidal reflector (Opti-Forms, Model E102-1, F# 0.91) and imaged onto a photomultiplier counting head (PMT) (Hamamatsu, Model H6180-01). The PMT signals are continuously analyzed by counting the number of photons that are detected over a time window, which is set by the operator in the present work to 2 μ sec. The number of detected photons per 2 μ sec is compared to an operator chosen threshold. When the number of photons exceeds the set threshold, the particle presence is recorded and a clock is started. The same particle then proceeds to the 2nd optical detection stage located 10.5 cm downstream from the 1st stage, where the process is repeated. If the threshold condition is met in the 2nd stage as well, the particle time of flight (PTOF) between the two detection stages is calculated and recorded. The PTOF is used to calculate particle velocity, from which its vacuum aerodynamic diameter is derived. The very same particle attributes are used to generate the trigger pulse to fire the excimer laser (GAM Lasers, Model EX5/300) synchronously with the particle arrival at the ion source of the angular reflectron time-of-flight mass spectrometer (TOF-MS, R. M. Jordan, Inc., Model D-850) located 10.5 cm downstream from the 2nd optical detection stage. If the trigger pulse is timed precisely to fire the laser when the particle arrives in the laser focal spot, the particle is hit and its mass spectrum is recorded. Under most conditions, in SPLAT II ions are generated in two steps: an infrared CO2 laser is used to evaporate the particle, and a time-delayed excimer laser pulse is used to ionize the evaporating plume and ablate the non-volatile aerosol fraction (CitationZelenyuk and Imre 2005; CitationZelenyuk et al. 2008). For simplicity, in the present article we will ignore the infrared laser, but will note that the timing scheme applies whether two lasers or one are used to generate the ions.
RESULTS AND DISCUSSION
shows a detailed schematic of the detection and timing processes utilized in SPLAT II. The upper trace indicates the two green cw Nd:YAG laser beams that are orthogonal to the particle beam and to each other. The green laser beams are focused at the focal point of the ellipsoidal reflectors in each of the optical detection stages. The excimer laser beam, also orthogonal to the particle beam, is focused at the ion source of the TOF-MS. The laser beams in are depicted in Gaussian form with widths that are intended to portray their beam diameters relative to the time it takes particles to pass through them. Superimposed on the same trace is a schematic depiction of the bursts of detected signal photons (sph) that are generated when the particles scatter the green laser light. Also shown is a background photon (bph), as a reminder that stray light and dark noise are setting the detection limit. The lower trace indicates the 2 μ sec time windows, at the end of which the threshold in both optical detection stages was met. The blue triangles marked t1 and t2 denote the particle detection points in each of the two optical stages. The time elapsed between t1 and t2 is PTOF—the particle time of flight, from which the particle vacuum aerodynamic diameter is calculated, and C1∗ PTOF is the time delay between t2 and the pulse that triggers the ion formation process. In SPLAT II, the distances between the two optical detection stages and the distance from the 2nd stage to the ionization region of the TOF-MS are nearly the same with small variations that depend on instrument alignment. Thus, the time it takes the particle to travel from the 2nd optical detection stage to the ionization point is proportional to PTOF with a proportionality coefficient that is close, but not exactly equal, to 1.
FIG. 1 A schematic representation of particle detection and timing scheme used in SPLAT II.
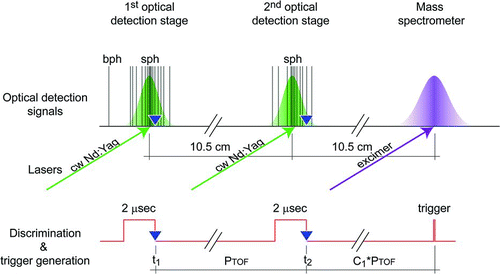
Note that the particle detection points, t1 and t2, are determined at the moment that the threshold conditions are met at the optical stages. Because large particles scatter significantly more light than small particles, they are expected to meet the threshold condition earlier. This circumstance creates a simple and reproducible relationship between the particle's size and its position in the green laser beam at the detection point, with large particles being detected slightly upstream compared to smaller particles. While these differences have virtually no effect on the precision with which particles are being sized, they are of critical importance when it comes to timing the ion generation trigger.
To get an estimate for the magnitude of this size dependent effect on the timing of the ionization laser we note that the green laser beams are focused down to ∼ 330 μ m, a value that for particles with aerodynamic diameters of 50 and 500 nm translates to particle residence times, in the green beam, of 1.7 and 3.5 μ sec, respectively. On this basis alone we would expect the timing differences between small and large particles to be on the order of a few microseconds, which need to be compared to the time the particle spends in the ablation laser focal spot. The effective size of the ablation laser beam, which in SPLAT II is focused down to 550 μ m, depends on particle composition through the wavelength dependent absorption spectrum. In general, the non-linear, multi-photon process that is required to achieve particle ablation and ionization often results in a significantly smaller effective beam width. Taken together, these numbers imply that if the instrument timing is optimized for the very small particles, the largest particles would not be efficiently hit by the excimer laser, since they will not reach the focal spot of the ionization laser, where the power density is sufficient to generate ions.
shows the signals detected by the PMT in one of the optical detection stages for 5 polystyrene latex (PSL) particle sizes, ranging from 50 nm to 499 nm in diameter. We have followed in format similar to that used in , in that for each particle size the signal is superimposed on a green, Gaussian shaped laser beam profiles. Note, however, that the widths of the green Gaussians increases with particle size to represent the fact that the abscissa in these plots is time, and that the larger particles move slower and spend longer times in the green laser beams. The black vertical lines (shaped TTL pulses that were generated by the PMT counting head electronic circuit) are the detected and processed signal and background photons. For each particle, a blue triangle marks the point at which the threshold condition was met.
FIG. 2 Traces of detected photons that are scattered by particles of different sizes. The green Gaussians indicate the green laser beam profiles and the blue triangles mark the points, at which threshold was reached and the particles were detected.
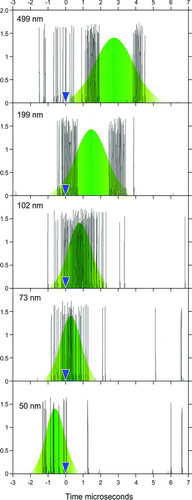
The lowest trace shows the observed PMT signal that was generated by a 50 nm particle. It shows that for this particle-size the vast majority of the signal photons are produced when the particle is at the center of the laser beam, where the laser intensity is the highest. A few background photons are also observed. The signal traces for the 73 nm and 102 nm particles exhibit the expected increase in scattered light signal. Particles with diameters larger than 100 nm show a dense burst of photons that is followed by time intervals, in which the PMT signals disappears to reappear at a slightly later time. These “dead” time intervals are the result of PMT and/or amplifier saturation due to the very high photon counts produced by the larger particles.
An examination of the 5 traces in shows that the particle detection point (blue triangles), as measured with respect to the particle's arrival at the center of the green laser beam, is clearly particle size dependent. Small particles are detected at the point, when the particle is already downstream from the center of the green laser beam and the point of detection moves gradually upstream as particle size increases. By the time we reach the largest particle shown in the figure, we find that it was detected as it barely entered the green laser beam. A simple inspection of reveals that the difference between the largest and smallest particles shown here is ∼ 3.5 μ sec, which is of significance when compared with the time the particle spends in the focal spot of the excimer laser beam.
is a plot of the measured hit-rate of particles composed of the organic dioctyl phthalate (DOP) as a function of C1—the time delay coefficient between particle detection and laser trigger generation. For clarity the figure shows the data only for 5 out of 11 particle sizes used in this study. As can be seen from the figure, for each particle size the maximum hit-rate is achieved at slightly different laser trigger delay coefficient and as expected the optimal C1 increases with particle size.
FIG. 3 Particle hit-rate as a function of the laser trigger delay coefficient C1.
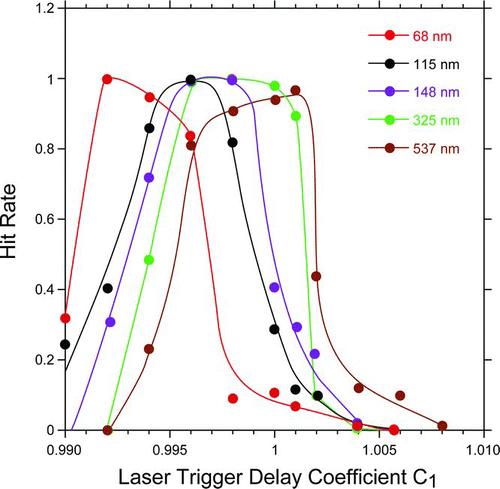
To achieve the best instrument performance it would clearly be advantageous to make the timing of the laser trigger pulse a function of particle size. The data presented in also illustrate the fact that it is possible to experimentally determine the relationship between the measured PTOF and the optimal laser trigger delay coefficient C1.
It is important to keep in mind that the particle detection probabilities strongly depend on the particle physical diameter and that what is measured by SPLAT II is PTOF, which is directly related to the particle vacuum aerodynamic diameter. The difference between particle vacuum aerodynamic diameter and its physical diameter, for the most part, depends on the particle density (CitationDeCarlo et al. 2004; CitationMurphy et al. 2004; CitationZelenyuk et al. 2005; CitationZelenyuk et al. 2006). We are ignoring the dependence of light scattering signal on the particle index of refraction, because the differences in light scattering signal due to particle size are significantly larger than effects due to changes in index of refraction. Similarly, we are not considering here the small effect of particle shape on its vacuum aerodynamic diameter.
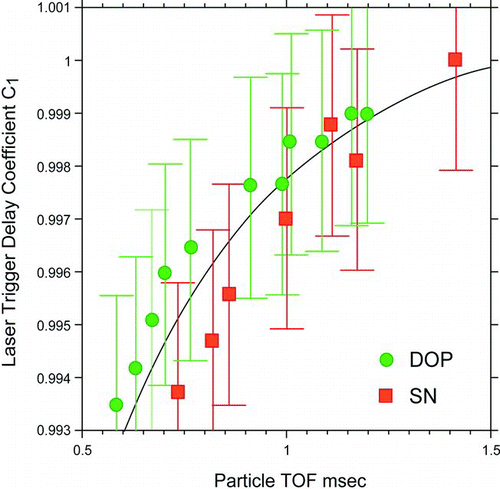
Since we are attempting to compensate for differences in light scattering that are dominated by particle physical diameter, but intend to use instead its PTOF, we have to test the practicality of the idea. The broad line-shapes in suggest that this approach has a good chance of succeeding, as long as the density differences are not very large.
To test the effect of particle density on the relationship between particle size, trigger delay coefficient, C1, and the particle hit-rate, we conducted a second set of measurements on particles composed of sodium nitrate (SN), whose density is 2.12 gcm−3, more than a factor of two higher than that of DOP. These two datasets cover the range of densities, or effective densities of the vast majority of atmospheric particles and are therefore, expected to provide a reasonable estimate of the effect of density on the laser trigger timing.
is a plot the optimal trigger delay coefficient—C1—as a function of PTOF for DOP and SN particles exhibiting the expected effect of particle size and density. The data show that for larger particles the optimal trigger delay coefficient decreases slowly with decreasing particle size. But for smaller particles the changes are more rapid. The vertical bars in the figure are intended to convey the fact that the line-shapes of the plots of hit-rates vs. C1, like those shown in , are rather broad. The black line in illustrates that it is possible to use a single relationship between PTOF and C1 to efficiently hit particles of both densities.
FIG. 4 A plot of the optimal laser trigger delay coefficient C1 as a function of PTOF for particles composed of DOP and sodium nitrate.
There are a number of approaches that can be used to put into practice a size dependent trigger delay coefficient. In SPLAT II we have implemented a procedure in which the operator has the option to specify 5 separate trigger delay coefficients and their associated PTOF ranges. The operator can experimentally determine these values, or, in most cases, one coefficient is determined during instrument alignment and the rest are determined on the basis of an established relationship, like the one shown in . This approach offers the flexibility to input the settings and achieve optimal instrument performance for a wide range of particle sizes and densities. The instrument control board that is used, in SPLAT II, to input the settings, open gates, evaluate PMT signals, generate size dependent laser triggers, and control data acquisition is described in CitationZelenyuk et al. (2008).
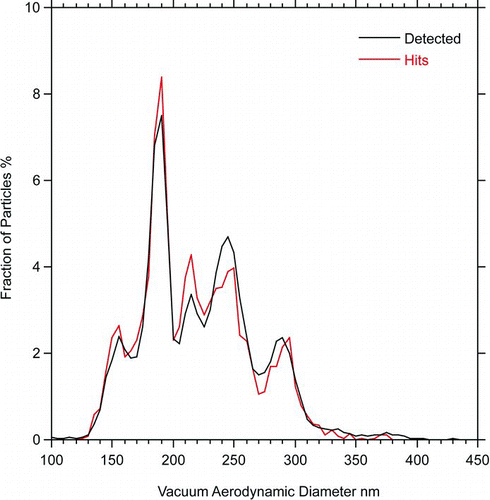
Size dependent triggering is currently integral to SPLAT II operation. shows an example from a study of secondary organic aerosol (SOA) formation during α -pinene oxidation in the presence of pre-existing sodium nitrate particles. The densities of the SOA coated sodium nitrate particles in vary from 1.25 gcm−3 to 2.12 gcm−3. The black curve represents the vacuum aerodynamic size distribution of all detected and sized particles and the red one shows the size distribution of the particles that produced individual particle mass spectra, clearly illustrating a size independent hit-rate.
FIG. 5 A plot of the vacuum aerodynamic size distributions of the detected (black) and hit (red) sodium nitrate particles that are coated with SOA, showing the achieved size independent hit-rate.
CONCLUSIONS
We presented a study in which we have experimentally identified the root-cause of the size dependent hit-rates observed in single particle mass spectrometry. We demonstrated that the particle's position with respect to the center of the green laser beams at the detection instant depends on the particle size, with larger particles being detected further upstream than smaller ones. The data show that these differences result in a need to tailor the timing of the ionization laser trigger in a manner that can compensate for this effect. We showed that it is possible to use the measured particle time of flight to generate, on the fly, a size dependent trigger delay coefficient that virtually eliminates the size dependent hit-rate.
We thank Dan Sisk for his help and support in developing the instrument control board. This work was supported by the U.S. Department of Energy Office of Basic Energy Sciences, Chemical Sciences Division, and Energy Efficiency and Renewable Energy. This research was performed in the Environmental Molecular Sciences Laboratory, a national scientific user facility sponsored by the Department of Energy's Office of Biological and Environmental Research at Pacific Northwest National Laboratory (PNNL). PNNL is operated by the US Department of Energy by Battelle Memorial Institute under contract No. DE-AC06-76RL0 1830.
Related Research Data
REFERENCES
- DeCarlo , P. F. , Slowik , J. G. , Worsnop , D. R. , Davidovits , P. and Jimenez , J. L. 2004 . Particle Morphology and Density Characterization by Combined Mobility and Aerodynamic Diameter Measurements. Part 1: Theory . Aerosol Sci. Technol. , 38 : 1185 – 1205 .
- Hinz , K. P. and Spengler , B. 2007 . Instrumentation, Data Evaluation and Quantification in On-Line Aerosol Mass Spectrometry . J. Mass Spectrom. , 42 : 843 – 860 .
- Johnston , M. V. 2000 . Sampling and Analysis of Individual Particles by Aerosol Mass Spectrometry . J. Mass Spectrom. , 35 : 585 – 595 .
- Kane , D. B. , Oktem , B. and Johnston , M. V. 2001 . Nanoparticle Detection by Aerosol Mass Spectrometry . Aerosol Sci. Technol. , 34 : 520 – 527 .
- Mckeown , P. J. , Johnston , M. V. and Murphy , D. M. 1991 . Online Single-Particle Analysis by Laser Desorption Mass-Spectrometry . Anal. Chem. , 63 : 2069 – 2073 .
- McMurry , P. H. 2000 . A Review of Atmospheric Aerosol Measurements . Atmos. Environ. , 34 : 1959 – 1999 .
- Murphy , D. M. 2007 . The Design of Single Particle Laser Mass Spectrometers . Mass Spectrom. Rev. , 26 : 150 – 165 .
- Murphy , D. M. , Cziczo , D. J. , Hudson , P. K. , Schein , M. E. and Thomson , D. S. 2004 . Particle Density Inferred from Simultaneous Optical and Aerodynamic Diameters Sorted by Composition . J. Aerosol Sci. , 35 : 135 – 139 .
- Mysak , E. R. , Dessiaterik , Y. N. , McKinney , C. J. , Miller , R. E. and Baer , T. 2006 . Design of a Timing Circuit for Random Laser Triggering on Aerosol Particles . Review of Scientific Instruments , 77 Artn 013301.
- Nash , D. G. , Baer , T. and Johnston , M. V. 2006 . Aerosol Mass Spectrometry: An Introductory Review . International J. Mass Spectrom. , 258 : 2 – 12 .
- Nash , D. G. , Liu , X. F. , Mysak , E. R. and Baer , T. 2005 . Aerosol Particle Mass Spectrometry with Low Photon Energy Laser Ionization . International J. Mass Spectrom. , 241 : 89 – 97 .
- Noble , C. A. and Prather , K. A. 2000 . Real-Time Single Particle Mass Spectrometry: A Historical Review of a Quarter Century of the Chemical Analysis of Aerosols . Mass Spectrom. Rev. , 19 : 248 – 274 .
- Park , K. , Lee , D. , Rai , A. , Mukherjee , D. and Zachariah , M. R. 2005 . Size-Resolved Kinetic Measurements of Aluminum Nanoparticle Oxidation with Single Particle Mass Spectrometry . J. Phys. Chem. B , 109 : 7290 – 7299 .
- Phares , D. J. , Rhoads , K. P. and Wexler , A. S. 2002 . Performance of a Single Ultrafine Particle Mass Spectrometer . Aerosol Sci. Technol. , 36 : 583 – 592 .
- Prather , K. A. , Nordmeyer , T. and Salt , K. 1994 . Real-Time Characterization of Individual Aerosol-Particles Using Time-of-Flight Mass-Spectrometry . Anal. Chem. , 66 : 1403 – 1407 .
- Su , Y. X. , Sipin , M. F. , Furutani , H. and Prather , K. A. 2004 . Development and Characterization of an Aerosol Time-of-Flight Mass Spectrometer with Increased Detection Efficiency . Anal. Chem. , 76 : 712 – 719 .
- Suess , D. T. and Prather , K. A. 1999 . Mass Spectrometry of Aerosols . Chem. Rev. , 99 : 3007 – 3036 .
- Sullivan , R. C. and Prather , K. A. 2005 . Recent Advances in Our Understanding of Atmospheric Chemistry and Climate Made Possible by On-Line Aerosol Analysis Instrumentation . Anal. Chem. , 77 : 3861 – 3885 .
- Thomson , D. S. , Schein , M. E. and Murphy , D. M. 2000 . Particle Analysis by Laser Mass Spectrometry WB-57F Instrument Overview . Aerosol Sci. Technol. , 33 : 153 – 169 .
- Zelenyuk , A. , Cai , Y. , Chieffo , L. and Imre , D. 2005 . High Precision Density Measurements of Single Particles: The Density of Metastable Phases . Aerosol Sci. Technol. , 39 : 972 – 986 .
- Zelenyuk , A. , Cai , Y. and Imre , D. 2006 . From Agglomerates of Spheres to Irregularly Shaped Particles: Determination of Dynamic Shape Factors from Measurements of Mobility and Vacuum Aerodynamic Diameters . Aerosol Sci. Technol. , 40 : 197 – 217 .
- Zelenyuk , A. and Imre , D. 2005 . Single Particle Laser Ablation Time-Of-Flight Mass Spectrometer: An Introduction to SPLAT . Aerosol Sci. Technol. , 39 : 554 – 568 .
- Zelenyuk , A. , Yang , J. , Imre , D. and Choi , E. 2008 . SPLAT II: An Aircraft Compatible, Ultra-Sensitive, High Precision Instrument for In-Situ Characterization of the Size and Composition of Fine and Ultrafine Particles . Aerosol Sci. Technol. , Submitted.