Abstract
Real time secondary organic aerosol (SOA) density evolution for m-xylene photo-oxidation and α-pinene ozonolysis was obtained using an Aerosol Particle Mass Analyzer (APM)/Scanning Mobility Particle Spectrometer (SMPS) setup, which has been modified to achieve higher transmission of particles and improved sampling frequency. The aerosol density of SOA generated from α-pinene ozonolysis was found to be 1.24 ± 0.03 g/cm3 while the aerosol generated from m-xylene photo-oxidation was determined to be 1.35 ± 0.03 g/cm3. These results confirm the measurement approach from a combined SMPS and Aerodyne Aerosol Mass Spectrometer (AMS) system and are found to be within good agreement with the effective density measurements.
INTRODUCTION
In environmental chamber experiments, aerosol density is required to convert size distribution data into mass concentrations. Early environmental chambers, in the absence of density measurements, estimated mass loadings assuming an aerosol density equal to 1 g/cm3. Many SOA studies have characterized SOA (CitationJaoui et al. 2004; CitationSurratt et al. 2006; CitationYu et al. 1999). However, the data concerning the density associated with these aerosol are limited and vary widely. Recent studies have estimated secondary organic aerosol (SOA) densities ranging from 0.9 g/cm3 to 1.6 g/cm3 for a variety of SOA forming systems (CitationBahreini et al. 2005; CitationJaoui et al. 2004; CitationKalberer et al. 2000; CitationKostenidou et al. 2007; CitationSurratt et al. 2006; CitationYu et al. 1999; CitationZelenyuk et al. 2008). Of particular interest is the wide variability in reported data from similar experimental conditions. For example, CitationBahreini et al. (2005) have reported the density from a β-pinene ozonlysis in unseeded experiments of 1.20 g/cm3. However, CitationKostenidou et al. (2007) reported the average aerosol density from this same system under similar experimental conditions as 1.41–1.50 g/cm3 (CitationBahreini et al. 2005; CitationKostenidou et al. 2007).
The first aerosol density measurements were obtained using pycnometers, however the data collection was slow and of low quality (CitationHanel et al. 1977). CitationKelly and McMurry (1992) used a combination of a Differential Mobility Analyzer (DMA) and impactor allowing for size segregated densities to be determined with fairly good accuracy (CitationKelly et al. 1992). More recently, density is reported using particle time of flight (PTOF)–SMPS and APM-SMPS comparisons (CitationJimenez et al. 2003; CitationKostenidou et al. 2007; CitationMcMurry et al. 2002; CitationSong et al. 2007). Furthermore, recent work by Shilling et al has shown aerosol vacuum effective densities from α-pinene ozonolysis are a function of the mass loading (CitationShilling et al. 2008). The relationship between mass loading and aerosol density is thought to arise from the relative contribution of highly oxygenated species to the total aerosol mass. Shilling et al. reported densities ranging from 1.73 g/cm3 at a mass loading of 0.46 μg/m3 to 1.23 g/cm3 at mass loadings of 15.9 μg/m3. This work evaluates high time resolution density evolution for SOA as it evolves for two classic SOA experiments. We also evaluate density estimates using AMS-SMPS to the more direct APM-SMPS measurements.
Vacuum Effective Density
Use of PTOF instruments for measurement of aerosol size has been in existence for some time (CitationSinha 1984). Aerosol mass spectrometers such as the Aerosol Time of Flight Mass Spectrometer (ATOFMS, TSI) and the AMS (Aerodyne) are two common instruments with PTOF modes that report vacuum aerodynamic diameter. Used in combination with a SMPS, these time of flight sizing instruments allow for determination of the vacuum effective density based upon the electrical mobility diameter (SMPS, operating in the transition regime) and the vacuum aerodynamic diameter (operating in free molecular regime) using the following equation (CitationDeCarlo et al. 2004):
Chamber aerosol is commonly assumed to be spherical, leading Equation (Equation1) to simplify to (CitationDeCarlo et al. 2004):
DMA-APM Density Calculation Theory
CitationEhara and Shin (1996) developed an aerosol particle mass analyzer (APM) which enables selection of aerosol based on mass by balancing the centrifugal and electrostatic forces on a particle passing through a small annular gap between two cylinders (CitationEhara et al. 1996). A differential voltage applied between the two cylinders with both cylinders rotating at a set angular momentum, classifies particles according to mass described by the following equation (CitationEhara et al. 1996):
The APM, in series with a DMA, allows for direct determination of mobility effective density.
Traditionally, the DMA has been placed ahead of the APM to first select the aerosol based on electrical mobility followed by the APM mass to charge classification ().
FIG. 1 Typical DMA-APM setup indicating units and functions of each unit.
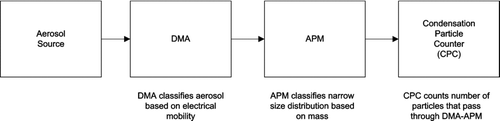
The DMA-APM configuration was successfully utilized by CitationMcMurry et al. (2002) who sampled ambient particles from Atlanta and laboratory-generated particles. However, when diameters are changing rapidly, as in aerosol chamber experiments, the DMA-APM setup suffers from the slow APM response due to long settling times when ω or applied voltage is changed. For example, an α-pinene/ozone (100 ppb α-pinene/350 ppb ozone) experiment will have particle diameter growth rate of change of approximately 2 nm/min during the first 2–3 h of an experiment. The traditional DMA-APM transmission curve incorporates discrete data points associated with step changes in the applied voltage within the APM, after which, one must wait for the CPC to produce a reading. Therefore, in order to obtain an APM transmission curve, a time of approximately 35 min is required using default parameters. An additional problem commonly encountered in environmental chamber experiments using the traditional DMA-APM is the low signal to noise ratio due to the narrow transfer function of the DMA.
Modified APM-SMPS System
We have reversed the order of the traditional DMA-APM system to reduce sampling time, reduce the need to vary ω or V, and to take advantage of the rapid classifying properties of the SMPS ().
FIG. 2 Modified APM-SMPS setup indicting placement of units and functions of each unit along with inputs needed. Solid lines indicate flow of aerosol, dotted lines represent flow of data. Note ρp is only equal to the true particle density if the aerosol is spherical, otherwise it is the mobility effective density.
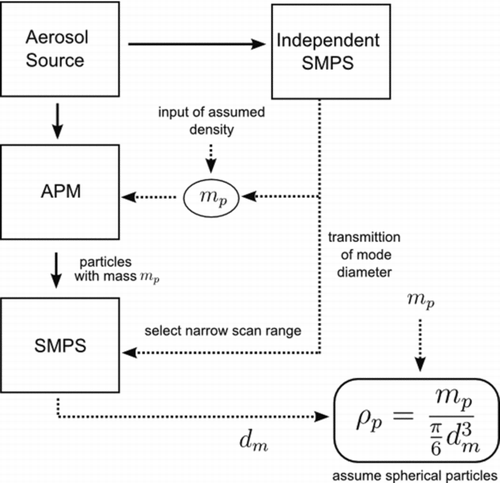
An additional advantage of this setup is that it makes use of the broader transfer function of the APM to increase the system signal to noise ratio. The SMPS used is built in house (scan time = 60 s, voltage range negative 40 to negative 7000, TSI 3081L DMA, TSI 3077 Kr85 neutralizer, and TSI 3771 particle counter), allowing for sizing of particles from 28–730 nm. The APM (Kanomax model 3600) is capable of angular rotation speeds up to 10,000 rpm and electrical potential up to 5000 V, enabling selection of particles as light as 0.01 fg (particles of ∼26 nm assuming unit density and perfect spheres). In addition to reversing the SMPS and APM order, custom Labview® programming was developed to enable continuous operation of both the APM and SMPS.
Signal to noise is improved by utilizing a independent SMPS, which identifies the mode particle diameter of the aerosol sampled and relays this information to the APM-SMPS. The mass of the particles to be transmitted through the APM is estimated using the information of the mode particle diameter from the independent SMPS and an initial assumed density (typically 1.2–1.4 g/cm3). This estimated mass is then used to set ω and V of the APM, which are re-evaluated every 4 minutes during the course of an experiment. The mobility aerosol density is then determined from the mass selected by the APM (Equation [Equation4]) and the peak diameter from a second SMPS located directly downstream of the APM.
Data Reduction
Mobility size distributions are recorded every 78 s along with the corresponding mass of particles which the APM transmitted. Custom Matlab® programming enables for automated fitting of a lognormal curve to the mobility distribution from the SMPS located downstream of the APM and determination of the mode diameter. The mode diameter as determined from the lognormal curve is then combined with the recorded corresponding APM mass to calculate a mobility effective density using Equation (Equation5).
Evaluation
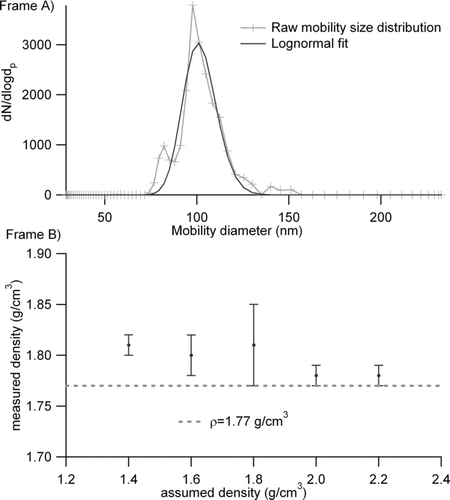
The APM-SMPS system performance was first evaluated with 100 nm (as selected by a DMA) dry ammonium sulfate particles (Sigma-Aldrich, purity >99%, ρ = 1.77 g/cm3,) which were transmitted to the APM-SMPS system in order to ensure the method of estimating initial densities does not bias the final density calculations. Initial densities were varied from 1.4–2.2 g/cm3 in 0.2 g/cm3 increments. shows a sample of the raw output from this testing with an assumed density of 1.80 g/cm3, results from this testing revealed no inherent bias in the APM-SMPS, with measured densities ranging from 1.78 to 1.81 g/cm3 ().
FIG. 3 (a) Mobility size distribution of 100 nm ammonium sulfate particles (assumed density 1.80 g/cm3) after passing through an APM set to transmit particles of 0.942 fg. (b) APM-SMPS validation results indicating good agreement between measured density and true density of dry ammonium sulfate and insensitivity of system to initial assumed density.
Reasons for the slight over estimation of ammonium sulfate is unknown, however it should be noted that the APM does not have a shape effect. Never the less, the results from the ammonium sulfate are in reasonable agreement with the published density. Accurate APM-SMPS performance was also confirmed with polystyrene latex spheres (Duke Scientific, ρ = 1.05 g/cm3) and aerosolized dioctyl phthalate (Sigma-Aldrich, purity >99%, ρ = 0.985 g/cm3) in order to evaluate its performance with solid and liquid aerosol ().
TABLE 1 Comparison of densities of various laboratory-generated particles as measured by the modified APM-SMPS and the SMPS-AMS
EXPERIMENTAL
Chamber Experiments
The APM-SMPS system sampled SOA generated from a series of environmental chamber experiments conducted at the UCR/CE-CERT environmental chamber facility. The UC-Riverside/CE-CERT Environmental Chamber has been described in detail elsewhere (CitationCarter et al. 2005). Briefly the facility consists of two 90 m3 Teflon reactors located in a temperature controlled room, which is continuously flushed with purified air. The reactors are attached to a rigid collapsible frame to minimize diffusion of contaminants into the reactors by maintaining a positive differential pressure with respect to the chambers surroundings. The chamber has two banks of black lights (80 lights in total). Each light source emits a sufficiently high 360 nm wavelength photon flux to drive NO2 photolysis. Connected to the chamber are two in house built SMPS's identical to the one detailed above, along with an AMS and APM-SMPS. Compounds of interest are introduced to the chamber by passing a stream of pure N2 over a known volume liquid contained in a glass injection manifold or by flushing pure N2 through a calibrated glass bulb filled with the gaseous compound to the desired partial pressure. In cases where a ozonolysis experiment was performed, ozone was introduced into the dark chamber by passing 20 psig of pure air through two UV ozone generators, CO was added in sufficient quantities to consume >99% of the hydroxyl radicals produced. All experiments were conducted in the absence of seed. In all experiments, the relative humidity (RH) was below 0.1%.
RESULTS
α-Pinene-Ozone SOA Density
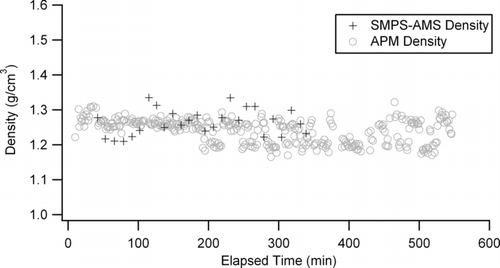
An α-pinene ozonoylsis experiment was conducted at 27°C (400 ppb α-pinene/ 800 ppb O3/excess CO as the hydroxyl scavenger). Mass loadings from this experiment were in excess of 2000 μg/m3 as measured by an SMPS. This mass loading is especially high; however during this experiment, the SMPS was programmed to remain at a single voltage (essentially a DMA) so as to transmit only a single diameter particle to the AMS located downstream. Due to the narrow transmission curve of the DMA, large mass loadings were needed to obtain a substantial signal from the AMS. The mobility aerosol density remained a nearly constant 1.24 ± 0.03 g/cm3 throughout the course of the experiment (∼7 h) ().
FIG. 4 Aerosol density for an α-pinene/O3 experiment as measured by the APM-SMPS and an SMPS-AMS setup.
During the course of the same experiment, the vacuum effective density was also determined from a DMA-AMS setup as described above and found to be 1.26 ± 0.03 g/cm3. This effective density value closely matches that determined previously from CitationBahreini et al. (2005), CitationZelenyuk et al. (2008), and CitationShilling et al. (2008) at mass loadings >15 μg/m3. It is worth noting that in the experiments of Bahreini et al., initial hydrocarbon concentrations were approximately an order or magnitude lower than that reported here and used seed particles, while the experiments of Shilling et al. had initial hydrocarbon concentrations even lower. In addition to these differences, the experiments of Shilling et al. contained dry ammonium sulfate seed particles and a relative humidity of 40%. The work of Zelenyuk contained no seed and was conducted at an RH below 1%. Despite these dramatic differences in experimental conditions, the aerosol density reported here matches extremely well with that of Shilling et al. (1.23 g/cm3), Zelenyuk et al. (1.198 g/cm3), and Bahreini et al. (1.19 g/cm3). As mentioned previously, Shilling et al. has shown aerosol density to be a function of the mass loadings, while work of Zelenyuk and Bahreini do not indicate final mass loadings, it is assumed that they are much lower then those reported here. Therefore, this may explain the small differences between our results and those of Zelenyuk and Bahreini.
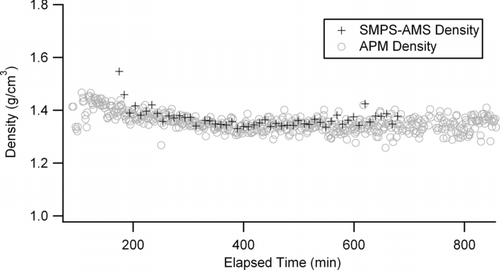
m-Xylene NO X SOA Density
Additional chamber experiments were carried out to examine the aerosol density of SOA formed from the irradiation of m-xylene and NOx (70 ppb m-xylene, and 11 ppb NO), resulting in a final mass loading of 25 μg/m3. The experiment was conducted in the same manner to that of the α-pinene/O3 however, the irradiation necessary for the reaction was provided by the 80 black lights. Additionally, the vacuum effective density during this experiment was determined using an SMPS in parallel with the AMS. This setup enabled collection of data from the AMS under the low mass loadings encountered in this experiment, which would not have been possible with the SMPS upstream of the AMS. The aerosol density measured by both the APM-SMPS and SMPS-AMS follows the α-pinene/O3 trend with little change in the density throughout the experiment except for a slight decrease during the first 4 h (). Similar to the α-pinene/O3 experiments, the APM-SMPS recorded density matched that of the SMPS-AMS, reaching a plateau at a value of 1.35 ± 0.03 g/cm3 compared to a value of 1.36 ± 0.03 g/cm3 as measured by the SMPS-AMS.
FIG. 5 Aerosol density for an m-xylene/NO x experiment as measured by the APM-SMPS and an SMPS-AMS setup.
For similar aromatic systems, CitationAlfarra et al. (2006) have reported aerosol density values of 1.35–1.40 g/cm3 from 1,3,5-trimethylbenzene photo-oxidation with NOx, while CitationMartin-Reviejo et al. (2005) reported the density of aerosol generated from benzene at 1.35 g/cm3 (CitationAlfarra et al. 2006; CitationMartin-Reviejo et al. 2005). The only work in which density was reported from m-xylene was performed by CitationSong et al. (2007) who found the density of the aerosol as 1.41 g/cm3 (CitationSong et al. 2007). It should be noted that the work of Song et al. also employed an APM for density measurements. However, differences in the conditions under which the experiments of Song et al. were performed, namely the absence of NOx in the reaction system, make drawing conclusions based on differences in these two experiments difficult.
SUMMARY AND DISCUSSION
We have demonstrated the applicability of a modified APM-SMPS system for the real-time density analysis of chamber generated SOA. This new system obtains data 30 times faster than a traditional DMA-APM setup. Very little change in aerosol density was observed for α-pinene ozonolysis experiments with densities measured by our APM-SMPS and SMPS-AMS agreeing well over the course of the entire experiment (1.24 and 1.26 g/cm3, respectively), while in m-xylene experiments a slight decrease in aerosol density was observed during the initial course of the experiment with both an SMPS-APM and SMPS-AMS (1.35 and 1.36 g/cm3, respectively) determined densities agreeing throughout the experiment. Furthermore, in environmental chamber applications, use of the SMPS-AMS is found to be more than adequate for aerosol density determination, with vacuum effective densities agreeing extremely well with those determined from an APM-SMPS setup. Deployment of the APM-SMPS for ambient measurements would present difficulties not encountered here due the externally mixed nature of ambient aerosol. In particular, the broad transfer function of the APM would lead to transmission of multiple masses to the SMPS, additionally the SMPS would observe aerosol with a varied distribution of mobility diameters. However, the results reported here are consistent with previously reported ambient particle densities of 1.0–1.5 g/cm3 (CitationPitz et al. 2003; CitationSpencer et al. 2007). Furthermore, this method utilizing both AMS and APM data can be extended to examine particle shape factors as described by Schmid et al. in which a DMA+APM+AMS are setup in series (CitationSchmid et al. 2007). This method would allow for determination of the mobility and vacuum effective density simultaneously from direct measurements of dm , mp , and dva .
Acknowledgments
The authors would like to thank Kurt Bumiller and Chuck Bufalino for help with the experimental facility and Drs. Richard Flagan and Paul Ziemann for helpful discussions. The authors would also like to thank the W.M. Keck Foundation for their generous support. This research was funded by the NSF (Grant ATM-0449778) and University of California Transportation Research Center.
Related Research Data
References
- Alfarra , M. R. , Paulsen , D. , Gysel , M. , Garforth , A. A. , Dommen , J. , Prevot , A. S. H. , Worsnop , D. R. , Baltensperger , U. and Coe , H. 2006 . A Mass Spectrometric Study of Secondary Organic Aerosols Formed from the Photooxidation of Anthropogenic and Biogenic Precursors in a Reaction Chamber . Atmos. Chem. Phys. , 6 : 5279 – 5293 .
- Allen , M. D. and Raabe , O. G. 1982 . Re-Evaluation of Millikan Oil Drop Data for the Motion of Small Particles in Air . J. Aerosol Sci. , 13 ( 6 ) : 537 – 547 .
- Bahreini , R. , Keywood , M. D. , Ng , N. L. , Varutbangkul , V. , Gao , S. , Flagan , R. C. , Seinfeld , J. H. , Worsnop , D. R. and Jimenez , J. L. 2005 . Measurements of Secondary Organic Aerosol from Oxidation of Cycloalkenes, Terpenes, and m-xylene Using an Aerodyne Aerosol Mass Spectrometer . Environ. Sci. Technol. , 39 ( 15 ) : 5674 – 5688 .
- Carter , W. P. L. , Cocker , D. R. , Fitz , D. R. , Malkina , I. L. , Bumiller , K. , Sauer , C. G. , Pisano , J. T. , Bufalino , C. and Song , C. 2005 . A New Environmental Chamber for Evaluation of Gas-Phase Chemical Mechanisms and Secondary Aerosol Formation . Atmos. Environ. , 39 ( 40 ) : 7768 – 7788 .
- DeCarlo , P. F. , Slowik , J. G. , Worsnop , D. R. , Davidovits , P. and Jimenez , J. L. 2004 . Particle Morphology and Density Characterization by Combined Mobility and Aerodynamic Diameter Measurements. Part 1: Theory . Aerosol Sci. Tech. , 38 ( 12 ) : 1185 – 1205 .
- Ehara , K. , Hagwood , C. and Coakley , K. J. 1996 . Novel Method to Classify Aerosol Particles According to Their Mass-to-Charge Ratio—Aerosol Particle Mass Analyser . J. Aerosol Sci. , 27 ( 2 ) : 217 – 234 .
- Hanel , G. and Thudium , J. 1977 . Mean Bulk Densities of Samples of Dry Atmospheric Aerosol-Particles—Summary of Measured Data . Pure Appl. Geophys. , 115 ( 4 ) : 799 – 803 .
- Jaoui , M. , Kleindienst , T. E. , Lewandowski , M. and Edney , E. O. 2004 . Identification and Quantification of Aerosol Polar Oxygenated Compounds Bearing Carboxylic or Hydroxyl Groups. 1. Method Development . Anal. Chem. , 76 ( 16 ) : 4765 – 4778 .
- Jimenez , J. L. , Bahreini , R. , Cocker , D. R. , Zhuang , H. , Varutbangkul , V. , Flagan , R. C. , Seinfeld , J. H. , O'Dowd , C. D. and Hoffmann , T. 2003 . New Particle Formation from Photooxidation of Diiodomethane (CH2I2) . J. Geophys. Res. [Atms.] , 108 ( D10 )
- Kalberer , M. , Yu , J. , Cocker , D. R. , Flagan , R. C. and Seinfeld , J. H. 2000 . Aerosol Formation in the Cyclohexene-Ozone System . Environ. Sci. Technol. , 34 ( 23 ) : 4894 – 4901 .
- Kelly , W. P. and McMurry , P. H. 1992 . Measurement of Particle Density by Inertial Classification of Differential Mobility Analyzer Generated Monodisperse Aerosols . Aerosol Sci. Tech. , 17 ( 3 ) : 199 – 212 .
- Kostenidou , E. , Pathak , R. K. and Pandis , S. N. 2007 . An Algorithm for the Calculation of Secondary Organic Aerosol Density Combining AMS and SMPS Data . Aerosol Sci. Tech. , 41 ( 11 ) : 1002 – 1010 .
- Martin-Reviejo , M. and Wirtz , K. 2005 . Is Benzene a Precursor for Secondary Organic Aerosol? . Environ. Sci. Technol. , 39 ( 4 ) : 1045 – 1054 .
- McMurry , P. H. , Wang , X. , Park , K. and Ehara , K. 2002 . The Relationship between Mass and Mobility for Atmospheric Particles: A New Technique for Measuring Particle Density . Aerosol Sci. Tech. , 36 ( 2 ) : 227 – 238 .
- Pitz , M. , Cyrys , J. , Karg , E. , Wiedensohler , A. , Wichmann , H. E. and Heinrich , J. 2003 . Variability of Apparent Particle Density of an Urban Aerosol . Environ. Sci. Technol. , 37 ( 19 ) : 4336 – 4342 .
- Schmid , O. , Karg , E. , Hagen , D. E. , Whitefield , P. D. and Ferron , G. A. 2007 . On the Effective Density of Non-Spherical Particles as Derived from Combined Measurements of Aerodynamic and Mobility Equivalent Size . J. Aerosol Sci. , 38 ( 4 ) : 431 – 443 .
- Shilling , J. E. , Chen , Q. , King , S. M. , Rosenoern , T. , Kroll , J. H. , Worsnop , D. R. , DeCarlo , P. F. , Aiken , A. C. , Sueper , D. , Jimenez , J. L. and Martin , S. T. 2008 . Loading-Dependent Elemental Composition of A-Pinene SOA Particles . Atmospheric Chemistry and Physics Discussions , 8 : 15343 – 15373 .
- Sinha , M. P. 1984 . Laser Induced Volatilization and Ionization of Microparticles . Rev. Sci. Instrum. , 55 ( 6 ) : 886 – 891 .
- Song , C. , Na , K. , Warren , B. , Malloy , Q. and Cocker , D. R. 2007 . Secondary Organic Aerosol Formation from m-xylene in the Absence of NOx . Environ. Sci. Technol. , 41 ( 21 ) : 7409 – 7416 .
- Spencer , M. T. , Shields , L. G. and Prather , K. A. 2007 . Simultaneous Measurement of the Effective Density and Chemical Composition of Ambient Aerosol Particles . Environ. Sci. Technol. , 41 ( 4 ) : 1303 – 1309 .
- Surratt , J. D. , Murphy , S. M. , Kroll , J. H. , Ng , N. L. , Hildebrandt , L. , Sorooshian , A. , Szmigielski , R. , Vermeylen , R. , Maenhaut , W. , Claeys , M. , Flagan , R. C. and Seinfeld , J. H. 2006 . Chemical Composition of Secondary Organic Aerosol Formed from the Photooxidation of Isoprene . J. Phys. Chem. A , 110 ( 31 ) : 9665 – 9690 .
- Yu , J. Z. , Cocker , D. R. , Griffin , R. J. , Flagan , R. C. and Seinfeld , J. H. 1999 . Gas-Phase Ozone Oxidation of Monoterpenes: Gaseous and Particulate Products . J. Atmos. Chem. , 34 ( 2 ) : 207 – 258 .
- Zelenyuk , A. , Yang , J. , Song , C. , Zaveri , R. A. and Imre , D. 2008 . A New Real-Time Method for Determining Particles’ Sphericity and Density: Application to Secondary Organic Aerosol Formed by Ozonolysis of Alpha-Pinene . Environ. Sci. Technol. , 42 ( 21 ) : 8033 – 8038 .