Abstract
A new instrument, the University of Toronto Continuous Flow Diffusion Chamber (UT-CFDC), has been designed to study ice nucleation at low temperatures. Based on previous continuous flow instruments, it is a parallel plate model that minimizes convective instabilities by operating horizontally with the warmer plate on top. A variable position sample injector can account for effects arising from gravitational settling of ice particles that form. The residence time in the chamber can vary between 2.6 to 25 s and ice particle formation is monitored with a two-channel optical particle counter. Observation of homogeneous freezing of 100 nm sulfuric acid aerosols was used to verify the accuracy of the calculated relative humidities (RHs) in the chamber to be ±4%, where we report onset RHs for 0.1% of the particles freezing in the temperature range of 218 to 243 K. We also show that the chamber accurately establishes conditions of water saturation by conducting water uptake studies onto sulfuric acid aerosol at 243 K. The two channel OPC allows for ice and water droplet formation to be distinguished under such conditions. The chamber is a simple, cheap, and small design that can be readily assembled for laboratory studies.
1. INTRODUCTION
Aerosols and clouds in the upper troposphere and lower stratosphere play an important role in the Earth's radiation budget. Cirrus ice clouds cover about 25% of the Earth and strongly affect the radiative properties of the Earth by scattering and absorption of incoming and outgoing radiation. Contributions of ice clouds to the Earth's radiation budget still remain highly uncertain (IPCC 2007), with one issue being the identification of ice crystal formation mechanisms. For example, a common observation is that the numbers of ice crystals in supercooled clouds are larger than those of ice nuclei (IN) measured under similar relative humidity (RH) and temperature (T) conditions (Hobbs and Radke 1975; Cooper and Saunders 1980), a measurement that is complicated by ice multiplication mechanisms and shattering of large ice crystals in airborne probes. There is thus a need to better quantify the number of IN in the atmosphere.
Heterogeneous ice nucleation can take place by contact, condensation or deposition freezing onto a solid aerosol particle at higher Ts and lower RHs than those required for homogeneous nucleation. In particular, deposition freezing has been observed to take place well below water saturation (Dymarska et al. 2006; CitationKanji and Abbatt 2006; Knopf and Koop 2006; Koehler et al. 2007). This suggests that other mechanisms beyond homogeneous nucleation should be included when accounting for the ice crystals observed at conditions that do not fulfill the homogenous freezing criteria.
Instruments have been deployed in the past few years to bridge the gap between field observations of ice crystal concentrations and laboratory measurements of ice nuclei (Al-Naimi and Saunders 1985; Mizuno and Fukuta 1995; Chen et al. 1998; DeMott et al. 2003a, 2003b; Prenni et al. 2007). These field instruments use continuous flow diffusion chambers (CFDC) based on earlier designs (Hussain and Saunders 1984; Al-Naimi and Saunders 1985; Tomlinson and Fukuta 1985; Rogers 1988). The CFDCs have also been used in the laboratory as ice nucleation counters to investigate homogeneous freezing of sulfuric acid (Chen et al. 2000), and heterogeneous freezing onto mineral dust (Archuleta et al. 2005), silver iodide (Stetzer et al. 2008), montmorillonite and kaolinite (Salam et al. 2006), and soot and soot coated with sulfuric acid (DeMott et al. 1999). While groundbreaking in their capabilities, some limitations from earlier chambers include the offline manner by which ice crystals are observed (Tomlinson and Fukuta 1985) and concentric cylindrical geometry which makes their design complex for cooling the chamber and for introduction of the sample and sheath flows (Rogers 1988; Salam et al. 2006). The fixed position of sample introduction also means that the particle residence time can only be changed by altering the total flow in the chamber. Finally, the chambers have typically used special treatment of the inner chamber walls to minimize background signals. At present, there is no commercial IN counter.
Other methods of measuring ice formation in the laboratory include using static diffusion chambers (CitationDymarska et al. 2006; CitationKanji and Abbatt 2006; Knopf and Koop 2006) and differential scanning calorimetry (Zobrist et al. 2006; Marcolli et al. 2007) to measure ice formation in the immersion, condensation-freezing, and deposition mode onto various mineral aerosols and organics. While the above methods can be sensitive to a very small fraction of particles freezing there can be upper limits for the maximum attainable RH because particles are typically deposited onto a supporting substrate. In the case where microscopy is used to observe ice crystals, there are size limitations associated with detection of small particulates and ice crystals. By contrast a CFDC permits high RHs to be used, as well as smaller particles that are suspended as aerosol. The CFDC is also easy to couple to other detection devices to study physical, chemical, and size effects on ice nucleation.
In the current study at the University of Toronto a new CFDC (UT-CFDC) is built based on the working principle of early continuous flow instruments (Hussain and Saunders 1984; Al-Naimi and Saunders 1985; Tomlinson and Fukuta 1985; Rogers 1988) and by modifying the design of the Kumar et al. (2003) parallel-plate CCN chamber. In previous ice nucleation studies we have examined ice formation onto solid particulates in a static chamber and used microscopy and digital photography to detect ice formation (Abbatt et al. 2006; CitationKanji and Abbatt 2006; CitationKanji et al. 2008). The UT-CFDC was developed to further investigate deposition mode nucleation onto dust particles, including the effects of chemical processing and particulate size on nucleation.
The UT-CFDC was particularly designed for low temperature ice nucleation in the deposition mode and can also be used for homogeneous nucleation that is relevant to cirrus regimes. However, it also has the capability to work at warmer temperatures where condensation freezing at water saturation occurs. Recognizing that there are no commercial ice chambers on the market, the specific design goals were to develop a small, compact continuous flow chamber that is simple to build, easy to cool to low temperatures, has inner surfaces that are easily coated with ice, and yet is capable of measuring ice formation much like other continuous flow chambers. Unlike many chambers, it is a flat parallel plate design that is horizontally oriented to minimize convective effects. For the first time, a variable position sample injector is used that has the ability to account for both potential ice crystal losses by gravitational settling as well as to allow for ice particle nucleation and growth kinetic studies. Finally, background signals are required to be sufficiently low that this instrument could be used at future times in field studies for ground level ambient aerosol sampling.
2. GENERAL OVERVIEW OF PRINCIPLE
The principle used for detection of ice formation in the current study is similar to that described in detail by Rogers (1988), as well as by Al-Naimi and Saunders (1985). Continuous flow thermal gradient diffusion IN counters operate with an aerosol sample flow sandwiched between two particle free sheath flows set to have flow rates at least 10 times that of the sample. The overall flow in the chamber is in the laminar regime to ensure that the sample flow is maintained in the middle of the particle-free sheath flows. The upper and lower walls of the chamber are maintained at different temperatures and have their inner surfaces coated with ice. With a linear temperature gradient, the temperature and RH conditions in the center of the chamber can be determined by knowing the temperature on both the cold and warm walls. A steady state partial pressure of water develops between the cold and warm walls and is linear as a function of distance between the two walls. However, the equilibrium vapor pressure as a function of T is not linear therefore establishing a supersaturated region close to the center of the chamber.
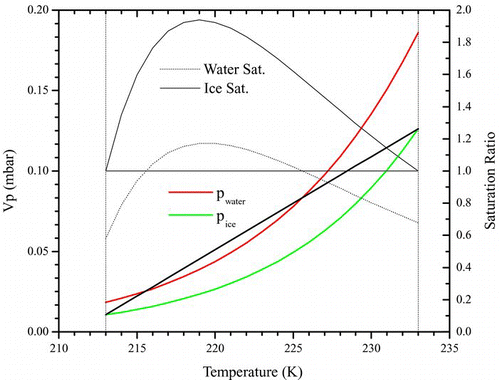
illustrates this situation for a sample temperature of 223 K with the warm wall at 233 K and cold wall at 213 K, where the vapor pressures over ice and water were calculated from Murphy and Koop (2005). In this case the temperature difference between the two walls is quite large and so there is not only a supersaturated region with respect to ice but also with respect to water; most work reported in this article occurred with somewhat smaller temperature gradients where only ice supersaturations prevailed. Knowing this temperature profile then allows the determination of RH at any point between the two plates. By passing particles through the supersaturated region, some fraction of the added aerosol particles nucleate to form ice.
FIG. 1 Supersaturation profile in a CFDC. This example illustrates a case where the cold wall is at 213 K and warm wall at 233 K (vertical dash-dotted lines), and sample temperature of 223 K in the center. Open-symbol-line: equilibrium vapor pressure of water with respect to water. Closed-symbol-line: the same but with respect to ice. Black straight line: steady state partial pressure of water across the chamber. Dash dotted curve: saturation profile in chamber with respect to water. Dotted curve: same but with respect to ice. The colored lines refer to the left axis and the black ones to the right. For most experiments the saturation ratio with respect to water did not exceed 1. (Figure provided in color online.)
3. DESIGN OF THE UT-CFDC
The apparatus used in this work consists of three components (): (1) aerosol generation, conditioning, size selection, and counting, (2) ice nucleation in the UT-CFDC under controlled and defined temperature and supersaturation, and (3) ice detection using an optical particle counter (OPC). A National Instruments Inc. data acquisition board logs to a computer the temperature from thermocouples, and the particle and ice crystal concentrations from a condensation particle counter (CPC) and the OPC, respectively.
FIG. 2 Schematic showing the setup of the entire system as an IN counter. Directions of arrows indicate direction of flow of aerosols. Refer to text for acronym definitions.
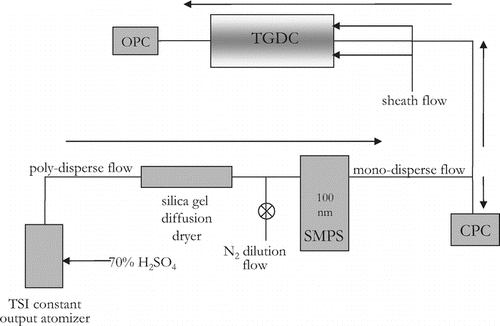
3.1. Aerosol Generation and Counting
For the validation of the IN counter, aerosols are formed by a TSI® constant output atomizer using a 70% w/w composition sulfuric acid prepared from 96% concentrated H2SO4 (Fisher Scientific, ACS grade). The sulfuric acid particles were passed through a silica-gel diffusion drier to remove excess moisture. In some cases a dilution flow of dry N2 () was added to achieve the desired concentration of particles. The poly-disperse aerosol from the atomizer was then passed through a scanning mobility particle sizer (SMPS, TSI electrostatic classifier model 3080, DMA column 3081) to size select for 100 nm particles. The flow of mono-disperse particles (typically 0.6 lpm) was then split equally and fed into the CPC (TSI model 3010) and the main chamber. The CPC measures particles in the size range 10 nm–3 μ m and requires a sample input flow of 1 lpm. Since the aerosol flow was 0.3 lpm, the remaining make-up flow came from filtered room air and the concentrations recorded by the CPC were adjusted to reflect the dilution. Typical concentrations in the sample flow entering the CFDC were 350–1000 particles cm− 3.
3.2. Ice Nucleation Chamber
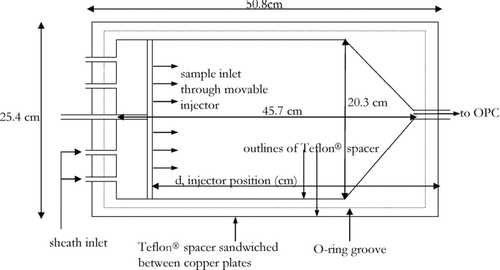
Ice formation takes place in a rectangular-shaped chamber that has outer dimensions of 50.8 × 25.4 × 3.84 cm. The chamber is made up of two horizontal flat copper plates () that sandwich a Teflon® spacer (). The inner surfaces of the copper plates are lined with quartz-fiber filter paper (Pall Corporation, Michigan) that is wetted prior to any experiment. This ensures a uniform coating of ice along the inner walls of the chamber. After initial wetting, the filter paper adhered strongly to the copper surfaces and did not degrade with time as occurs with paper-fiber filter paper. The top copper plate has five sealable ports that can be used to wet the top and bottom plate. Three of the ports are in contact with the filter paper that lines the top plate. The other two provide access to the bottom plate filter paper by creating holes in the filter paper that lines the top plate. While normally resting horizontally, the chamber can be easily tilted to a 45° angle. In this position, the chamber is wetted by introducing approximately 26–30 ml of de-ionized distilled water (Aldrich, 18.2 MΩ) through the five ports. The chamber is subsequently drained of any excess water through the exit at the downstream end while still in the slant position. The chamber is then raised back to the horizontal position and the OPC is connected to the exit of the chamber.
FIG. 3 Lengthwise cross-section of chamber. Bold arrows indicate direction of particle-free sheath air that makes up about 90% of the total flow in the chamber. The remaining 10% is made up by the sample flow indicated by thinner arrow. (Figure provided in color online.)
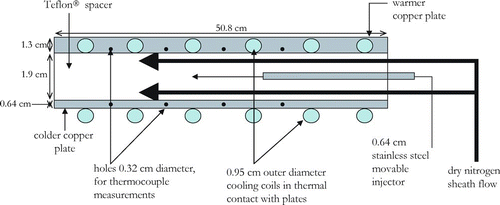
FIG. 4 Top-view of the Teflon® spacer that is sandwiched between the warm and cold copper plates. The O-ring seal between the three pieces (on either side of the Teflon® spacer) ensures the chamber is air tight. The injector has 6 ports that allow sample into the chamber. The minimum residence time for the aerosol is achieved by pushing the injector in all the way so that aerosol is introduced into the chamber where the cone shape of the chamber begins. To ensure stability, the ends of the injector slide within a notch in the Teflon® spacer.
Cooling coils (0.95 cm o.d. and 172 cm length per plate) soldered to the copper plates () have a coolant (Syltherm XLT, Dow Corning Corporation) flowing through them from two re-circulating chillers, one for the warmer wall (Julabo USA Inc., Model FP88-MW) and the other for the colder wall (Neslab Instruments Inc. Model ULT-90). Holes (0.32 cm diameter) are drilled into the sides of the copper plate () for insertion of thermocouples to take temperature measurements. The holes are centered 3.2 mm below the inner surface of the copper plates and they are 12.7 cm in length, so that the thermocouples are measuring the temperature in the centre of the chamber. Temperature measurements at four collinear points along the length of each plate are possible.
As determined by the OPC internal pump, the total flow through the chamber is 2.83 lpm. The sample flow was set to be 10% of this and the remainder of the flow, i.e., the sheath flow, was made up of dry particle-free N2. The sample is injected through a 0.64 cm diameter stainless steel T-shaped movable injector that has 6 holes (1.6 mm diameter) across the width of the chamber as shown in . The outermost holes on the injector are 6.2 cm from the walls of the Teflon® spacer so as to avoid inhomogeneous relative humidity and particle loss effects. The injector is movable so that the position at which the aerosol is introduced can be varied to change the residence time of the particles in the chamber. The sheath flow is injected at the upstream end () of the chamber through 4 ports (0.64 cm diameter) that are drilled into the Teflon® spacer. With the sheath and sample flows, the maximum residence time in the center of the chamber is 25 s (calculated with the bulk flow) and can be achieved when the injector is pulled back all the way. The sheath flow is introduced above and below the stainless steel injector and ensures the particle flow is kept in the center. The Reynolds number for the given flows and dimensions at a temperature of 223 K is 20 which is well below the critical value where the transition from laminar to turbulent begins to occur in parallel plates. For reference, if air at room temperature is entering the chamber, it takes about 0.3–2 seconds to achieve steady state temperature and water vapor partial pressure conditions (Hussain and Saunders 1984; Rogers 1988). The downstream end of the chamber is funnel shaped so as to direct the flow into the center as it exits into the OPC.
3.3. Ice Detection
Ice is detected using an optical particle counter (OPC) that is directly coupled to a 0.64 cm tube exiting the chamber through a single 0.64 to 0.95 cm o-ring compression fitting. This ensures that the flow exiting the CFDC does not warm sufficiently that the ice particles evaporate before being analyzed by the OPC. The commercial OPC (Climet, Model CI-20) is capable of measuring particles in two size bins, particles greater than 5 μ m and those between 0.5 and 5 μ m. It samples at a flow rate of 2.83 lpm and encounters 10% coincidence errors when the particle concentration exceeds 3.5 × 10² particles cm–3. Since the smallest particle size detectable by the OPC is 500 nm, the particle size for validation experiments introduced into the CFDC was chosen to be 100 nm so that when there is no ice formation, no background counts from the OPC are recorded arising from particle introduction. However, when ice forms, the particle always grows to sizes larger than 500 nm and usually to larger than 5 μ m. The applicability of each OPC channel to ice detection under specific conditions is discussed later in the article. The background count rate in the smaller size bin was typically quite low, around 0.02 particles cm–3; in the larger size bin, the background count rate was typically 0.0005 particles cm–3. The source of background counts come from frost particles that may dislodge themselves from the ice-covered walls, and also from particles that coagulate or coalesce during their transmission through the chamber.
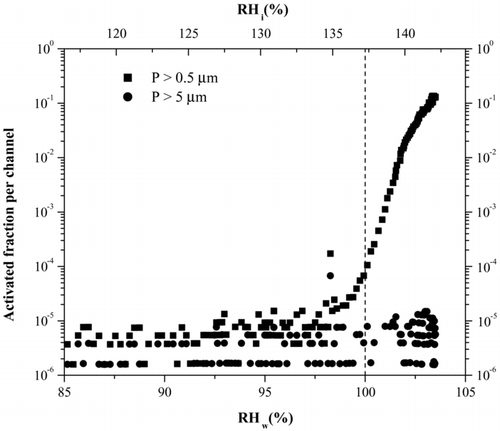
A typical experiment starts with the cold and warm walls approximately 2 K apart in temperature (Δ T), providing a very small supersaturation with respect to ice and subsaturated with respect to water. The temperature difference between the warm and cold wall is then increased by changing the temperature set points on each re-circulating chiller while keeping the average temperature constant, thus increasing the supersaturation in the chamber. The point at which ice starts forming is readily apparent as the concentrations recorded by the OPC begin to increase from the low background level. An activation plot (e.g., ) of the fraction of aerosol that forms ice as a function of RH can then be produced and the RH for various activated fractions can be determined. See the next section for a full discussion of .
FIG. 5 Activation curve for 230 K derived from a typical ice nucleation experiment. The RH of the chamber is increased and concentration of ice crystals monitored. The activated fraction is the ratio of OPC counts to particle counts, derived from the CPC. The dashed line indicates for this temperature where we expect to see homogenous freezing of 100 nm H2SO4 taken from Koop et al. (2000). Note that the large particle channel also increases indicating the presence of ice. The particles in the smaller size channel could also be water droplets after water saturation has been surpassed.
4. VALIDATION OF FREEZING CONDITIONS
To validate the UT-CFDC we sought to determine whether the relative humidity conditions discussed in section 2 are accurately achieved. For this we chose to study the homogeneous freezing of 100 nm sulfuric acid aerosols since these conditions have been the best characterized of any particle system, both in the laboratory (CitationMartin 2000) and via modeling work (Koop et al. 2000).
Homogeneous freezing of sulfuric acid is only observed at temperatures below 235 K (Koop 2000). Using sulfuric acid aerosols generated from a 70% w/w solution, freezing experiments were conducted for the range 217 K < T < 244 K. The RH of the chamber was increased by increasing Δ T in the chamber. The injector position, d, was chosen to be at an intermediate position (30 cm) from the edge of the chamber (see ) so as to give sufficient time (residence time of 12 s) for the ice crystals to grow to be detected by the larger size bin, but also short enough to avoid potential gravitational settling losses (see below).
From a gravitational settling perspective, we note that Rogers (1988) has described in detail that for various typical CFDC supersaturation conditions ice particles consistently grow to a maximum of 5–10 μ m. The corresponding settling velocities for this size range of ice crystals for our temperature and pressure conditions are 0.1–0.3 cm s–1 (Finlayson-Pitts and Pitts 2000). For our chamber, the particle must fall 0.95 cm in order to settle out of the flow and hit the bottom plate. So, for an ice crystal 5 μ m in size, it would require approximately 10 s to settle out of the flow. Using ice crystal and water droplet growth equations (Rogers and Yau 1989), we conducted calculations to show that at 233K, RHw = 100% it would take the particle about 6 seconds to grow to this 5 μ m criterion, which is roughly the size at which gravitational settling would become important. However, it would then take approximately 10 s more for the ice crystal to fully settle out of the flow, at which point it would have been sampled by the OPC.
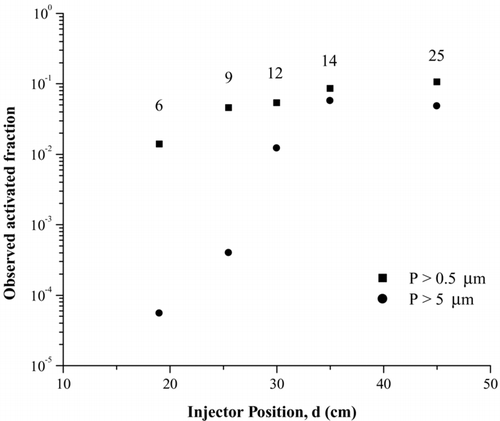
Clearly, particle growth and gravitational settling are coupled processes, and so this simple analysis is only an approximation to the true behavior. And so, for validation that gravitational settling is not a major effect in our experiments we have conducted residence time experiments with Arizona Test Dust particles atomized from a suspension of ATD in water (approximately 0.015 g/ml), passed through a diffusion dryer, and then studied in the CFDC under conditions close to water saturation. In , we plot the activated fraction of particles measured with both the smaller and larger size bins, as a function of sample injector position. It is shown that for the residence time used in this work (12 s), the smaller size bin data are converging to a plateau value at about 30 cm injector position and higher, i.e., there is sufficient time for particles to grow to the detectable size. For the larger size bin, corresponding to particles larger than 5 μ m, the effects of insufficient growth time are clearly observed for positions less than 30 cm. Also, since the activated fraction between the 14 and 25 s residence time is similar we believe that for these temperature conditions that having a much longer residence time is not leading to gravitational settling. This is also consistent with the observations in Tomlinson and Fukuta (1985) and Rogers (1988) that despite various Ts and RHs ice crystals consistently grew to average sizes of 8 μ m. Note that the maximum activated fraction in these experiments was somewhat below unity, possibly because of water vapor depletion arising from ice formation. In particular, we have noted that this maximum value for the activated fraction increases as the supersaturation values in the chamber are increased. This effect is due to a change in ice forming mechanism to condensation freezing, where the less active IN will only form ice at water supersaturations and therefore not form ice in the deposition mode. This would be consistent with not having the activated fraction reaching unity at water saturation.
FIG. 6 Fraction of ATD particles that activate as ice crystals as a function of residence time in the UT-CFDC. These data were collected at 223 K and RHw = 99%. The work presented in this article was all carried out at a residence time of 12 seconds, which corresponds to an injector position of 30 cm. The numbers next to the data points indicate the corresponding residence times.
For the sulfuric acid experiments used to validate the supersaturation conditions in the chamber, the fraction of particles that nucleated ice is plotted as a function of RH in for an experiment conducted at 230 K. The freezing conditions for 0.1% of the particles are reported as a function of temperature in juxtaposed against the homogeneous freezing curve for 100 nm H2SO4 aerosols. Although the data are calculated from counts in both the small and large size channels, it is the signal in the small size channel that dominates. Each data point in arises from a measurement where the RH is increased and decreased in cycles so as to observe the RH conditions where the activated fraction increases to values of 0.1% or greater. At all temperatures the values for at least 0.1% of particles activated have been plotted. Since these points are close to the homogeneous freezing line it shows that particles are observed to freeze at the expected values thus validating the RH measurements in the chamber. On the same plot, to compare our values with previous studies, we have data points for freezing of 50 nm sulfuric acid particles from Chen et al. (2000). These match up quite well with our data and serve as an additional confirmation that the chamber operates as expected in the temperature range studied.
FIG. 7 Summary of the 100 nm H2SO4 homogeneous freezing experiments over a range of temperatures. Squares: Freezing fraction of at least 0.1% or more of the particles. Stars: freezing of 0.1% of 50 nm H2SO4 particles from Chen et al. (2000). Also, refer to text for explanation of the circle-shaped data points. The activated fraction was determined using the sum of the counts from the large and small particle channels. Error bars represent 1σ from at least 3 runs during an experiment.
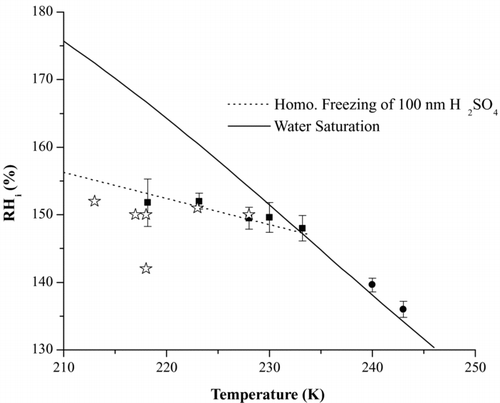
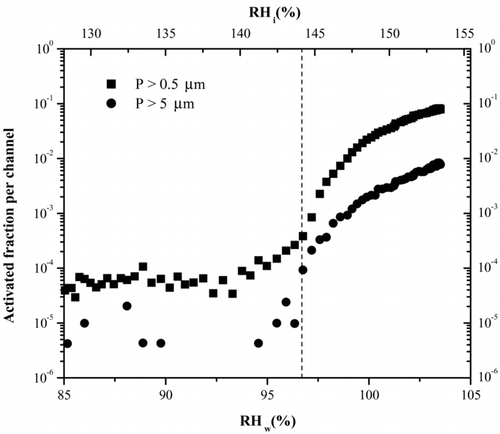
In addition, note that even though homogeneous freezing is only observed at T < 235 K, there are data for 240 and 243 K in . Even though at this temperature the data indicate that 0.1% of the particles activate at water saturation, we do not believe that freezing has occurred at this temperature. This is illustrated in , which shows the activation curve for 100 nm H2SO4 aerosols at 240 K. Note that at water saturation the smaller size channel indicates activation whereas the larger channel remains at background levels. However, we know that ice formation is indicated by growth in both channels since ice grows at faster rates than do water drops. In particular, in data not shown here, we have observed that for experiments at 243 K that Arizona Test Dust (ATD) both OPC channels activate when ice formation occurs, presumably via a condensation-immersion freezing mode. This shows that there is sufficient residence time in the chamber for ice particles to grow to at least 5 μ m in size at 243 K. For the case of sulfuric acid at 240 K, since the growth is only in the smaller size channel it can be concluded that the observation is due to growth of the particle due to activation of water uptake to form water droplets, and that it is not due to ice formation. In addition, since the transition to 0.1% activation coincides with the water saturation line (see ), the experiments confirm the calculated RHs in the chamber under these warmer temperature conditions.
FIG. 8 Activation curve of H2SO4 aerosols at 240 K This temperature is above where we expect homogeneous freezing and therefore no ice formation should be observed. Note that once water saturation has been reached, the P > 0.5 μ m channel (squares) starts to increase indicating water droplet formation. However the P > 5μ m channel (circles) remains at background level, indicating no ice formation.
To further validate the behavior observed in the chamber, we have conducted a number of calculations. First, using the online Aerosol Inorganic Model (AIM) 1 (http://www.aim.env.uea.ac.uk/aim/aim.php) (Carslaw et al. 1995; Massucci et al. 1999; Clegg and Brimblecombe 2005) we have confirmed that uptake of water by 100 nm sulfuric acid particles at 99% RHw and from 243 > T > 223 will give rise at equilibrium to 410 nm particles, i.e., without water droplet activation, the conditions would be insufficient to give rise to 500 nm particles and be detected in the small OPC channel. Since sulfuric acid is the most hygroscopic material encountered in the atmosphere, it is safe to say that if aerosol is size selected to 100 nm or smaller, growth in the 0.5 μ m channel must be due to ice formation.
Second, to confirm that we indeed do not have water droplets that grow to 5 μ m thus contaminating the large OPC channel, we calculated the droplet growth rates using equations from Rogers and Yau (1989) for 12 s residence time, the maximum saturation reached in (RHw = 103%) and 243 K. We find that a water droplet would grow to approximately 4.6 μ m under such conditions, and that either a higher saturation ratio or residence time would be required for water droplets to make it into the 5 μ m channel. For cooler temperatures, 233 and 223 K, the growth is even slower at this supersaturation. This shows that it would require high water saturations before the large particle channel would be contaminated by water droplets. For the current configuration we therefore describe our upper RHw limit as 103% for the highest temperatures.
Finally, again using the approach described in Rogers and Yau (1989), we calculated the conditions required for ice crystals to grow in size, for a range of temperatures. For 233 K and 243 K, there is no kinetic constraint for growth into the 5 μ m channel down to an RHi value of 112 and 104% respectively, for a residence time of 12 s. At the lowest temperature studies, 223 K, ice crystals just approach the 5 μ m size for a RH i value of 145%. Indeed, confirms this behavior, where incomplete activation into the 5 μ m channel is observed at 223 K and 12 s residence time. illustrates that longer residence times are required for more complete activation at this low temperature.
The uncertainty in calculated chamber RH values will come mostly from uncertainties in temperature measurements (± 0.1 K) along the length of the copper plates. For two measurements from the upper and lower plates, the maximum uncertainty that could arise is ± 0.2 K, which translates into an uncertainty in RH of approximately ± 4% in the center of the chamber. This estimated uncertainty is roughly consistent with the agreement between the measured and expected values for ice/water formation in , which is on the order of a few percent as well.
5. ATTRIBUTES AND LIMITATIONS OF THE IN COUNTER
Designed for laboratory studies, the UT-CFDC design is based on a flat plate horizontal CCN chamber (Kumar et al. 2003). One of the biggest advantages is that the design requires minimal machining and is easily built in house. In addition, the introduction of sample and sheath flows is relatively straightforward compared to what is involved in a cylindrical geometry. The ice detector used is a commercially available optical particle counter that is inexpensive ($5000) and can nevertheless distinguish between water droplets from ice particles by virtue of having two different size channels. In particular, the large particle channel indicates ice formation exclusively because water drops do not grow to that large a size in the given residence times, for temperatures up to 243 K and RHw = 104%. The chamber also has one standard total flow rate that is determined by the total flow of the OPC, and no external vacuum pumps are required. For the first time to our knowledge, the design allows the residence time of particles in the chamber to be changed by adjusting the position of the movable sample injector. This allows for effects of gravitational settling or insufficient crystal growth time to be assessed. The icing process for both the cold and warm wall does not require pumping water in and out of the chamber under freezing conditions as is performed by other systems, nor does it require special mechanical treatment such as ebonizing (Rogers 1988) or sand blasting (Stetzer et al. 2008) of the inner walls of the chamber. All that is required is that commercially available quartz filter paper lines the walls. Nevertheless, the background count rates, especially in the large particle size bin, are sufficiently low that measurements of IN numbers in the field may eventually be possible. Finally, the temperature of the plates is easily controlled by two separate re-circulating chillers therefore allowing precise achievement of sample T and RHs during a given experiment. If only one chiller is available, then automated, rapid switching of the flow between the two plates with variable durations of cold flow would provide a stable temperature gradient.
On the other hand, there are limitations to the chamber imposed by its simplicity and cost. For the coldest temperatures (roughly 220 K and below), the ice crystal growth rate is sufficiently slow that 5 μ m particles may not be formed. In such a case, the 0.5 μ m OPC channel can be used, so long as the diameters and composition of the incoming particles are known. In particular, for insoluble solids, no particles larger than 0.5 μ m could be injected else the background counts will increase; for the most hygroscopic material, the particles would have to be no larger than about 0.1 μ m due to water uptake which would also lead to higher background counts. Alternatively a more expensive OPC with more sizing channels could be utilized, in particular one with sizing capabilities between 0.5 and 5 μ m.
A second potential limitation is that the current design of the chamber has no water droplet evaporation region (where RHw < 100% but RHi = 100%) that has been incorporated into a number of chambers (Rogers 1988; Salam et al. 2006; Stetzer et al. 2008). The purpose of this evaporation region is to allow ice particles to transit but for water droplets to evaporate. In our case, for temperatures below 243 K and for RHw, 103%, we are confident that using the 5 μ m channel allows us to distinguish cases where both ice and liquid water droplets may be present. The configuration of the chamber is such that additional optical devices, such as those that distinguish between ice and water droplets by observing the degree of depolarization of a polarized laser beam could still be employed, if necessary.
In terms of potential future development into a field-based instrument, the current design would have to be re-engineered with regards to its refrigeration. Also, the present pumping capabilities may be insufficient for operation at low pressures, as from an aircraft. Nevertheless, the design of the chamber itself would probably not have to be substantially altered.
6. CONCLUSIONS
We report here the development of a new parallel plate ice nucleation chamber that is designed to study low temperature ice nucleation in the laboratory. The UT-CFDC follows the same general operating principles of other CFDC instruments, but it is constructed with a simple, small, and cheap design that is nevertheless able to distinguish between ice and water particles up to temperatures of about 240 K. In addition, it has a novel capability of performing particle growth and settling studies, through the use of a movable sample injector that allows aerosol residence times to be varied. Mono-disperse sulfuric acid aerosol was used to validate the accuracy of calculated RH in the chamber. In particular, homogeneous freezing of the aerosols occurred within experimental uncertainties at the well-defined literature values described by the Koop et al. (2000) parameterization. We also note that freezing of sulfuric acid was not observed at temperatures above the homogeneous freezing temperature, but rather water uptake was observed at RHw = 100% and 243 K, confirming that we also accurately establish water saturation conditions in the chamber.
Acknowledgments
This work was funded by NSERC. We acknowledge the valuable comments from the two anonymous reviewers.
Related Research Data
REFERENCES
- Abbatt , J. P. D. , Benz , S. , Cziczo , D. J. , Kanji , Z. , Lohmann , U. and Mohler , O. 2006 . Solid Ammonium Sulfate Aerosols as Ice Nuclei: A Pathway for Cirrus Cloud Formation . Sci. , 313 ( 5794 ) : 1770 – 1773 .
- Al–Naimi , R. and Saunders , C. P. R. 1985 . Measurements of Natural Deposition and Condensation-Freezing Ice Nuclei with a Continuous Flow Chamber . Atmos. Environment (1967) , 19 ( 11 ) : 1871 – 1882 .
- Archuleta , C. M. , DeMott , P. J. and Kreidenweis , S. M. 2005 . Ice Nucleation by Surrogates for Atmospheric Mineral Dust and Mineral Dust/Sulfate Particles at Cirrus Temperatures . Atmos. Chem. Phys. , 5 : 2617 – 2634 .
- Carslaw , K. S. , Clegg , S. L. and Brimblecombe , P. 1995 . A Thermodynamic Model of the System Hcl-Hno3-H2so4-H2o, Including Solubilities of Hbr, from Less-Than-200 to 328 K . J. Phys. Chem. , 99 ( 29 ) : 11557 – 11574 .
- Chen , Y. L. , DeMott , P. J. , Kreidenweis , S. M. , Rogers , D. C. and Sherman , D. E. 2000 . Ice Formation by Sulfate and Sulfuric Acid Aerosol Particles Under Upper-Tropospheric Conditions . J. the Atmos. Sci. , 57 ( 22 ) : 3752 – 3766 .
- Chen , Y. L. , Kreidenweis , S. M. , McInnes , L. M. , Rogers , D. C. and DeMott , P. J. 1998 . Single Particle Analyses of Ice Nucleating Aerosols in the Upper Troposphere and Lower Stratosphere . Geophys. Res. Letters , 25 ( 9 ) : 1391 – 1394 .
- Clegg , S. L. and Brimblecombe , P. 2005 . Comment on the Thermodynamic Dissociation Constant of the Bisulfate Ion from Raman and Ion Interaction Modeling Studies of Aqueous Sulfuric Acid at Low Temperatures . J. Phys. Chem. A , 109 ( 11 ) : 2703 – 2706 .
- Cooper , W. A. and Saunders , C. P. R. 1980 . Winter Storms over the San-Juan Mountains. 2. Microphysical Processes . J. Applied Meteorology , 19 ( 8 ) : 927 – 941 .
- DeMott , P. J. , Chen , Y. , Kreidenweis , S. M. , Rogers , D. C. and Sherman , D. E. 1999 . Ice Formation by Black Carbon Particles . Geophys. Res. Lett. , 26 ( 16 ) : 2429 – 2432 .
- DeMott , P. J. , Cziczo , D. J. , Prenni , A. J. , Murphy , D. M. , Kreidenweis , S. M. , Thomson , D. S. , Borys , R. and Rogers , D. C. 2003a . Measurements of the Concentration and Composition of Nuclei for Cirrus Formation . Proc. Natl. Acad. Sci. USA , 100 ( 25 ) : 14655 – 14660 .
- DeMott , P. J. , Sassen , K. , Poellot , M. R. , Baumgardner , D. , Rogers , D. C. , Brooks , S. D. , Prenni , A. J. and Kreidenweis , S. M. 2003b . African Dust Aerosols as Atmospheric Ice Nuclei . Geophys. Res. Lett. , 30 ( 14 ) doi: 10.1029/2003GL017410
- Dymarska , M. , Murray , B. J. , Sun , L. M. , Eastwood , M. L. , Knopf , D. A. and Bertram , A. K. 2006 . Deposition Ice Nucleation on Soot at Temperatures Relevant for the Lower Troposphere . J. Geophys. Res.—Atmospheres , 111 ( D4 ) doi:10.1029/2005JD006627
- Finlayson-Pitts , B. J. and Pitts , J. N. 2000 . Chemistry of the Upper and Lower Atmosphere , 362 San Diego : Academic Press .
- Hobbs , P. V. and Radke , L. F. 1975 . Nature of Winter Clouds and Precipitation in Cascade Mountains and Their Modification by Artificial Seeding. 2. Techniques for Physical Evaluation of Seeding . J. Appl. Meteorol. , 14 ( 5 ) : 805 – 818 .
- Hussain , K. and Saunders , C. P. R. 1984 . Ice Nucleus Measurement with a Continuous-Flow Chamber . Quart. J. Royal Meteorol. Soc. , 110 ( 463 ) : 75 – 84 .
- IPCC . 2007 . Climate Change 2007: The Scientific Basis–Contributions of Working Group I to the Third Assessment Report of the Intergovernmental Panel on Climate Change , Edited by: Houghton , J. T. 881 New York : Cambridge Univ. Press .
- Kanji , Z. A. and Abbatt , J. P. D. 2006 . Laboratory Studies of Ice Formation Via Deposition Mode Nucleation onto Mineral Dust and N-Hexane Soot Samples . J. Geophys. Res.—Atmospheres , 111 ( D16 ) doi:10.1029/2005JD006766
- Kanji , Z. A. , Florea , O. and Abbatt , J. P. D. 2008 . Ice Formation Via Deposition Nucleation on Mineral Dust and Organics: Dependence of Onset Relative Humidity on Total Particulate Surface Area . Environ. Res. Letters , 3 ( 2 ) : 7
- Knopf , D. A. and Koop , T. 2006 . Heterogeneous Nucleation of Ice on Surrogates of Mineral Dust . J. Geophys. Res.—Atmospheres , 111 ( D12 ) doi:10.1029/2005JD006894
- Koehler , K. A. , Kreidenweis , S. M. , DeMott , P. J. , Prenni , A. J. and Petters , M. D. 2007 . Potential Impact of Owens (Dry) Lake Dust on Warm and Cold Cloud Formation . J. Geophys. Res.—Atmospheres , 112 ( D12 ) doi:10.1029/2007JD008413
- Koop , T. The Formation of Ice Clouds from Supercooled Aqueous Aerosols . AIP Conference Proceedings . pp. 534 (Nucleation and Atmospheric Aerosols):549–560
- Koop , T. , Luo , B. P. , Tsias , A. and Peter , T. 2000 . Water Activity as the Determinant for Homogeneous Ice Nucleation in Aqueous Solutions . Nature , 406 ( 6796 ) : 611 – 614 .
- Kumar , P. P. , Broekhuizen , K. and Abbatt , J. P. D. 2003 . Organic Acids as Cloud Condensation Nuclei: Laboratory Studies of Highly Soluble and Insoluble Species . Atmos. Chem. Phys. , 3 : 509 – 520 .
- Marcolli , C. , Gedamke , S. , Peter , T. and Zobrist , B. 2007 . Efficiency of Immersion Mode Ice Nucleation on Surrogates of Mineral Dust . Atmos. Chem. Phys. , 7 ( 19 ) : 5081 – 5091 .
- Martin , S. T. 2000 . Phase Transitions of Aqueous Atmospheric Particles . Chemical Reviews , 100 ( 9 ) : 3403 – 3453 .
- Massucci , M. , Clegg , S. L. and Brimblecombe , P. 1999 . Equilibrium Partial Pressures, Thermodynamic Properties of Aqueous and Solid Phases, and Cl-2 Production from Aqueous HCl and HNO3 and Their Mixtures . J. Phys. Chem. A , 103 ( 21 ) : 4209 – 4226 .
- Mizuno , H. and Fukuta , N. 1995 . Natural Ice Nucleaus Measurement under High Supersaturation . J. Meteorol. Soc. Japan , 73 ( 6 ) : 1115 – 1122 .
- Murphy , D. M. and Koop , T. 2005 . Review of the Vapor Pressures of Ice and Supercooled Water for Atmospheric Applications . Quart. J. Royal Meteorol. Soc. , 131 ( 608 ) : 1539 – 1565 .
- Prenni , A. J. , DeMott , P. J. , Twohy , C. , Poellot , M. R. , Kreidenweis , S. M. , Rogers , D. C. , Brooks , S. D. , Richardson , M. S. and Heymsfield , A. J. 2007 . Examinations of Ice Formation Processes in Florida Cumuli Using Ice Nuclei Measurements of Anvil Ice Crystal Particle Residues . J. Geophys. Res.—Atmospheres , 112 ( D10 ) doi:10.1029/2006JD007549
- Rogers , D. C. 1988 . Development of a Continuous Flow Thermal Diffusion Chamber for Ice Nucleation Studies . Atmos. Res. , 22 : 149 – 181 .
- Rogers , R. R. and Yau , M. K. 1989 . A Short Course in Cloud Physics. , Oxford : Pergamon Press .
- Salam , A. , Lohmann , U. , Crenna , B. , Lesins , G. , Klages , P. , Rogers , D. , Irani , R. , MacGillivray , A. and Coffin , M. 2006 . Ice Nucleation Studies of Mineral Dust Particles with a New Continuous Flow Diffusion Chamber . Aerosol Sci. Technol. , 40 ( 2 ) : 134 – 143 .
- Stetzer , O. , Baschek , B. , Luond , F. and Lohmann , U. 2008 . The Zurich Ice Nucleation Chamber (ZINC)—A New Instrument to Investigate Atmospheric Ice Formation . Aerosol Sci. Technol. , 42 ( 1 ) : 64 – 74 .
- Tomlinson , E. M. and Fukuta , N. 1985 . A New Horizontal Gradient, Continuous Flow, Ice Thermal Diffusion Chamber . J. Atmos. Oceanic Technol. , 2 : 448 – 467 .
- Zobrist , B. , Marcolli , C. , Koop , T. , Luo , B. P. , Murphy , D. M. , Lohmann , U. , Zardini , A. A. , Krieger , U. K. , Corti , T. , Cziczo , D. J. , Fueglistaler , S. , Hudson , P. K. , Thomson , D. S. and Peter , T. 2006 . Oxalic Acid as a Heterogeneous Ice Nucleus in the Upper Troposphere and its Indirect Aerosol Effect . Atmos. Chem. Phys. , 6 : 3115 – 3129 .