Abstract
Non-uniformly charged particles cause a major problem in electrical methods for producing standard aerosols, imposing strict limitations on the usability of the obtained standard aerosols. This article gives a quick overview of this problem, examining the ways how differently charged particles affect the generation of standard aerosols, and presenting a new method for producing standard aerosols and avoiding the effects of multiply charged particles, with the key idea that the probability for small particles to have more than one charge is very low. A two-stage aerosol generator is used. Small silver particles (d< 40 nm) generated by homogeneous nucleation of silver vapors obtain in bipolar charger not more than one elementary charge. These condensation nuclei are enlarged by a condensational growth device. Big particles are now also not more than singly charged, and narrow size distribution can be obtained by electrical separation. Properties of standard aerosols produced experimentally by both the conventional and the new method, are compared and the validity of the new idea behind the new method is confirmed.
1. INTRODUCTION
Standard aerosols—aerosols with a well-determined particle size spectrum, are needed for many purposes, e.g., for scientific research in aerosol physics and chemistry, biology, and medi- cine, and especially, for the calibration of aerosol measuring devices. As a rule, the quasi-monodispersed aerosols are used, and three characteristics (moments): the particle mean (median, modal) diameter, some characteristic of the spectrum width, and the particle (number, volume, mass) concentration are considered to be sufficient for the description of the spectrum.
The well-known standard aerosol generation methods include the pneumatic pulverization of the aqueous suspension of the monodispersed polymer (latex) nano- and microspheres, the pulverization of non-volatile liquids or solutions by vibrating orifice generators, and electrical separation of particles from a polydispersed aerosol. All these methods have their advantages and shortcomings, which generally limit their usability outside specific particle size ranges. Among these, the electrical separation method can be considered the most versatile as it can be more easily applied in a wide particle size range. However, as with other methods for producing standard aerosols, the electrical separation method has its own challenges. The aim of this article is, first, to give a quick overview of these challenges and, second, offer a method which can completely eliminate them and open up the electrical separation method for a much wider use.
2. ELECTRICAL SEPARATION AND STANDARD (CALIBRATION) AEROSOL QUALITY
The electrical separation method was first developed by CitationLiu and Pui (1974) for the calibration of the condensation nuclei counters. With this method, a narrow fraction of particles determined according to their electrical mobility is separated (secondary aerosol—SA) from an aerosol with a comparatively wide size spectrum (primary aerosol—PA) by a Hewitt-type (CitationHewitt 1957) electrical classifier (Differential Mobility Analyzer—DMA). This DMA represents a second order aspiration capacitor with divided input and output air flows (CitationTammet 1970). Here, at least some part of the particles of PA must be electrically charged. To obtain a narrow fraction according to the particle size as well, the particles of PA have to be charged as uniformly as possible, i.e., their charge must be independent of their diameter. The stationary charge distribution obtained by aerosol particles in the symmetrically bipolar ion atmosphere satisfies this requirement for small particles (diameter d< 40 nm), when the probability of more than one electron charge on a particle is negligible. For such small particles the electrical separation is the best or even the only method for the generation of the standard aerosols. Here the particle mean diameter and the width of the size spectrum of SA can be calculated via the geometric and regime parameters of the DMA (which determine its transfer function); particle concentration can be determined by the electric current carried by the singly charged particles to some current sensor.
The electrical separation method has been applied up to the particle diameter of 500 nm, but the unavoidable effect of multiply charged particles seriously worsen the quality of standard aerosols by bigger particles (CitationKikas et al. 1982; CitationReischl 1991; CitationTamm 1992). Among the separated particles with a narrow mobility distribution there are multiply charged bigger particles, having the same mobility as the singly charged “major” particles. As a result, the SA with an asymmetric or even multimodal size distribution is obtained.
The presence of more than one size fraction in SA decreases its usability as a standard aerosol. To describe this, a new SA “quality” parameter ξ = 0….1 is defined:
As PA is a fresh aerosol produced by a generator, its size distribution density (size spectrum) f∗(d) can be considered lognormal:
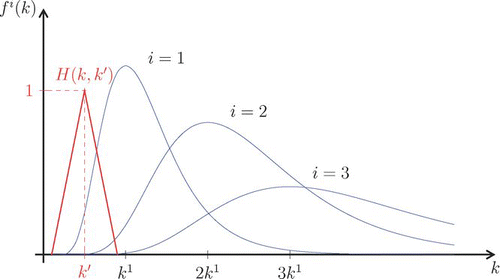
FIG. 1 Mobility distribution density of 1-, 2-, and 3-fold charged components of PA and the DMA transfer function H. The transfer function is considered to be triangular (CitationTammet 1970; CitationStolzenburg 1988; CitationStratmann et al. 1997) and, for the better illustration of the multiple charge problem, it is shown relatively broader than it is in real experiments.
When using the conventional method to generate PA, i.e., direct charging/neutralization of big particles (usually produced by pneumatical atomization), a compromise must be found between high SA quality and a high particle concentration. Usually SA is separated from far left of the PA mobility distribution, expecting (near) ideal aerosol quality and making do with low particle concentrations. However, a good quality calibration aerosol cannot always be obtained this way. It was shown in (CitationUin and Tamm 2008) that the gain in quality by moving the separation point away from the distribution peak is relatively small while the decrease in concentration remains significant. Also, there appears to be a fundamental effect where the aerosol quality will have a low region in the particle size scale regardless of the separation point.
CitationGupta and McMurry (1989) proposed the low-ion-concen- tration charger method for reducing the amount of multiply charged particles in PA. Decreasing the value of the charging parameter (the product of ion concentration and the residence time of particles in ionizer), the ratio of multiply charged particles to all charged particles was reduced to 10% and 20% for 0.5 and 1 μm particles accordingly. This means, that when separating the 0.5 μm particles from the PA with a rather wide size spectrum (obtained by pneumatic pulverization of the solutions), the quality parameter ξ will have the value of ≈0.8. Generally, the same result can be achieved using a special bipolar corona ionizer described in (CitationPeil et al. 1992). It follows that known methods for obtaining a higher quality standard aerosol do not work well and a new method is required.
3. OBTAINING HIGHER QUALITY CALIBRATION AEROSOL
3.1. A Method for Avoiding the Multiple Charges Problem
As shown previously, problems arise when using the conventional methods for generating calibration aerosols—the presence of multiple charges on particles imposes limitations on the usability of the produced aerosol. However, a simple method exists which completely removes the effect of multiple charges and allows a much more efficient usage of the generated calibration aerosol (CitationMirme and Tamm 2002).
Instead of the conventional scheme where simply particles of a required size range are produced and then charged or neutralized, a two-step process is used, as in the well-known LaMer generator (CitationSinclair and LaMer 1949). During the first step, initial small particles (nuclei) are generated and then charged. As the particles are small, the probability of their acquiring more than one elementary charge is very low. Finally, these particles are grown to the required size. As a result, such primary aerosol contains particles with no more than a single charge and also has a much narrower size distribution of particles compared to the usual PA produced by one-step process.
The calibration aerosol produced by this method is of higher quality. As there are no multiple charges the whole width of the PA distribution can be used—there is no need to seek the “tail” as previously. This means that the peak of the distribution becomes available, giving much higher signal levels for calibration. However, care must be taken not to have a too high concentration of the initial nuclei. The reason seems to be that some of the charged nuclei may remain small (undeveloped) and act as charging ions, causing multiple charges on grown particles. Similar effect may also appear even with low concentrations of nuclei, if the particles are not well mixed in the growth chamber and some of the nuclei may pass through without significant growth.
3.2. Experimental Verification of the Theoretical Considerations
To test the new method for generating standard aerosols, a series of experiments was carried out. The experiment setup is shown in .
FIG. 2 Block diagram of the experiment setup. The position of the neutralizer in different setups is indicated with a dashed line and an arrow. The diluter for the nuclei after the tube furnace and the ion trap before the LaMer generator are omitted for clarity.
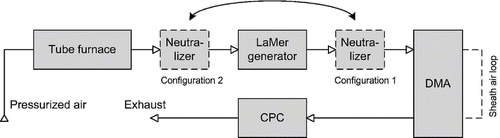
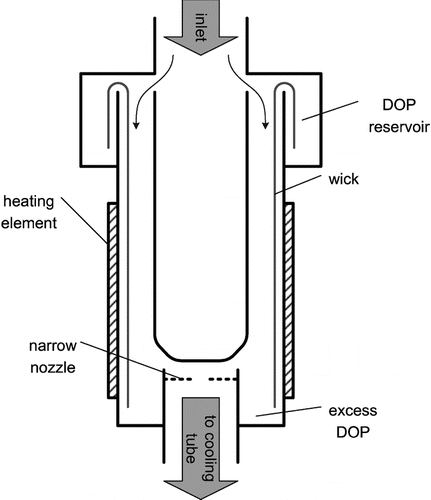
Silver (99.99% purity) particles with dm ≈ 18 nm (nuclei) were generated in a tube furnace at 1050°C and with the air flow rate of 3.3 l/min. The obtained aerosol was diluted (see previous section) and then passed through a 239Pu neutralizer and an ion trap (which removes the light charger ions). In a modified LaMer-type condensational generator (growth chamber) the charged particles are grown larger using DOP vapors (). The mean diameter of the grown particles depends mainly on the temperature of the heating zone (measured by a thermocouple just after the mixing nozzle) and the concentration of the nuclei. The latter can be controlled by an assembly of valve and a bypass with a high efficiency fiber filter (not shown in ), attached just after the tube furnace. Changing the temperature (T DOP) in the range of 60°C to 225°C and the concentration of the nuclei in the range of 1E6 1/cm3 to 1.4E5 1/cm3, DOP particles can be produced with the geometric mean diameter between 60 nm and 3 μm and the geometric standard deviation of their lognormal distribution density function of approximately 1.3. The temperature of the cooling tube (0.45 m glass tube) is not controlled as it has negligible effect on the outlet aerosol (PA): adding a thermal isolation to the tube had no significant influence on the PA.
FIG. 3 Schematic diagram of the LaMer-type condensational generator used to produce bigger particles.
Finally, the grown charged particles were led to a Vienna design-based DMA and a TSI Ultrafine CPC. For the separation of big particles (d> 1 μm), a special very long DMA (separator) was designed and built. Its dimensions are: length of the working area (distance between inlet and outlet slits) 1200 mm, diameters of the inner and outer electrodes 84 mm and 100 mm, accordingly. The sheath flow rate is adjustable from 30 l/min to 2 l/min for the separation of particles with mean size in the range of 0.1 μm to 10 μm. The aerosol flow rate is chosen so that the ratio of aerosol flow to sheath air flow remains between 0.1 and 0.04. A custom computer-controlled DC voltage source (with output range of 0–10 kV) is applied. The described DMA can principally separate particles with mean diameter of up to 10 μm, which is much higher than it is possible with other known long DMA-s (CitationHoppel 1981; CitationMyojo et al. 2004; CitationShimada et al. 2005).
The experiments were conducted using two different setups of the instruments. In the first (conventional) configuration, the neutralizer was placed after the growth chamber so that the already grown particles were charged. In the second (new) configuration, the charger (neutralizer) was connected before the growth chamber where the nuclei were charged before they were grown to a larger size (). In both cases, at the alternative position for the neutralizer, a “dummy” device was used with the same construction as the real neutralizer only with the radioactive source absent. This was done in order to equalize diffusional and inertial particle losses in both setups.
The main idea behind the experiments was to verify that the aerosol obtained from the second setup (the new method) does, indeed, not contain any particles with multiple charges and thus has perfect quality. If this is the case, then it should be possible to theoretically find the expected particle mobility distribution of the first (conventional) setup using the measured particle distribution from the new setup, and match it with the actual measured distribution of the conventional setup. Otherwise, if the expectedly perfect quality aerosol contains a noticeable number of multiply charged particles, there should be a large difference between the calculated and measured distributions.
In the experiments, the nuclei were grown to the final size distribution with the mean diameter of approximately 1300 nm to ensure high charging probabilities in case of the conventional setup. The particles were charged in two different setups as described above and, using a DMA and CPC, the number concentration of the charged particles (of one sign) at the DMA outlet as a function of the DMA TF midpoint mobility (DMA response) was determined in both cases. For the calculations, the mobility distribution density must be found. The mobility distribution density ϕ∗(k) of the particle number concentration n (normed to the total number concentration) is defined as:
The total theoretical DMA response for the conventional setup was finally calculated as a sum of the theoretical response functions of the differently charged particle fractions. This was then compared to the actual DMA response obtained from the experiments with the conventional setup. If the aerosol from the new setup has (near) perfect quality, then these two should match.
3.3. Experimental Results
The DMA response obtained experimentally using the new setup is shown in . It can be seen that despite the high particle size of around 1300 nm, there are no significant multiple charge fractions and the general shape of the function follows that of the lognormal curve (R 2= 0.996). There is, however, a slight deviation from the lognormal function towards the higher mobilities for which an explanation is given in the next part.
FIG. 4 Measured particle concentration as a function of the DMA TF midpoint mobility (DMA response), from the new setup. The mean particle diameter is approximately 1300 nm. (dg = 1260 nm, σ g = 1.25, N total= 6E5 1/cm3, N charged= 6.5E4 1/cm3, Φaerosol= 0.3 l/min, Φsheath= 8.6 l/min, T DOP= 180°C.)
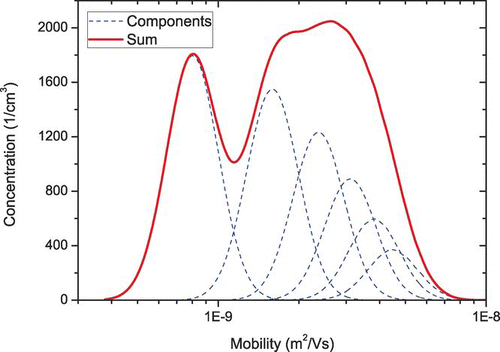
From the function in , the theoretical (apparent) mobility distribution density of all particles (if they were all singly charged) was found (using Equation [Equation5]). This enabled to model what would happen if the initial aerosol with this distribution density was charged in the conventional setup. The theoretical outcome is shown in , where the functions corresponding to the differently charged fractions are described by Equation (Equation6). The slight deviation from the lognormal function, as mentioned above, was small enough that an attempt to model it with a second lognormal function would not have given reliable results, thus the uncorrected lognormal fit was used.
FIG. 5 Model of the DMA response of SA particles describing the conventional method for producing aerosol. The differently charged fractions that make up the sum are also shown.
In the theoretical DMA response from the conventional setup is compared to the one determined experimentally; also, the measurement result from the new setup (shown previously in ) is presented as a reference. The model and the measurement data for the conventional setup are in a good general agreement. As expected and described by the model, the overall function consists of differently charged particle fractions (note the two small peaks visible in both the conventional setup data and the model DMA response at k ≈ 2E-9 m2/Vs and k ≈ 3E-9 m2/Vs). There is a small difference between the concentrations of the model and the data from the conventional setup, which originates from different particle losses between the two setups (in different setups the same route is traveled by differently charged particles). The total concentration for the conventional setup is also much higher compared to the new setup. This is expected, as it comes from the nature of the new setup, where the charging probabilities are determined by the size of the nuclei (d ≈ 18 nm) not the final grown particles (d ≈ 1300 nm).
FIG. 6 Measured DMA responses of SA particles from the conventional and the new setup and the model function for the conventional setup.
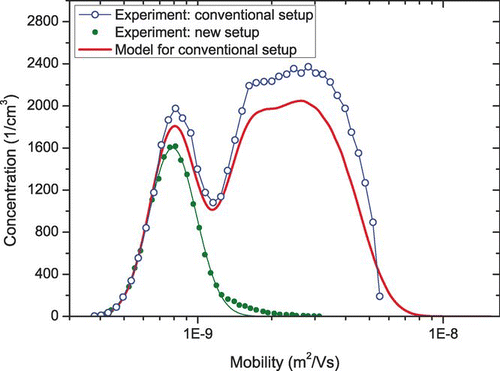
In order to avoid any misunderstandings, a further note must be added. In , the density functions of differently charged components are comparatively weakly overlapped, so that SA with good quality seems to be achievable even when the separation point of particles is at the peak mobility of singly charged particles. It must be considered, however, that the components in are calculated for PA with σ g = 1.25 (), and even here ξ ≈ 0.9 (calculated according to CitationUin and Tamm (2008)). With conventional method, as a rule, PA with σ g ≈ 2 is used and ξ has a much lower value. The new setup guarantees here ξ ≈ 1.
3.4. Further Notes
As mentioned above, in , a deviation of the measured data from the lognormal function can be seen. This is most likely caused by the presence of doubly charged particles, despite the measured data coming from the new (improved) setup. The reason for their existence seems to be in the construction of the actual growth chamber used in the experiments. It seems that there is a region inside the generator where nuclei are not well mixed with the DOP vapor and can pass through without any significant growth. Some of the undeveloped charged nuclei can then coagulate with the grown charged particles (of the same sign) and thus also transfer their single charge. The evidence to support this comes from the fact that with the adding to the outlet of the generator of a turbulence-causing narrow nozzle (see ) which helps to mix the nuclei and the vapors, the amount of doubly charged particles is significantly reduced. This was observed in the experiments (particle diameter approximately 110 nm), where without the nozzle, a second peak was seen in the measured mobility distribution of the particles at the position of twice the mobility of the main peak. This peak of doubly charged particles constituted about 15% of the amount of all charged particles. With the addition of the nozzle, no second peak was seen. The effect, as seen in (with the presence of the nozzle not being enough), disappears with smaller particles (difference between the sizes of the nuclei and the larger particles is smaller, which gives a smaller coagulation coefficient) () and with larger particles (higher generator temperature reduces the inhomogeneous area in the generator) (). Thus the effect does not arise from the shortcomings of the method in question, but from its actual implementation, i.e., a less efficient design of the generator. The influence of ungrown charged nuclei (see also end of section 3.1) seems to be the only probable mechanism for producing multiple charges, as light ions cannot penetrate the ion trap (see the experiment setup) and the coagulation coefficient for particles of different sizes is much higher than that of the equal-sized particles.
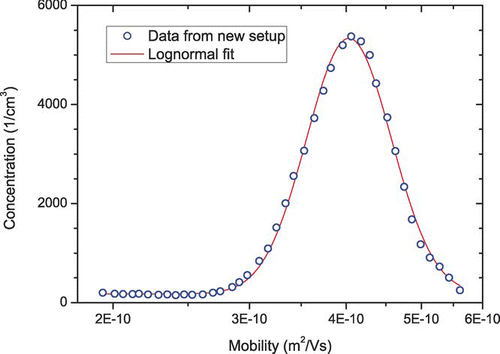
FIG. 7 Particle concentrations as a function of the DMA TF peak mobility from the new setup. The mobility diameter corresponding to the distribution peak is approximately 110 nm. (dg = 106 nm, σ g = 1.4, N total= 5.5E6 1/cm3, N charged= 6E5 1/cm3, Φaerosol= 1.5 l/min, Φsheath= 8.3 l/min, T DOP= 105°C.)
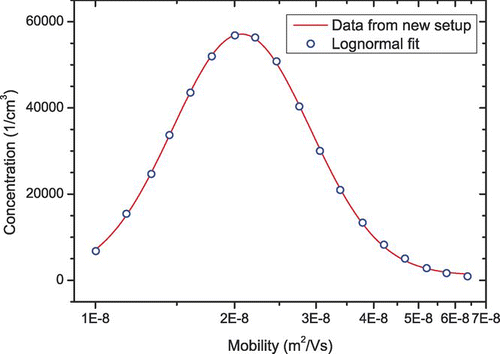
FIG. 8 Particle concentrations as a function of the DMA TF peak mobility from the new setup. The mobility diameter corresponding to the distribution peak is approximately 2400 nm. (dg = 2420 nm, σ g = 1.14, N total= 2.3E5 1/cm3, N charged= 2.5E4 1/cm3, Φaerosol= 1.5 l/min, Φsheath= 5 l/min, T DOP= 225°C.)
It should be noted that the presence of doubly charged particles in this case does not affect the calculations in any significant way, as the amount of those particles is very low. When using this aerosol for instrument calibration, their influence is reduced even more, as it can be shown that when separating from the peak of the PA distribution the number of multiply charged particles in the separated aerosol will be insignificantly small for this case.
To show that using the new method would yield a good quality aerosol in a wide size range, the DMA response from the new setup was also measured using smaller (d ≈ 110 nm) and larger (d ≈ 2400 nm) particles. A comparison between the two setups, as done above, was not performed in this case, as the validity of the new setup was already confirmed previously. The results are presented in and . As it can be seen, the measured data has a lognormal distribution and no multiply charged components are visible.
4. CONCLUSIONS
In this article, a new method for producing standard aerosols using electrical separation is given, which completely eliminates the problems arising from the presence of multiply charged particles. It is now possible to use electrical separation in a much wider particle size range and without having to be limited to low particle concentrations.
The limitations of previously used methods are not discussed in detail in this article as the subject of the determination of SA quality is dealt with in another (submitted, not yet published) manuscript by the same authors. However, preliminary results in (CitationUin and Tamm 2008) show a sharp drop in SA quality (ξ below 0.8) when dg > 200 nm and σ g > 1.5, when the conventional method as described above is used. In comparison, the quality in the new presented method does not depend on the particle size and due to the negligible probability of doubly charged initial nuclei, it remains perfect for practical purposes.
While some effects not allowing to reach maximum efficiency were found, these were not due to the shortcomings of the method itself but, rather, of its specific implementation. Even with this less than ideal implementation, much better results were obtained than would have been possible with the conventional methods used so far.
This work was supported by the Estonian Science Foundation under grant no. 6988 and by the Estonian Research Council Targeted Financing Project SF0180043s08. We also gratefully acknowledge the support from our colleagues from the Laboratory of Environmental Physics.
Related Research Data
REFERENCES
- Fuchs , N. A. 1947 . On the Magnitude of Electrical Charges Carried by the Particles of Atmospheric Aerocolloids . Izvestiya Acad. Sci. USSR, Ser. Geogr. Geophys. , 11 : 341 – 348 . in Russian with English abstract
- Gupta , A. and McMurry , P. H. 1989 . A Device for Generating Singly Charged Particles in the 0.1–1.0-um Diameter Range . Aerosol Sci. Technol. , 10 ( 3 ) : 451
- Hewitt , G. S. 1957 . The Charging of Small Particles for Electrostatic Precipitation . AIEE Trans. , 76 ( 31 ) : 300 – 306 .
- Hoppel , W. A. 1981 . Measurement of the Aerosol Size Distribution with NRL's Mobility Analyzer . Journal de Recherches Atmospheriques. , 15 : 313 – 319 .
- H[otilde]rrak , U. , Mirme , A. , Salm , J. , Tamm , E. and Tammet , H. 1998 . Air Ion Measurements as a Source of Information about Atmospheric Aerosols . Atmos. Res. , 46 ( 3–4 ) : 233 – 242 .
- Kikas , Ü. , Susi , R. and Tamm , E. 1982 . On the Theory of the Electrostatic Separation of Aerosols . Acta et Comm. Univ. Tartuensis , 631 : 76 – 84 . In Russian, summary in English
- Liu , B. Y. B. Y. H. and Pui , D. Y. H. 1974 . A Submicron Aerosol Standard and the Primary, Absolute Calibration of the Condensation Nuclei Counter . J. Colloid and Interface Sci. , 47 ( 1 ) : 155 – 171 .
- Mirme , A. and Tamm , E. 2002 . “ Electrical Classification in Wide Diameter Range ” . In Abstracts of Sixth International Aerosol Conference , 1073 – 1074 . Taiwan : Taipei .
- Myojo , T. , Ehara , K. , Koyama , H. and Okuyama , K. 2004 . Size Measurement of Polystyrene Latex Particles Larger than 1 Micrometer Using a Long Differential Mobility Analyzer . Aerosol Sci. Technol. , 38 ( 12 ) : 1178
- Peil , I. , Tamm , E. and Zubchenko , P. 1992 . Generation of a Narrow Bipolar Charge Distribution on Aerosol Particles . Acta Commentat. Univ. Tartuensis , 947 : 72 – 79 .
- Reischl , G. P. 1991 . The Relationship of Input and Output Aerosol Characteristics for an Ideal Differential Mobility Analyser Particle Standard . J. Aerosol Sci. , 22 ( 3 ) : 297 – 312 .
- Shimada , M. , Lee , H. M. , Kim , C. S. , Koyama , H. and Myojo , T. 2005 . Development of an LDMA-FCE System for the Measurement of Submicron Aerosol Particles . J. Chemical Engineering of Japan , 38 ( 1 ) : 34 – 44 .
- Sinclair , D. and LaMer , V. K. 1949 . Light Scattering as a Measure of Particle Size in Aerosols . Chemical Reviews , 44 ( 2 ) : 245 – 267 .
- Stolzenburg , M. R. 1988 . An Ultrafine Aerosol Size Distribution Measuring System , PhD thesis, University of Minnesota .
- Stratmann , F. , Kauffeldt , T. , Hummes , D. and Fissan , H. 1997 . Differential Electrical Mobility Analysis: A Theoretical Study . Aerosol Sci. Technol. , 26 : 368 – 383 .
- Tamm , E. 1992 . Electrical Classification as a Basis of the Aerosol Standard . J. Aerosol Sci. , 23 ( S1 ) : S285 – S288 .
- Tammet , H. 1970 . The Aspiration Method for the Determination of Atmos.—Ion Spectra , Jerusalem : Israel Program for Scientific Translations Ltd. .
- Tammet , H. 1991 . Aerosol Electrical Density: Interpretation and Principles of Measurement . Report Series in Aerosol Sci. , 19 : 128 – 133 .
- Uin , J. and Tamm , E. 2008 . “ Assessment of the Quality of Electrically Produced Standard Aerosols ” . In European Aerosol Conference 2008, Thessaloniki number T04A048P