ABSTRACT
We performed a series of laboratory studies to assess uncertainties in aerosol optical property measurements. We used a pulsed cavity ring-down spectrometer (CRD) to measure the aerosol light extinction coefficient, a photo-acoustic absorption spectrometer (PAS) for light absorption, and a commercial integrating nephelometer (TSI, model 3563) for the scattering coefficient. The test aerosols generated for the study consisted of both non-absorbing and slightly-to-highly absorbing polydisperse submicron particles, delivered to the systems as pure compounds or mixtures. For aerosols with single scattering albedo (ω) > 0.7, we found that the ω values calculated by combining the three instruments agreed within expected uncertainty. For aerosols with ω < 0.7, the discrepancy was outside of the boundaries of existing uncertainties. Mie theory calculations of the nephelometer correction factors indicate that the current literature expressions for nephelometer truncation correction are not adequate at ω < 0.7 due to the large real part of the refractive index (n) of absorbing particles. New corrections are given for the case when n is known. Based on our instrumental capabilities we conclude that the lowest uncertainty in ω is obtained by combining CRD and PAS data. The implications for the uncertainty of aerosol optical properties when using nephelometer-based scattering coefficient in the case of, e.g., highly absorbing aerosols, coarse mode particles, and measurements at high relative humidity are discussed.
1. INTRODUCTION
Aerosol particles are known to exert a critical role in the Earth's energy balance both directly and indirectly, yet the overall magnitude of such processes is poorly quantified. Current uncertainties in aerosol direct radiative effect (DRE) are comparable to the effect itself (0.5 ± 0.4 W/m2) with a medium-to-low level of understanding on a regional-to-global spatial scale (CitationIPCC 2007). Reducing the uncertainty of aerosol optical properties, i.e., light extinction (σep), light scattering (σsp), and light absorption (σap), is key to improve global aerosol forcing estimates. In particular, errors associated to measurements of the aerosol single scattering albedo ω (where ω=σsp/σep) need to be lowered by a meaningful degree (CitationSchwartz 2004). Limitations in instrumental precision and accuracy can represent major sources of error for aerosol optical property estimates. Several studies so far have looked at the agreement between measurement techniques to assess the overall uncertainty of both extensive and intensive optical quantities (CitationQuinn et al. 1996; CitationSheridan et al. 2005 and references therein; CitationHallar et al. 2006; CitationLack et al. 2008). All these studies have pointed out the existence of systematic instrument biases leading to varying degree of unsatisfactory optical property measurement closure.
Cavity ring-down spectroscopy (CitationBaynard et al. 2007 and references therein) is an accurate and sensitive technique for measurements of σep. Values of σap have been measured mostly by filter-based techniques (CitationBond et al. 1999; CitationWeingartner et al. 2003). Recently developed photo-acoustic systems (CitationArnott et al. 1999; CitationLack et al. 2006) offer a potentially more accurate measure of σap. Values of σsp are historically measured by commercial nephelometers (CitationHeintzenberg and Charlson, 1996 and references therein). An important measurement limitation with the nephelometer optical design is that light scattered at angles smaller than ∼7° and larger than ∼170° is neglected, leading to so-called truncation errors. Truncation and other systematic errors such as wavelength sensitivities can lead to uncertainties in the nephelometer σsp coefficient varying from 5% to 50% depending on particle size (CitationAnderson et al. 1996; CitationAnderson and Ogren 1998). Both angular non-idealities and wavelength sensitivities have been thoroughly quantified for commercial nephelometers manufactured by TSI1 Inc. (St. Paul, MN), and a correction scheme has been developed to reduce such errors (CitationAnderson and Ogren 1998). High uncertainties are to be expected for integrating nephelometer designs with poorly characterized truncation characteristics (CitationHeintzenberg et al. 2006) and for applications at high relative humidity (CitationHeintzenberg and Erfurt 2000). Calibration errors can also be a significant source of uncertainty in nephelometer-based measurements (CitationMüller et al. 2009). Furthermore, theoretical calculations by CitationMoosmüller and Arnott (2003) suggest higher than expected errors in nephelometer-derived σsp coefficients for absorbing aerosols due to changes in the scattering phase function. This effect may significantly influence the accuracy of ω estimates for atmospheric aerosols when using nephelometers coupled with other measurements such as the CRD-based σep coefficients. Recently, integrating spheres to measure σsp with minimal angular truncation have been developed (Varma et al. 2002; CitationAbu-Rahmah et al. 2006) and cosine-weighted scattering sensors have been coupled to instruments that also measure σep (CitationStrawa et al. 2003). Both these methods have the potential to reduce the uncertainties in scattering measurements, although neither is in widespread use.
In this study we present the results of experiments performed with both absorbing and non-absorbing laboratory submicrometer aerosol particles to examine instrumental closure in aerosol optical property measurements. We detect aerosol light extinction by using two custom-built cavity ring-down aerosol spectrometers, CRD (CitationBaynard et al. 2007), light scattering by a commercial three wavelength integrating TSI nephelometer (model 3563), and light absorption coefficient by a custom photo-acoustic absorption spectrometer, PAS (CitationLack et al. 2006). The paper is organized as follows: Section 2 describes the methodology and experimental set-up for aerosol generation, delivery and detection, and instrument calibrations. In Section 3 we report the experimental results for purely scattering aerosols, highly absorbing aerosols, and their mixtures. Calculations based upon Mie theory are performed to investigate the adequacy of the literature expressions for nephelometer truncation corrections for absorbing particles and provide new corrections for scattering measured by nephelometers (Section 4). We assess the uncertainty boundaries for ω values obtained by using nephelometry. The implications for the overall uncertainty of aerosol optical property measurements and for specific problems, e.g., determining aerosol absorption by subtracting the extinction and scattering measurements, are discussed.
2. EXPERIMENTAL SET-UP: PARTICLE GENERATION, TRANSPORT, AND DETECTION
Particles were generated using custom built constant rate Collison-type atomizers (CitationCollison 1935). To generate scattering polydisperse aerosols, we atomized inorganic salts such as ammonium sulphate (AS) and sodium chloride (NaCl), and organic compounds such as dioctyl sebacate (DOS) and water-soluble di-carboxilyc acids (SUCCINIC and ADIPIC). DOS is commonly used as test aerosol because it forms spherical particles upon atomization, whereas di-carboxylic organic acids, common components of ambient aerosols, were selected to investigate possible instrument biases due to volatility losses. A water soluble black pigment, nigrosin dye (NSN), was used to generate polydisperse absorbing aerosols (CitationLack et al. 2006). Mixtures of ammonium sulphate and humic acid (AS/HUMIC) and a complex mixture of inorganic salts and organics, MIXPO (CitationSvenningsson et al. 2006) were used as proxies for rural and continental polluted aerosols, respectively. lists the generated aerosol types and their characteristics.
TABLE 1 Property summary of sub-1 micron aerosols generated for the study. For polydisperse particles, the size is the number mean diameter obtained from size distribution tests. DOS is a Fluka, Inc. product; the other compounds are commercially available at Sigma-Aldrich Inc.
depicts a schematic of the aerosol generation apparatus and delivery setup. Two atomizers were used to produce internal and external aerosol mixtures by atomizing already mixed solutions (internal mixture) or by combining the output of two atomizers (external mixture). After atomization, all aerosols were dried to ∼5% relative humidity (RH) in a pyrex glass horizontal tube half-filled with molecular sieve; the residence time of aerosol in the tube was approximately 180 s. The aerosol flow exiting the sieve was diluted with filtered room air (RH < 15%) to reach a total flow of ∼32 lpm, and passed through a Berner-type impactor to ensure exclusion of particles with aerodynamic diameters >1 μm. Several tests performed using a custom-built differential mobility analyzer (DMA) serially connected with a condensation particle counter (CPC1, Model 3022A, TSI, St. Paul, MN) ruled out the presence of supermicron particles in the generated samples. For 1% solutions, the typical number median particle diameter (dp) was approximately 100 nm and the geometric standard deviation (σg) was 2.1 for AS, whereas for NSN dp was 90 nm and σg was 1.9. For the other mixtures, we observed similar particle diameter and width of the number size distribution values, in agreement with those obtained in previous laboratory studies performed by using the same solutions, size selection instrumentation, and atomizing technique (CitationPettersson et al. 2004; CitationBaynard et al. 2007).
FIG. 1 Schematic diagram of the experimental setup used in this study.
A computer-controlled valve was placed after the impactor to allow switching between sample flow and particle-free air to perform routine zeroing procedure of all instruments. Aerosols were delivered to the instruments through two sample flow lines. A CRD instrument (CRD #1) and the TSI nephelometer sampled at 28 lpm from one line. A second CRD cavity (CRD #2) with the PAS serially connected downstream sampled at 1.5 lpm. Based on CPC monitoring, differences in particle number concentrations downstream of the two lines were <1%, indicating minimal differential particle losses between the flow systems. Differences between the σep coefficients measured by the two independent CRD cavities were <0.5% throughout the entire experiment. A third CRD cavity constantly measured filtered air at 1.5 lpm to account for the fraction of gas phase absorption (mainly NO2 at 532 nm) to the total aerosol σep and σap signals. Gas phase absorption artifacts can be significant in polluted environments (CitationBaynard et al. 2007); for the present study, their contribution in the sample flow was <0.1% of the total σep coefficient. Corrections to σep accounting for purge flow dilution, Rayleigh scattering and pressure drops were <1% of σep. The resulting absolute uncertainty in the CRD extinction at 532 nm (hereafter δσep) is 1% for signal levels ⩾5 Mm−1 and averaging intervals ⩾3 s (CitationBaynard et al. 2007).
The TSI nephelometer was calibrated following the procedure suggested by the manufacturer and reported by CitationAnderson et al. (1996). The calibration terms were found to be almost identical to original values provided by the manufacturer, with differences varying between 1% and 3% depending on the wavelength channel. While the CRD instrument uses a pulsed 532 nm laser, the TSI nephelometer uses a broadband light source with three optical filters. The instrument scattering response is centered at ±2–4 nm off the nominal wavelengths due to a non-perfectly Lambertian nature of the light source illumination intensity, leading to so-called “wavelength non-idealities” (Anderson et al. 2006). The errors in the TSI nephelometer scattering coefficient (δσsp) due to truncation and wavelength non-idealities are reported to be a few to 10% for submicron particles, signal levels >10 Mm–1 and averaging intervals ⩾60 s (CitationAnderson et al. 1996). In the case of submicron aerosols, wavelength non-idealities can be a significant fraction of such errors (CitationAnderson and Ogren 1998). For this study we used the σsp measured at the nominal 550 nm band, for which the center wavelength is at approximately 554 nm (CitationAnderson et al. 1996). The 550 nm σsp coefficients were corrected for angular non-idealities using the scheme reported in CitationAnderson and Ogren (1998) for polydisperse aerosols (hereafter AO98) and converted to 532 nm to match the CRD and PAS wavelengths using the Ångstrom exponent (CitationÅngstrom 1929)
and solving the equation for σsp,532. The å term is calculated using the σsp coefficients measured at the nominal 450 nm and 700 nm and the actual center wavelength values of 453 nm and 698 nm.
The PAS system measured the σap coefficient at 532 nm using a continuous wave (CW) laser with a Δλ= 0.1 nm, and it was routinely calibrated with O3 following the procedure reported by CitationLack et al. (2006). The uncertainty associated with light absorption, hereafter δσap, is ∼5% (instrument accuracy) for signal levels ⩾3 Mm–1 and averaging intervals ⩾3 s. The CRD, PAS and TSI nephelometer data used in the study were averaged to 60 s time resolution.
We calculated three values of ω using different instrument combinations,
and directly compared the ω1, ω2, and ω3 values to assess the level of method agreement in the optical property measurements. Since neither the CRD nor PAS present significant angular biases, the comparison of ω2 and ω3 against ω1 gives the possibility to assess the effectiveness of the AO98 expression in correcting the nephelometer-based scattering coefficients for angular and wavelength non idealities in the case of submicron aerosols.
3. RESULTS
3.1. Non Absorbing Polydisperse Aerosol Particles
Direct comparison of CRD σep and TSI nephelometer σsp was performed with non absorbing polydisperse particles. In the absence of aerosol absorption, we use the CRD as an independent measurement of σsp with insignificant angular biases, low uncertainty and well quantified accuracy and precision (CitationBaynard et al. 2007). Values of σep measured by the CRD and σsp measured by the TSI nephelometer (corrected with the AO98 expression and converted to 532 nm according to Equation (Equation1) for dry, sub-1 μm AS particles agree within expected uncertainties, with a least-squares linear regression slope of 0.998 ± 0.001 and R2 of 0.999 ()).
FIG. 2 (a) σsp measured by the TSI nephelometer (corrected using the AO98 expression, and converted to 532 nm) displayed versus the σep measured by the CRD for sub-1 micron dry AS particles (slope = 0.998, R2= 0.999). (b) TSI nephelometer submicron correction factors determined by the AO98 correction plus wavelength conversion (Cλ,AO98, solid line) and fit to the experimental data plus wavelength conversion (Cλ,EXP, dashed line) for polydisperse AS, NaCl, and DOS particles. Error bars are ±3.0% (1-σ uncertainty).
Several non-absorbing polydisperse aerosols were generated from solutions of AS, NaCl, and DOS to further examine the robustness of the literature angular truncation correction for a wide range of particle shapes, submicron sizes, and refractive indexes (RI). By varying either solute concentration or atomizer flow settings, we produced σsp signal levels from ∼5 Mm−1 to 800 Mm−1. The å values (Equation [1]) varied from 0.35 to 1.65 for DOS, 1.15 to 3.15 for NaCl, and 1.05 to 3.15 for AS. shows the comparison between the σsp submicron correction factor for the nominal 550 nm σsp coefficients obtained (a) using the literature AO98 scheme plus wavelength conversion (hereafter Cλ,AO98) and (b) as ratio of the experimental 532 nm σep to 550 nm σsp plus wavelength conversion (hereafter Cλ,EXP). Both Cλ,AO98 and Cλ,EXP are plotted as a function of å. The fit to the experimental points, Cλ,EXP= 1.1536–0.007å (dashed line) is in good agreement with the AO98-based expression, Cλ,AO98= 1.1542–0.003å (solid line). Few outliers, mostly NaCl data, can explain the small observed discrepancy. These results confirm that the AO98 correction for TSI nephelometer angular non-idealities is satisfying in the case of polydisperse, non-absorbing, submicron dry aerosols of different shape, size and RI. Following such normalization to the CRD using non-absorbing aerosols, the 1-σ uncertainty obtained for the σsp coefficients corrected with AO98 and converted to 532 nm is δσsp= 3.0%.
3.2. Absorbing Polydisperse Aerosols and Mixtures
The effectiveness of the AO98 angular truncation correction was tested for absorbing aerosols generated as solutions of polydisperse pure compounds as well as their external and internal mixtures. For practical purposes, we report only the results from internal mixtures AS/NSN, SUCCINIC/NSN, ADIPIC/NSN, AS/HUMIC, and MIXPO. These mixtures provided a range of ω values from 0.39 to 0.999. As before, the nephelometer σsp coefficients were corrected using the AO98 scheme and converted to 532 nm according to Equation (Equation1).
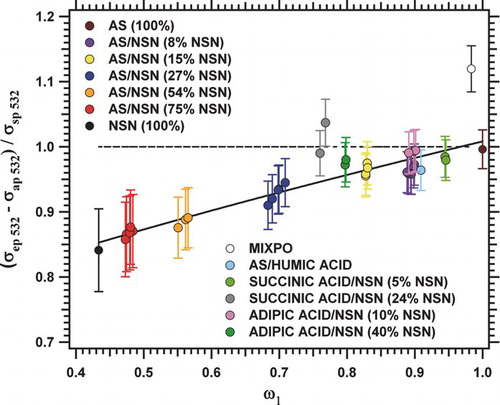
The results are summarized in , where the parameter R= (σep–σap)/σsp (i.e., the ratio of scattering obtained by difference of extinction minus absorption and scattering directly measured by nephelometer) is reported as a function of ω1. R highlights the level of instrument agreement between estimates of the σsp coefficient obtained directly and indirectly (difference method). In the absence of instrumental biases R should be always equal to 1. We observe instead a deviation from the ideal behavior, with R values decreasing as particle albedo decreases as evidenced by the exponential fit through the experimental points (solid black line). The error bars show that for ω1< 0.7 the discrepancy exceeds the experimental uncertainty determined by propagating the errors used for the optical coefficients i.e., δσep= 1%, δσsp= 3%, and δσap= 5%. Given the reasonable assumption of no artifacts in the CRD and PAS measurements, the R< 1 values suggest that the nephelometer values (already corrected following AO98) are too high of roughly 25, 15, 10, 4, and 2% for ω values of 0.4, 0.5, 0.6, 0.7, and 0.8, respectively.
FIG. 3 Ratio (R) of scattering values obtained by difference (σep minus σap) and directly measured by TSI nephelometer (σsp) plotted as a function of ω1. Data are for AS/NSN internal mixtures. The σsp coefficients are corrected using the AO98 scheme and converted to 532 nm. Error bars are calculated by propagating the absolute uncertainties of the optical coefficients (δσep= 1%; δσap= 5%; δσsp= 3% following normalization with the CRD).
We investigated potential sources of biases in the nephelometric σsp measurements. From the raw experimental σsp data, we recalculated the correction term C for each test aerosol, following the AO98 procedure (note that differently from Cλ, the term C does not include the wavelength conversion). We find that our C values increase proportionally with the absorbing fraction (C= 1.1 for AS, NaCl, DOS, and ORG; C= 1.2 for NSN) as opposed to the constant C value of approximately 1.1 as provided by AO98 for all submicron sizes. We also explored the dependence of the å values on ω, since å is used to calculate C in the AO98 correction. Comparison of the å values of non-absorbing and absorbing particles with the same number median diameter dp showed that å did not change significantly with ω.
To further investigate these results, Mie theory calculations were performed for obtaining theoretical ω values of the internal AS/NSN mixtures (hereafter ωMie) to compare with the experimental ω1, ω2, and ω3 values. To perform such calculations, we needed to estimate complex RI for each mixture (RImixture), and we adopted the volume linear mixing rule described by CitationBohren and Huffman (1983) to do so. This rule assumes that particles are homogeneously mixed and that contribution of each component depends on its volume fraction in the mixture,
where Mi, ρi, and Mi are the concentration, density, and RI of the i component (Schkolnik et al. 2007). In our case, the RI values of the single components are reported in literature, 1.53 + 0.0i for AS, and 1.7 + 0.3i (CitationLack et al. 2006) for NSN. The Mi values were computed based on the NSN percentages, i.e., 8, 15, 27, 54, and 75%. The density of AS is ρ = 1.77 g/cm3. The density of NSN is not published; we measured a ρ of 1.37 ± 0.2 g/cm3 for a macroscale NSN sample. The RImixture values obtained from these calculations are reported in .
TABLE 2 Input parameters for Mie code calculations to estimate ω values for the internally mixed AS/NSN particles. From left to right columns are: NSN percentage in the mixture; RI calculated by the linear mixing rule (Equation [3]); size calculated for the internally mixed particles; single scattering albedo values from Mie code (ωMie); and the experimental ω data, i.e., ω1, ω2, and ω3
shows ω1, ω2, ω3, and ωMie as a function of the mass percentage of AS in the mixture (0 to 100%). We find that ωMie is lower than all the experimental ω values particularly for mixtures with 46, 73, and 85% AS (or 54, 27, and 15% NSN), with the only exception for pure AS and NSN. For pure NSN, ωMie is in good agreement with ω1 but not with ω2 and ω3, ω2 and ω3 being higher than predicted by Mie theory. We investigated such mismatch observed between experimental and theoretical ω for the internal AS/NSN mixtures. Tests performed on both ρ and RI values for AS and NSN as well as on the size distribution parameters used in the computations show that the observed discrepancies cannot be explained by Mie calculations sensitivity to these terms. The difficulty in simulating the observations may be due to inadequate assumptions of complete, homogeneous mixing of the absorbing and non-absorbing components that in turn might provide inadequate RImixture values. Other commonly used mixing rules (e.g., Maxwell-Garnett, molar refraction and absorption, extended effective medium approximation or EEMA) produced similar RImixture values. Contrasting evidence exist on the validity of such methods: early studies have indicated that the volume mixing rule might be less adequate compared to, e.g., the Maxwell-Garnett scheme (Chylek et al. 1998) whereas other comparisons of measured and modeled optical properties of internally mixed absorbing and non-absorbing components (e.g., Abo-Riziq et al. 2006) have shown that all mixing rules are unable to produce model-measurement agreement, and that the level of agreement depends on the percentage of absorbing matter.
FIG. 4 Experimental (ω1, ω2, ω3) and theoretical (ωMie) single scattering albedo values for internal mixtures AS/NSN, reported versus the mass percentage of AS in the mixture.
4. DISCUSSION
4.1. TSI Nephelometer Truncation for Absorbing Particles
New correction factors for spherical particles in the TSI 3563 nephelometer were calculated using Mie theory. To match the range of RI values of the experimental data, the values used in the calculations for the real part of the refractive indices (n) were 1.33, 1.38, 1.43, 1.48, 1.53, 1.59, and 1.7; for the imaginary part of the refractive index (k) we chose 0.0, 0.001, 0.002, 0.005, 0.1, and 0.3. This is a much larger range of (n, k) values compared to those previously used to determine the AO98 correction scheme, which was obtained for almost purely scattering aerosols using 1.40 ⩽n⩽ 1.52 for the real part and 0.0 ⩽k⩽ 0.01 for the imaginary part. Our calculations were done at the actual nephelometer center wavelengths of 453, 554, and 698 nm using the full angular response rather than a nominal 0–7 degree forward truncation (CitationAnderson and Ogren 1998; T. Anderson, private communication, 2008). The nephelometer response accounted for the factor of 1.022 that arises from including the truncation error of Rayleigh scattering in the calibration procedure. We calculated the nephelometer response to 52 size distributions with logarithmically spaced number median diameters between 70 nm and 2 μm and σg of 1.6 (for 26 distributions) and 2.2 (for the others 26 distributions). The nephelometer response to the same size distributions was also calculated with a nominal 1 μm aerodynamic diameter impactor, modeled as a hyperbolic tangent function with 50% geometric diameter cut point at 0.85 μm and 10% and 90% transmission 0.05 μm above and below the cut point. The impactor cut point was moved to 0.9 μm for cases with n of 1.38 because in the atmosphere these would correspond to wet particles with lower density (and lower n) compared to the dry case. Size distributions with a median diameter larger than 0.75 μm were eliminated from the simulated sub 1 μm impactor subset because of the skewed distributions that result from convolving a large median diameter with the impactor cut at 0.85 μm. Some of the less atmospherically relevant regimes were also eliminated from the RI matrix; for example, wet particles with n of 1.38 were considered to have maximum k of 0.01, whereas particles with n> 1.59 were considered to have some absorbing material in them, i.e., a k value of at least 0.05.
shows the correction factors C calculated for the full angular response at 554 nm with and without sub-1 micron impactor, color coded by both n and ω. The C values are reported as a function of å calculated between the nominal 450 nm and 700 nm wavelengths. The spread of the C values shows that for each å (i.e., particle size) more than one C value can exist depending on the complex RI (i.e., particle composition). Comparisons of and (submicron case) shows that the variation of C with n (5a) is stronger than with ω (5b). The NSN particles have low values of C mostly because of their high n. The curvature as a function of å is determined by their absorbing nature (k). Common atmospheric absorbers such as soot also have very high n values, so their behavior will be qualitatively similar to NSN.
FIG. 5 TSI 3563 nephelometer correction factors C calculated using Mie theory for various RI values, for submicron aerosols (panels a and b) and for sizes up to 2 μm (panels c and d). Points are color coded either by n (panels a and c) or ω (panels b and d). The thin solid lines of panel a show a correction calculated as a function of n only. The dashed line is the C from AO98; the solid lines are the C values from Equations (Equation4) and (Equation5
). Circles are calculations for NSN (n= 1.7, k=0.3).
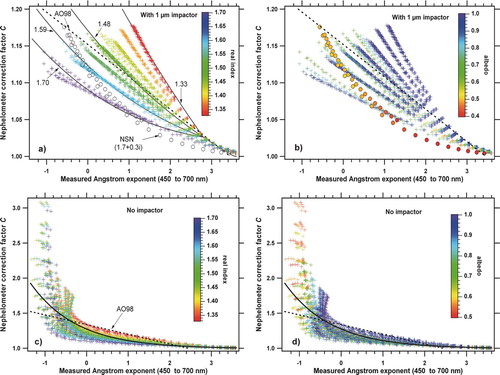
In , the thin solid lines show a correction calculated as a function of n for situations where there is independent information available about n. This correction is given by
where C'(n) is an optional correction for submicron distributions. C'(n) is equal to 0 for å ⩾2.8, and to
for å < 2.8. The ν1, ν2, and ν3 coefficients are given in for the nephelometer center wavelengths of 453, 554, and 698 nm for situations with and without submicron impactor. The dashed black line is the AO98 expression. For cases where RI is unknown, these calculations confirm that AO98 is a very good approximation for the common atmospheric situation with n≈ 1.5 for submicron aerosols.
and show the C values calculated for the full distribution up to 2 μm. For coarse particles, no single expression can reduce the nephelometer truncation errors to less than about 0.1 due to the strong curvature of C at å < 0. For situations where a nephelometer is used without an impactor the solid black curves on and are fits weighted toward the less absorbing particles given by Equation (Equation4) for C′ (n) = 0. Therefore, this expression does not account for the effect of n on C for supermicron aerosols.
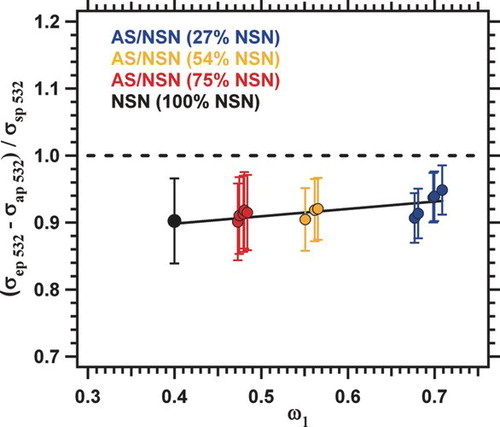
We tested these new C values calculated from Mie theory on the experimental submicron data. shows the R values for AS/NSN mixtures with NSN amounts of 27, 54, 75, and 100% (i.e., the mixtures with ω< 0.7) obtained with the experimental σsp data now calculated using the C values from Equations (Equation4) and (Equation5
). There is an improvement in the scattering closure (cf. ), especially for the AS/NSN mixtures with 75% and 100% NSN. This is notable because the only change to C is to make it a function of n; no correction for k (i.e., ω) is included in C.
FIG. 6 Ratio (R) of scattering values obtained by difference (σep minus σap) and directly measured by TSI nephelometer (σsp) plotted as a function of ω1 for the AS/NSN mixtures with 27%, 54%, 75%, and 100% NSN. Theσsp coefficients are corrected using the real-refractive index dependent correction term C from Equations (Equation4) and (Equation5
).
After these corrections were calculated, we became aware of a parallel set of nephelometer corrections (CitationBond et al. 2009). They point out the possibility of using size distributions to improve TSI nephelometer measurements whereas we show the importance of the real part of the refractive index for determining accurate C values. We emphasize that C is not the truncation error per se but rather the correction for truncation error as a function of å. The imaginary part of the refractive index k does also affect truncation errors (CitationMoosmuller and Arnott 2003). However, we find that for submicron particles the relationship between truncation and Angstrom exponent is a stronger and much more systematic function of the real index than the imaginary index.
4.2. Truncation Corrections for TSI Nephelometer Measurements at High Relative Humidity
The refractive-index-dependent truncation correction affects the accuracy of estimates of the RH dependence of light scattering fσsp(RH) by a TSI 3563 nephelometer. In principle, a humidified particle will have lower n than when measured dry, because of the low n of water (≈1.33). As particles grow, the truncation corrections become larger not only because the particles are larger in size, as is commonly accounted for in AO98, but also because their RI decreases. This would tend to increase the measured fσsp(RH) values compared to making no correction for RI.
As an example, we can consider a lognormal aerosol distribution with number median diameter of 150 nm and a geometric standard deviation of 1.6. If the initial RI is n= 1.5, k= 0.002 and all particles grow under increased RH by a diameter factor of 1.5, then using a volume mixing rule the final RI would be n= 1.38, k= 0.0006. After a 1 μm impactor the true increase in scattering fσsp(RH) is a factor of 2.94. Because of increased truncation errors from the larger particles, the nephelometer would measure a factor of 2.82, or 96% of the correct value. The å value would decrease from 2.01 to 1.59. Using the AO98 equation for truncation, the fσsp(RH) factor would be corrected to 98% of the true value. Using Equation (Equation4) for both truncation and index of refraction, fσsp(RH) would be corrected to within 0.2% of the true value. However, the 2% error from AO98 is within the experimental error for realistic accuracy of the humidity control.
4.3. Uncertainty in Scattering in TSI Nephelometer and in Single Scattering Albedo Estimates
The uncertainty in the σsp coefficients was recalculated on the basis of the experimental results. shows the percentage uncertainty of the σsp coefficient corrected with AO98 (δσsp) plotted as a function of ω. The δσsp points are best fitted through a power function
where y0= 3.0%. For ω> 0.8, the δσsp is equal to 3.0%. For lower ω, the uncertainties are much higher and reach ∼30% at ω=0.4. We use these new δσsp values to calculate the percentage uncertainties in ω calculated by combining CRD and TSI nephelometer measurements. shows estimates of both δω1 from CRD and PAS (circles) and δω2 from CRD and TSI nephelometer (triangles) obtained using δσep= 1%, δσsp= 3.0 + 210(–4.88*ω) from (6) and δσap= 5%. Compared to early ω uncertainty analysis based on normalization of the TSI nephelometer to the CRD for which δσsp is held constant (CitationBaynard et al. 2007), these δω2 values are much higher. The δω1 values, derived from CRD and PAS, are <5% throughout most of the ω spectrum and reach 9% for ω⩽ 0.4. At this ω value, δω1 is still three times lower than δω2. Both δσsp and δω2 can be reduced up to 10% if the real refractive-index-dependent truncation expression is applied (squares in and , respectively); even so, the ω1 from CRD and PAS still provides the lowest uncertainty over the entire ω range, giving more accurate estimates of ω than the values calculated from the CRD and TSI nephelometer.
FIG. 7 (a) Percentage uncertainty inσsp from TSI nephelometer (δσsp) calculated using the AO98 scheme (triangles) and corrected using Equations (Equation4) and (Equation5
) (squares), and (b) percentage uncertainties of single scattering albedo δω1 (CRD and PAS) and δω2 (CRD and TSI nephelometer). δω1 is calculated using δσep= 1% and δσap = 5%. δω2 is calculated combining δσep=1% with either δσsp AO98 (triangles) or δσsp Equations (Equation4
) and (Equation5
) (squares).
The implications of these findings are significant considering the widespread use of nephelometry for climate studies (e.g., CitationQuinn et al. 2004; CitationDoherty et al. 2005; CitationSierau et al. 2006) and air quality assessment applications (e.g., CitationHand and Malm 2007). Furthermore, the nephelometer is often combined with absorption measurement techniques such as PSAP, which are highly uncertain (CitationLack et al. 2008; CitationCappa et al. 2008). The refractive-index-dependent truncation expression proposed in this study improves upon AO98 equation for applications where the RI of the aerosol is known or can be accurately estimated. For cases where small σsp uncertainties errors are needed, it might be more effective to apply CRD and PAS technologies or physically reducing truncation errors in the nephelometer body, e.g., by adding a forward scattering fiber optic, rather than refining the nephelometer correction factors. In fact, recent instrument developments (Sanford et al. 2009) have shown that significant improvements in correcting angular non-idealities in optical cavities can be obtained from even modest and imperfect information about light scattered within 8 degrees in the forward direction.
Extinction techniques (which have trivial angular truncation errors compared to the nephelometer) currently appear as the best way to measure the optical properties coarse mode aerosol particles, e.g., mineral dust, which are important for climate and air quality issues. One remaining problem with this approach is separating out the absorption component of the extinction, which could be done by direct absorption measurements rather than estimating the coarse mode absorption as the difference of extinction and nephelometer-determined scattering. However both PAS and filter based absorption techniques may have biases for measurements of coarse mode absorption. For the PAS technique, loss of sensitivity due to internal heat equilibration of particles (CitationRaspet et al. 2003) could become problematic, while filter based techniques appear to underestimate absorption by particles larger than 400 nm (CitationLack et al. 2009).
5. SUMMARY AND CONCLUSIONS
We designed a laboratory study to evaluate the performance and current uncertainties of instruments for optical property measurements. Single scattering albedo values ω obtained from different instrument combinations were compared for a wide range of polydisperse laboratory-generated aerosols with absorbing and non-absorbing components. The experimental data revealed a clear trend toward increasing discrepancies between the determined ω values as particle ω decreased. We find that for aerosols with ω< 0.7 the discrepancies between ω values were larger than that expected based on the adopted instrument uncertainties. The data indicate the existence of uncorrected biases in the scattering measurements by nephelometers. Re-evaluation of the nephelometer correction factors based upon Mie theory confirms that the AO98 expressions for correcting nephelometer truncation errors are not effective for highly absorbing particles; surprisingly, this is mostly due to the high real index n of absorbing materials. We have determined new corrections for the TSI nephelometer for cases when the refractive index RI is known, and have shown that the new refractive-index-dependent truncation expression is effective in improving the instrument closure with laboratory-generated submicron aerosols. However, the applicability of such correction expression will have limitations if the RI of the bulk aerosol can only be approximately known. The large and highly variable correction factors found for supermicron particles confirms that the nephelometer is not suited for precisely measuring the scattering from such aerosols (CitationAnderson et al. 1996; CitationMoosmuller and Arnott 2003; CitationMarshall et al. 2005). Determination of hygroscopic growth using nephelometers is also affected by these results; even though the RI values of the ambient aerosols are not known precisely, a variable C value would have to be used for hygroscopic growth experiments since most wet particles will have systematically lower n than when measured dry.
We define more realistic error boundaries for ω values determined using the extinction from CRD combined with the nephelometer data corrected following the AO98 scheme. Compared to previous estimates, uncertainties in ω using nephelometer data are larger and are most significant for ω< 0.7; this will be important for particular episodes or specific measurement environments, such as fresh combustion or biomass burning plumes. In general, any aerosol characteristic that changes the ratio of forward to total scattering relative to that from ideal laboratory aerosols (e.g., non spherical and coarse particles) will only increase uncertainty in ω estimates derived from nephelometry.
Acknowledgments
This work was funded by the NOAA Climate Program. Drs. Adam Wollny, John Ogren, and Tad Anderson provided helpful discussions. Dr. Ranajit Talukhdar helped prepare laboratory aerosol samples.
Notes
Notes
1 Certain commercial equipment, instruments, or materials are identified in this article in order to adequately specify the experimental procedure. Such identification does not imply recognition or endorsement by the National Oceanic and Atmospheric Administration, nor does it imply that the material or equipment identified are necessarily the best available for the purpose.
REFERENCES
- Abo Riziq A.Erlick C.Dinar E.Rudich Y.Optical Properties of Absorbing and Non-Absorbing Aerosols Retrieved by Cavity Ring Down (CRD) SpectroscopyAtmos. Chem. Phys.200771523–1536
- Abu-Rahmah A.Arnott W. P.Moosmüller H.Integrating Nephelometer with a Low Truncation Angle and an Extended Calibration SchemeMeas. Sci. Technol.2006171723–1732
- Angstrom A.On the Atmospheric Transmission of Sun Radiation and on Dust in the AirGeografika Ann.192911156–166
- Anderson T. L.Covert D. S.Marshall S. F.Laucks M. L.Charlson R. J.Waggoner A. P.Ogren J. A.Caldow R.Holm R. L.Quant F. R.Sem G. J.Wiedensohler A.Ahlquist N. A.Bates T. S.Performance Characteristics of a High-Sensitivity, Three-Wavelength, Total Scatter/Backscatter NephelometerJ. Atmos. Oceanic Technol.199613967–986
- Anderson T. L.Ogren J. A.Determining Aerosol Radiative Properties Using the TSI 3563 Integrating NephelometerAerosol Sci. Technol.19982957–69
- Arnott W. P.Moosmuller H.Rogers C. F.Jin T. F.Bruch R.Photoacoustic Spectrometer for Measuring Light Absorption by Aerosol: Instrument DescriptionAtmos. Environ.199933172845–2852
- Baynard T.Pettersson A.Lovejoy E. R.Brown S. S.Lack D. A.Massoli P.Osthoff H.Ciciora S.Dube W. P.Ravishankara A. R.Design and Application of a Pulsed Cavity Ring-Down Aerosol Extinction Spectrometer for Field MeasurementsAerosol Sci. Technol.2007414447–462
- Bohren C. F.Huffman D. R.Absorption and Scattering of Light by Small ParticlesJohn Wiley and SonsNew York1983
- Bond T. C.Anderson T. L.Campbell D.Calibration and Inter-Comparison of Filter-Based Measurements of Visible Light Absorption by AerosolsAerosol Sci. Technol.1999306582–600
- Bond T. C.Covert D. S.Müller T.Truncation and Angular Scattering Corrections for Absorbing Aerosols in the TSI 3563 NephelometerAerosol Sci. Technol.2009439866–871
- Cappa C. D.Lack D. A.Burkholder J. B.Ravishankara A. R.Bias in Filter-Based Aerosol Light Absorption Measurements Due to Organic Aerosol Loading: Evidence from Laboratory MeasurementsAerosol Sci. Technol.200842121022–1032 doi: 10.1080/02786820802389285
- Chýlek P. et al.Scattering of Electromagnetic Waves by Composite Spherical Particles: Experiment and Effective Medium ApproximationsAppl. Opt.198827122396–2404
- Collison W. E.Inhalation Therapy TechniqueHeinemanLondon193577
- Doherty S. J.Quinn P. K.Jefferson A.Carrico C.Anderson T. L.Hegg D.A Comparison and Summary of Aerosol Optical Properties as Observed In-situ from Aircraft, Ship and Land During ACE-AsiaJ. Geophys. Res.2005110D4 doi: 10.1029/2004JD004964
- Hallar A. G. et al.Atmospheric Radiation Measurements Aerosol Intensive Operating Period: Comparison of Aerosol Scattering During Coordinated FlightsJ. Geophys. Res.2006111D05S09 doi: 10.1029/2005JD006250
- Hand J. L.Malm W. C.Review of Aerosol Mass Scattering Efficiencies from Ground-Based Measurements Since 1990J. Geophys. Res.2007112D16203 doi: 10.1029/2007JD008484
- Heintzenberg J.Charlson R. J.Design and Applications of the Integrating Nephelometer: A ReviewJ. Atmos. Oceanic Technol.199613987–1000
- Heintzenberg J.Erfurt G.Modification of a Commercial Integrating Nephelometer for Outdoor MeasurementsJ. Atmos. Oceanic Technol.200017121645–1650 doi: 10.1175/1520-0426(2000)017
- Heintzenberg J.Wiedensohler A.Tuch T. M.Covert D. S.Sheridan P. J.Ogren J. A.Gras J.Nessler R.Kleefeld C.Kalivitis N.Aaltonen V.Wilhelm R. T.Havlicek M.Intercomparisons and Aerosol Calibrations of 12 Commercial Integrating Nephelometers of Three ManufacturersJ. Atmos. Oceanic Technol.2006237902–914
- IPCCClimate Change: The Physical Science Basis—Contribution of Working Group I to the fourth assessment report of the Intergovernmental Panel on Climate ChangeCambridge University PressCambridge2007996
- Lack D.Lovejoy E. R.Baynard T.Pettersson A.Ravishankara A. R.Aerosol Absorption Measurement Using Photoacoustic Absorption Spectroscopy: Sensitivity, Calibration and Uncertainty DevelopmentsAerosol Sci. Technol.2006409697–708
- Lack D. A.Cappa C. D.Covert D. S.Baynard T.Massoli P.Sierau B.Bates T. S.Quinn P. K.Lovejoy E. R.Ravishankara A. R.Bias in Filter-Based Aerosol Light Absorption Measurements due to Organic Aerosol Loading: Evidence from Ambient MeasurementsAerosol Sci. Technol.200842121033–1041 DOI:10.1080/02786820802389277.
- Lack D. A.Cappa C. D.Cross E. S.Massoli P.Ahern A.Davidovits P.Onasch T. B.Absorption Enhancement of Coated Absorbing Aerosols: Validation of the Photo-Acoustic Technique for Measuring the EnhancementAerosol Sci. Technol.2009 accepted
- Marshall J.Lohmann U.Leaitch R. W.Shantz N.Phinney L.Toom-Sauntry D.Sharma S.Optical Properties of Aerosol Particles Over the Northern PacificJ. Appl. Met.2005441206–1220
- Moosmuller H.Arnott W. P.Angular Truncation Errors in Integrating NephelometryRev. Sci. Instrum.20037473492–3501
- Müller T. et al.Angular Illumination and Truncation of Three Different Integrating Nephelometers: Implications for Empirical, Size-Based CorrectionsAerosol Sci. Tech.200943581–586
- Pettersson A.Lovejoy E. R.Brock C. A.Brown S. S.Ravishankara A. R.Measurement of Aerosol Optical Extinction at 532 nm with Pulsed Cavity Ring-Down SpectroscopyJ. Aerosol. Sci.200435995–1011 doi: 10.1016/j.jaerosci.2004.02.008.
- Quinn P. K.Anderson T. L.Bates T. S.Dlugi R.Heintzenberg J.von Hoyingen-Huene W.Kulmala M.Russell P. B.Sweitlicki E.Closure in Tropospheric Research: A Review and Future NeedsContr. Atmos. Phys. Beitr.199669547–577
- Quinn P. K.Coffman D. J.Bates T. S.Welton E. J.Covert D. S.Miller T. L.Johnson J. E.Maria S.Russell L.Arimoto R.Carrico C. M.Rood M. J.Anderson J.Aerosol Optical Properties Measured Aboard the Ronald H. Brown During ACE-Asia as a Function of Aerosol Chemical Composition and Source RegionJ. Geophys. Res.2004109D19 doi: 10.1029/2003JD004010
- Raspet R.Slaton W. V.Arnott W. P.Mossmüller H.Evaporation–Condensation Effects on Resonant Photoacoustics of Volatile AerosolsJ. Atmos. Oceanic Technol.200320685–695
- Sanford T. J.Murphy D. M.Thomson D. S.Fox R. W.Albedo Measurements and Optical Sizing of Single Aerosol ParticlesAerosol Sci. Technol.200842958–969
- Sierau B.Covert D. S.Coffman D. J.Quinn P. K.Bates T. S.Aerosol Optical Properties During the 2004 New England Air Quality Study-Intercontinental Transport and Chemical Transformation: Gulf of Maine Surface Measurements—Regional and Case StudiesJ. Geophys. Res.2006111D23S37 doi: 10.1029/2006JD007568
- Sheridan P. J.Arnott W. P.Ogren J. A.Andrews E.Atkinson D. B.Covert D. S.Moosmüller H.Petzold A.Schmid B.Strawa A. W.Varma R.Virkkula A.The Reno Aerosol Optics Study: An Evaluation of Aerosol Absorption Measurement MethodsAerosol Sci. Technol.20053911–16
- Schkolnik G.Chand D.Hoffer A.Andreae M. O.Erlick C.Swietlicki E.Rudich Y.Constraining the Density and Complex Refractive Index of Elemental and Organic Carbon in Biomass Burning Aerosol Using Optical and Chemical MeasurementsAtmos. Environ.20064151107–1118
- Schwartz S. E.Uncertainty Requirements in Radiative Forcing of Climate ChangeJ. of Air and Waste Management Assoc.200454111351
- Strawa A. W.Castaneda R.Owano T.Baer D. S.Paldus B. A.The Measurement of Aerosol Optical Properties Using Continuous Wave Cavity Ring-Down TechniquesJ. Atmos. Oceanic Technol.2003204454–465
- Svenningsson B.Rissler J.Swietlicki E.Mircea M.Bilde M.Facchini M. C.Decesari S.Fuzzi S.Zhou J.Mønster J.Rosenørn T.Hygroscopic Growth and Critical Supersaturations for Mixed Aerosol Particles of Inorganic and Organic Compounds of Atmospheric RelevanceAtmos. Chem. Phys.200661937–1952
- Varma R.Moosmüller H.Arnott W. P.Toward an Ideal Integrating NephelometerOpt. Lett.200328121007–1009
- Weingartner E.Saathoff H.Schnaiter M.Streit N.Bitnar B.Baltensperger U.Absorption of Light by Soot Particles: Determination of the Absorption Coefficient by Means of AethalometersJ. Aerosol Sci.2003341445–1463