ABSTRACT
The calibration of photoacoustic aerosol optical absorption measurements through simultaneous photoacoustic spectroscopy of the oxygen A-band absorption is demonstrated. While aerosol absorption shows no sharp spectral structures for size-distributed aerosols, the molecular oxygen A-band has sharp absorption lines in the near-infrared (i.e., 760–770 nm) spectral region. Line-strength, shape, and broadening of these lines are well known and molecular oxygen is ubiquitous with a constant concentration in the troposphere. Simultaneous photoacoustic spectroscopy of aerosol and molecular oxygen A-band absorption with a tunable, external cavity diode laser yields a convenient calibration for the photoacoustic measurement of aerosol absorption coefficients without the need for pressurized and potentially toxic calibration gases.
INTRODUCTION
Light absorption by particles suspended in the atmosphere modifies the transfer of solar energy in the atmosphere and thereby influences global and regional climate change (CitationRamanathan and Carmichael 2008) and atmospheric visibility (CitationWatson 2002). In addition, the measurement of particle light absorption can be used for the real-time characterization of black carbon mass concentrations and emission rates, for example from combustion processes such as biomass burning or internal combustion engines (CitationChen et al. 2006, Citation2007; CitationMoosmüller et al. 2001a, b).
The measurement of particle light absorption (CitationMoosmüller et al. 2009) has traditionally been achieved by depositing particles on a highly scattering filter substrate (e.g., quartz fiber filter) and measuring the optical transmission through the filter before and after deposition. Unfortunately, such measurements suffer from a number of artifacts due to the interaction of filter and particle scattering and absorption and their dynamic range is rather limited (CitationArnott et al. 2005; CitationBond et al. 1999; CitationLack et al. 2008; CitationSubramanian et al. 2007). While some of these shortcomings can be reduced by also monitoring the light scattering or by suppressing light scattering from the filter substrate (CitationBallach et al. 2001; CitationPetzold et al. 2005), the more direct measurement of particle light absorption by the photoacoustic method has largely been accepted as preferential first-principle method (CitationMoosmüller et al. 2009; CitationSheridan et al. 2005).
Calibration of the photoacoustic method can be achieved by using a medium with a well known absorption coefficient or by determining a very large gaseous absorption through simultaneous extinction measurement (CitationArnott et al. 2000). In addition, light absorption in the Chappuis band of ozone (CitationBrion et al. 1998) at 532 nm has been used for photoacoustic calibration in conjunction with measurement of this absorption with a cavity ring-down system (CitationLack et al. 2006). Ozone can readily be generated with absorption coefficients covering the relevant photoacoustic measurement range and the calibration system can likely be simplified by utilizing a commercial ozone monitor and published ozone absorption cross-sections (CitationBrion et al. 1998) instead of the cavity ring-down system (CitationLack et al. 2006).
Here, we present a simultaneous measurement of aerosol and molecular oxygen A-band absorption in the near infrared spectral region (i.e., 760–770 nm) with a commercial, tunable, external cavity diode laser. Previous diode laser spectroscopy of the oxygen A-band spectrum includes photoacoustic absorption spectroscopy using a cantilever enhanced technique (CitationCattaneo et al. 2006), extinction spectroscopy in an optical multi-pass cell (CitationAnderson and Brecha 2007; CitationNguyen et al. 1994) and high accuracy cavity ring-down spectroscopy (CitationRobichaud 2008; CitationRobichaud et al. 2008a; CitationRobichaud et al. 2008b). The atmospheric oxygen concentration is well known (i.e., 20.95% by volume (CitationSeinfeld and Pandis 1998)) and constant in the homosphere (i.e., below ≈100 km altitude) and the atmospheric density can easily be calculated from temperature and pressure. Therefore, a calculation of the oxygen absorption spectrum (CitationGordley et al. 1994; CitationRothman et al. 2005) can be used to calibrate the measurement of aerosol absorption with the simultaneously acquired oxygen-in-air absorption spectrum without the need for large concentrations of toxic calibration gases (e.g., nitrogen dioxide) that also tend to stick in trace quantities to the photoacoustic equipment (CitationArnott et al. 2000). This technique can also be adapted for the calibration of other in situ techniques for the measurement of aerosol light absorption including refractive index-based techniques (CitationSedlacek and Lee 2007) and extinction-minus-scattering techniques (CitationGerber 1979).
EXPERIMENTAL SETUP
The experimental setup, which consists of a power and wavelength modulated light source, a photoacoustic resonator, and data acquisition electronics and computer, is shown in .
FIG. 1 Schematic diagram of the photoacoustic system, including tunable diode laser, chopper, photoacoustic resonator with microphone and piezoelectric transducer, photodetector, two lock-in amplifiers, and personal computer (PC). Both wavelength modulation (WM) and power modulation (PM) of the laser light are used for lock-in detection of the absorption signals.
Power and Wavelength Modulated Light Source
The tunable, external cavity diode laser (New Focus™ TLB-6312 Velocity® Laser System) has a Littman-type cavity with a laser diode as gain element (CitationHarvey and Myatt 1991). This arrangement results in single-mode, mode hop-free tuning over the whole tuning range of 760 to 770 nm, a linewidth of less than 300 kHz over 50 ms, and 15 to 20 mW of laser power depending on output wavelength. A similar New Focus external cavity laser has previously been used for wavelength modulated extinction spectroscopy of the oxygen A-band in a 22 m path length multipass cell (CitationNguyen et al. 1994).
For wavelength modulation (WM) spectroscopy (CitationBomse et al. 1992), the laser output is wavelength modulated with the piezo-electric transducer on the cavity mirror and for power modulation (PM) spectroscopy, the laser beam power is modulated with an external optical chopper (New Focus™ Optical Chopper 3501). For photoacoustic spectroscopy, the modulation frequencies are chosen near the resonance frequency of the acoustical resonator around 1.5 kHz. The modulated beam passes through the photoacoustic acoustic resonator () and an optical power meter terminating the beam monitors its average power.
FIG. 2 Schematic diagram of the photoacoustic resonator including microphone and mounting surrounds, scattering detector, piezoelectric transducer, laser, and photo-detector.
Photoacoustic Resonator
A U-shaped, full wavelength, plane wave, longitudinal mode photoacoustic resonator () is commonly used to measure aerosol optical properties (CitationArnott et al. 1999; CitationMoosmüller et al. 2009). The microphone and piezoelectric transducer are located at pressure antinodes with resonator holes located at pressure nodes to allow for sample air and laser beams to enter and exit. A critical orifice is used to set the sample flow rate and to exclude pump noise from the instrument. To be able to sample from a plenum at pressure substantially lower than ambient, a pressure equilibration capillary keeps both sides of the condenser microphone at identical static pressure, thereby assuring constant microphone sensitivity independent of sample pressure. A scattering sensor in the middle part of the resonator allows for reciprocal nephelometer measurements of aerosol light scattering (CitationAbu-Rahmah et al. 2006). A Helmholtz resonator is used as a side branch of the sample inlet to reflect low frequency sound from the inlet and detuning tubes act as band stop filters at the operating frequency to reflect unwanted sound from the coupling regions away from the main resonator region, especially coherent sounds created by light absorption of particles on the resonator window. The piezoelectric transducer is used periodically to determine the resonator resonance frequency and quality factor needed for data analysis, and to determine the peak acoustic pressure at resonance. The production of sound by the photoacoustic method occurs in the horizontal part of the resonator section where the laser beam overlaps with sample air near and at the pressure anti-node located at the center of this section. Multiple laser beams can be overlapped with dichroic beam splitters to simultaneously measure absorption at multiple wavelengths (CitationLewis et al. 2008).
Signal Detection and Analysis
The photoacoustic system can be used with simultaneous power modulation (PM) and wavelength modulation (WM) of the laser beam or with just a single type of modulation. If only one type of modulation is used, the modulation frequency is set to the resonance frequency of the acoustic resonator (≈1500 Hz), while for simultaneous PM and WM modulation somewhat different (Δ ν ≈ 10 Hz) modulation frequencies within the resonance band of the acoustic resonator are used. Phase sensitive detection of the PM and/or WM signals is achieved by processing the microphone signal with two lock-in amplifiers in parallel (), each locked to one of the modulation frequencies. This arrangement allows for simultaneous measurement of photoacoustic PM and WM spectra. PM spectra show absorption from both aerosol and the oxygen A-band lines while WM spectra show a derivative spectrum (CitationSchilt and Thévenaz 2006) of the narrow oxygen A-band lines with no signal from aerosol absorption due to its weak wavelength dependence.
RESULTS AND DISCUSSION
Soot aerosol from a soot-producing kerosene lamp (CitationSheridan et al. 2005) was drawn into the photoacoustic resonator with a pump. This pump was turned off to assure stable and slowly decaying aerosol concentration and light absorption in the resonator and PM and WM spectra were simultaneously recorded while scanning the tunable diode laser from ≈760 nm to ≈770 nm. A spectrum of the complete scan and an enlarged detail including two oxygen lines are shown as lock-in amplifier x-output voltage (i.e., in phase with modulation) versus laser wavelength in .
FIG. 3 Simultaneously measured PM (upper spectrum) and WM (lower spectrum) photoacoustic soot aerosol absorption spectra. Details are shown on the right for two oxygen lines.
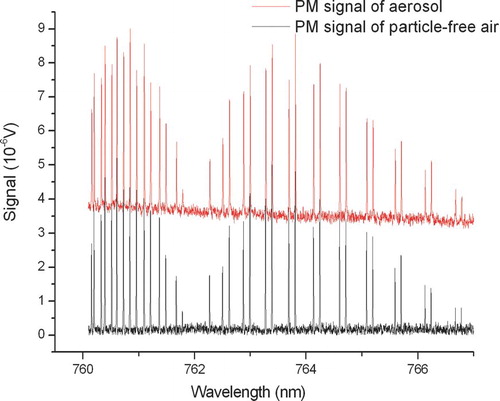
The WM spectrum consists of a ≈0 V baseline and the derivative of the oxygen absorption lines, typical for 1st harmonic WM spectroscopy. The WM spectrum is not influenced by the introduction of strongly absorbing aerosol as the soot aerosol absorption is inversely proportional to wavelength (CitationSheridan et al. 2005) and has no strongly wavelength dependent features within the scanning range. In contrast, the PM spectrum is a measure of the total absorption, the sum of absorption from soot particles and oxygen lines as demonstrated in with a spectrum of particle-free air and a spectrum of soot aerosol. The height of the elevated baseline is proportional to the soot absorption coefficient and the peaks above the baseline record the strongly wavelength dependent oxygen absorption. The slow decay of the elevated baselines in and is due to the slowly decaying aerosol concentration during the 1000 s scan.
FIG. 4 Photoacoustic aerosol absorption spectra of particle-free air (lower spectrum) and of soot aerosol (upper spectrum). (Figure provided in color online.)
To calibrate the photoacoustic measurement of aerosol absorption, the oxygen A-band absorption spectrum is calculated for appropriate temperature, pressure, natural isotope ratios, and ambient oxygen concentration with the Linepak algorithm (CitationGordley et al. 1994) utilizing the 2004 HITRAN database (CitationRothman et al. 2005). The resulting theoretical oxygen spectrum shows excellent agreement with the photoacoustic measurement () after addition of the aerosol absorption baseline, a cubic-spline linearization of the diode laser wavelength scale to account for its offsets and nonlinearities, and the introduction of the oxygen-based calibration factor that converts the signal units of the photoacoustic absorption measurement (e.g., V) to a unit of the absorption coefficient (e.g., m–1).
FIG. 5 Comparison of the calibrated absorption measurement (solid line) with the baseline adjusted theoretical oxygen spectrum (dashed line).
This fit obtains the absolute calibration of photoacoustic aerosol absorption measurements from the well-known line strength (or height) of the oxygen A-band absorption lines as illustrated in .
FIG. 6 Illustration of the calibration technique. The known peak absorption of the oxygen lines above the aerosol absorption baseline is used to calibrate the aerosol absorption.
Using diluted combustion aerosol instead of ambient air for calibration raises the question of how much of the oxygen content has been reduced from ambient values. Using fuel-based emission factors for soot absorption cross-section emitted by a kerosene lamp (CitationChen et al. 2007), we estimate that the oxygen concentration in the strongly absorbing aerosol used for calibration has been reduced by less than 0.1% from ambient values. Another potential concern is the fact that the calibration measurements presented here utilize oxygen lines absorption coefficients of ≈0.02 m–1, comparable with absorption coefficients encountered in combustion emissions (CitationChen et al. 2006), but much larger than those in the ambient atmosphere (CitationHorvath 1993). However, photoacoustic instruments are extremely linear over a large dynamic range and previous calibration methods (CitationArnott et al. 2000) have used even larger absorption coefficients (i.e., ≈0.15 m–1) while demonstrating that the influence of non-linearity is minimal (CitationLack et al. 2006). In addition, much weaker oxygen A-band absorption lines are readily available, especially when the absorption lines of the naturally occurring isotopologues of the oxygen molecule are taken into account (CitationRobichaud 2008; CitationRothman et al. 2009).
While laboratory calibration has been achieved solely with PM, if fast changes of aerosol light absorption are encountered during a calibration, WM would not be influenced by these changes and a calibration could still be performed. In addition, it can be convenient to temporarily lock the laser wavelength to the zero crossing of the WM signal at the peak absorption of an oxygen line and to measure the peak height of this line with PM.
SUMMARY
A novel calibration for photoacoustic aerosol absorption measurements utilizes the well-characterized A-band absorption lines of ubiquitous molecular oxygen for the absolute calibration of aerosol absorption. This technique is much more practical, especially in a field environment, than previous procedures using toxic calibration gases such as nitrogen dioxide or well characterized aerosols. For example, even during a research flight, the instrument calibration can be checked or redone at any time by tuning the laser from a wavelength between the oxygen lines that is used for aerosol absorption measurements to an oxygen line of well-known strength that serves as calibration standard. Within the earth's atmosphere, oxygen is readily available without need for pressurized gases or difficult-to-prepare calibration aerosols.
Acknowledgments
This work has been supported in part by NSF ATM-0340423 and by DOE-ASP DE-FG02-05ER64008. G. Tian acknowledges support from an NSF Nevada EPSCoR student fellowship.
REFERENCES
- Abu-Rahmah A.Arnott W. P.Moosmüller H.Integrating Nephelometer with a Low Truncation Angle and an Extended Calibration SchemeMeas. Sci. Technol.2006171723–1732
- Anderson B.Brecha R. J.Tunable Diode Laser Absorption Measurement of Oxygen A-Band Line StrengthsAppl. Phys. B200787379–385
- Arnott W. P.Hamasha K.Moosmüller H.Sheridan P. J.Ogren J. A.Towards Aerosol Light-Absorption Measurements with a 7-Wavelength Aethalometer: Evaluation with a Photoacoustic Instrument and 3-Wavelength NephelometerAerosol Sci. Tech.20053917–29
- Arnott W. P.Moosmüller H.Rogers C. F.Jin T.Bruch R.Photoacoustic Spectrometer for Measuring Light Absorption by Aerosol: Instrument DescriptionAtmos. Environ.1999332845–2852
- Arnott W. P.Moosmüller H.Walker J. W.Nitrogen Dioxide and Kerosene-Flame Soot Calibration of Photoacoustic Instruments for Measurement of Light Absorption by AerosolsRev. Sci. Instrum.2000714545–4552
- Ballach J.Hitzenberger R.Schultz E.Jaeschke W.Development of an Improved Optical Transmission Technique for Black Carbon (BC) AnalysisAtmos. Environ.2001352089–2100
- Bomse D. S.Stanton A. C.Silver J. A.Frequency Modulation and Wavelength Modulation Spectroscopies: Comparison of Experimental Methods Using a Lead-Salt Diode LaserAppl. Opt.199231718–731
- Bond T. C.Anderson T. L.Campbell D.Calibration and Intercomparison of Filter-Based Measurements of Visible Light Absorption by AerosolsAerosol Sci. Tech.199930582–600
- Brion J.Chakir A.Charbonnier J.Daumont D.Parisse C.Malicet J.Absorption Spectra for the Ozone Molecule in the 350–830 nm RegionJ. Atmos. Chem.199830291–299
- Cattaneo H.Laurila T.Hernberg R.Photoacoustic Detection of Oxygen Using Cantilever Enhanced TechniqueAppl. Phys. B200685337–341
- Chen L.-W. A.Moosmüller H.Arnott W. P.Chow J. C.Watson J. G.Susott R. A.Babbitt R. E.Wold C. E.Lincoln E. N.Hao W. M.Particle Emissions from Laboratory Combustion of Wildland Fuels: In Situ Optical and Mass MeasurementsGeophys. Res. Lett.200633 doi: 10.1029/2005GL024838
- Chen L.-W. A.Moosmüller H.Arnott W. P.Chow J. C.Watson J. G.Susott R. A.Babbitt R. E.Wold C. E.Lincoln E. N.Hao W. M.Emissions from Laboratory Combustion of Wildland Fuels: Emission Factors and Source ProfilesEnviron. Sci. Technol.2007414317–4325
- Gerber H. E.Portable Cell for Simultaneously Measuring the Coefficients of Light Scattering and Extinction for Ambient AerosolsAppl. Opt.1979181009–1014
- Gordley L. L.Marshall B. T.Chu D. A.Linepak-Algorithms for Modeling Spectral Transmittance and RadianceJ. Quant. Spectrosc. Radiat. Transfer199452563–580
- Harvey K. C.Myatt C. J.External-Cavity Diode Laser Using a Grazing-Incidence Diffraction GratingOpt. Lett.199116910–912
- Horvath H.Atmospheric Light Absorption—A ReviewAtmos. Environ.199327A293–317
- Lack D.Cappa C.Covert D.Baynard T.Massoli P.Sierau B.Bates T.Quinn P.Lovejoy E.Ravishankara A. R.Bias in Filter-Based Aerosol Light Absorption Measurements Due to Organic Aerosol Loading: Evidence from Ambient MeasurementsAerosol Sci. Tech.2008421033–1041
- Lack D. A.Lovejoy E. R.Baynard T.Pettersson A.Ravishankara A. R.Aerosol Absorption Measurement Using Photoacoustic Spectroscopy: Sensitivity, Calibration, and Uncertainty DevelopmentsAerosol Sci. Tech.200640697–708
- Lewis K.Arnott W. P.Moosmüller H.Wold C.Strong Spectral Variation of Biomass Smoke Light Absorption and Single Scattering Albedo Observed with a Novel Dual-Wavelength Photoacoustic InstrumentsJ. Geophys. Res.2008113 doi: 10.1029/2007JD009699
- Moosmüller H.Arnott W. P.Rogers C. F.Bowen J. L.Gillies J.Pierson W. R.Collins J. F.Durbin T. D.Norbeck J. M.Time Resolved Characterization of Diesel Particulate Emissions. 1. Instruments for Particle Mass MeasurementsEnviron. Sci. Technol.2001a35781–787
- Moosmüller H.Arnott W. P.Rogers C. F.Bowen J. L.Gillies J.Pierson W. R.Collins J. F.Durbin T. D.Norbeck J. M.Time Resolved Characterization of Diesel Particulate Emissions. 2. Instruments for Elemental and Organic Carbon MeasurementsEnviron. Sci. Technol.2001b351935–1942
- Moosmüller H.Chakrabarty R. K.Arnott W. P.Aerosol Light Absorption and its Measurement: A ReviewJ. Quant. Spectrosc. Radiat. Transfer2009110844–878
- Nguyen Q.-V.Dibble R. W.Day T.High-Resolution Oxygen Absorption Spectrum Obtained with an External-Cavity Continuously Tunable Diode LaserOpt. Lett.1994192134–2136
- Petzold A.Schloesser H.Sheridan P. J.Arnott W. P.Ogren J. A.Virkkula A.Evaluation of Multiangle Absorption Photometry for Measuring Aerosol Light AbsorptionAerosol Sci. Tech.20053940–51
- Ramanathan V.Carmichael G.Global and Regional Climate Change due to Black CarbonNature Geoscience20081221–227
- Robichaud D. J.High-Resolution Study of the O2 A-Band Using Frequency Stabilized Cavity Ring-Down Spectroscopy Ph.D. ThesisCaltechPasadena CA2008http://resolver.caltech.edu/CaltechETD:etd-05212008-152946
- Robichaud D. J.Hodges J. T.Brown L. R.Lisak D.Maslowski P.Yeung L. Y.Okumura M.Miller C. E.Experimental Intensity and Lineshape Parameters of the Oxygen A-Band Using Frequency-Stabilized Cavity Ring-Down SpectroscopyJ. Mol. Spectrosc.2008a2481–13
- Robichaud D. J.Hodges J. T.Maslowski P.Yeung L. Y.Okumura M.Miller C. E.Brown L. R.High-Accuracy Transition Frequencies for the O2 A-BandJ. Mol. Spectrosc.2008b25127–37
- Rothman L. S.Gordon I. E.Barbe A.Benner D. C.Bernath P. E.Birk M.Boudon V.Brown L. R.Campargue A.Champion J. P.Chance K.Coudert L. H.Dana V.Devi V. M.Fally S.Flaud J. M.Gamache R. R.Goldman A.Jacquemart D.Kleiner I.Lacome N.Lafferty W. J.Mandin J. Y.Massie S. T.Mikhailenko S. N.Miller C. E.Moazzen-Ahmadi N.Naumenko O. V.Nikitin A. V.Orphal J.Perevalov V. I.Perrin A.Predoi-Cross A.Rinsland C. P.Rotger M.Simeckova M.Smith M. A. H.Sung K.Tashkun S. A.Tennyson J.Toth R. A.Vandaele A. C.Vander Auwera J.The HITRAN 2008 Molecular Spectroscopic DatabaseJ. Quant. Spectrosc. Radiat. Transfer2009110533–572
- Rothman L. S.Jacquemart D.Barbe A.Benner D. C.Birk M.Brown L. R.Carleer M. R.Chackerian C.Jr.Chance K.Coudert L. H.Dana V.Devi V. M.Flaud J.-M.Gamache R. R.Goldman A.Hartmann J.-M.Jucks K. W.Maki A. G.Mandin J.-Y.Massie S. T.Orphal J.Perrin A.Rinsland C. P.Smith M. A. H.Tennyson J.Tolchenov R. N.Toth R. A.Vander Auwera J.Varanasi P.Wagner G.The HITRAN 2004 Molecular Spectroscopic DatabaseJ. Quant. Spectrosc. Radiat. Transfer200596139–204
- Schilt S.Thévenaz L.Wavelength Modulation Photoacoustic Spectroscopy: Theoretical Description and Experimental ResultsInfrared Physics & Technology200648154–162
- Sedlacek A.Lee J.Photothermal Interferometric Aerosol Absorption SpectrometryAerosol Sci. Tech.2007411089–1101
- Seinfeld J. H.Pandis S. N.Atmospheric Chemistry and Physics: From Air Pollution to Climate ChangeWileyNew York1998
- Sheridan P. J.Arnott W. P.Ogren J. A.Andrews E.Atkinson D. B.Covert D. S.Moosmüller H.Petzold A.Schmidt B.Strawa A. W.Varma R.Virkkula A.The Reno Aerosol Optics Study: An Evaluation of Aerosol Absorption Measurement MethodsAerosol Sci. Tech.2005391–16
- Subramanian R.Roden C. A.Boparai P.Bond T. C.Yellow Beads and Missing Particles: Trouble Ahead for Filter-Based Absorption MeasurementsAerosol Sci. Tech.200741630–637
- Watson J. G.2002 Critical Review—Visibility: Science and RegulationJ. Air & Waste Manage. Assoc.200252626–713