Abstract
The effects of particulate matter on environment and public health have been widely studied in recent years. In spite of the presence of numerous studies about this topic there is no agreement on the relative importance of the particles' size and origin with respect to health effects among researchers. Nevertheless, air quality standards are moving, as the epidemiological attention, towards greater focus on the smaller particles. The most reliable method used in measuring particulate matter (PM) is the gravimetric method since it directly measures PM concentration, guaranteeing an effective traceability to international standards. This technique, however, neglects the possibility to correlate short term intraday atmospheric parameter variations that can influence ambient particle concentration and size distribution as well as human activity patterns. Besides, a continuous method to determine PM concentrations through the measurement of the number size distribution is the system constituted by a Scanning Mobility Particle Sizer (SMPS) and an Aerodynamic Particle Sizer (APS). In this article, the evaluation of the uncertainty budget in measuring PM through the SMPS–APS system, as well as a metrological comparison with the gravimetric reference method in order to analyze the compatibility, was carried out and applied with reference to an experimental campaign developed in a rural site. This choice allowed to assume the hypothesis of spherical particle morphology. The average PM10, PM2.5, and PM1 uncertainties obtained for the SMPS–APS system are equal to 27%, 29%, and 31%, respectively. Here the principle influence parameter is the particle density that has to be directly measured with low uncertainty in order to reduce the PM uncertainty.
1. INTRODUCTION
Exposure of the population to ambient particulate matter (PM) received increased attention as a consequence of epidemiological studies which demonstrated relationships between ambient particle concentrations and significant health effects (CitationDockery et al. 1993; CitationPope 2000). The considerable interest in PM health effects was a guideline not only for the regulatory authorities but also for the air quality management community for the definition of new threshold air quality standards which are in movement towards the smaller particles as the epidemiological attention. Current air quality standards only regulate the mass of particulate matter with aerodynamic diameter less than 10 μm (PM10) and 2.5 μm (PM2.5) (US-EPA 40 CFR 1997; EN 12341 2001; EN 14907 2005). In particular, the U.S. Environmental Protection Agency (U.S. EPA) and the European Environmental Agency (EEA) assume as reference method the gravimetric analysis of particle filters collected over a period of 24 h. The gravimetric method is a time-integrated measurement based on field sampling and consequent laboratory analysis of particle mass, assuring the traceability to the International System (CitationMcMurry 2000).
Nevertheless, sources, meteorology, and atmospheric processes influencing ambient particle concentration and its size distribution, as well individual human activity patterns, vary in time scales that are practically shorter than 12–24 h. Then, the necessity to develop monitors of particle concentrations in shorter time intervals is very important to improve exposure assessment to ambient particles. In fact, the daily averaging times used in current networks tend to smooth out the intraday variability limiting our comprehension of the main influence parameters in PM accumulation in air.
Over the last 6–8 years, significant advances in the measurement of PM chemical and physical properties resulted as an outcome of EPA's PM Supersites Program (CitationSolomon and Sioutas 2008). In particular, CitationChow et al. (2008) describe and evaluate integrated and continuous and semicontinuous measurements (with a typical time resolution of an hour or less) for particle mass and chemical composition from the Supersite Program.
A continuous indirect method to estimate the particle mass concentration is the system constituted by the Scanning Mobility Particle Sizer (SMPS) and the Aerodynamic Particle Sizer (APS). It measures the number size distribution and total number concentration over a wide range (from few nanometers up to 20 μm) and it is also able to estimate the mass distribution and its total concentration, after having determined particle density (CitationSioutas et al. 1999; CitationFine et al. 2004; CitationBuonanno et al. 2009).
The ability of this method for the accurate measurement of PM concentrations was also evaluated by CitationShen et al. (2002) and CitationKhlystov et al. (2004). Specifically, in CitationShen et al. (2002) the continuous measurements obtained by the SMPS-APS were compared to time-integrated mass samplers (Partisol filter and MOUDI Impactor samplers) in determining PM2.5, PM10, and PM2.5−10 fractions collected in the Los Angeles Basin. In this study mass distributions and the corresponding total concentrations were obtained by hypothesizing a constant density of 1.6 g cm−3. The most important results were: (1) the SMPS–APS consistently compares well to gravimetrically time-integrated mass concentrations in the range of PM2.5 measurements (2) the comparability of the SMPS–APS and Partisol measurement is weakened for PM10 because of the poor efficiency of the APS in measuring coarse particle mass (PM2.5−10). In CitationKhlystov et al. (2004), SMPS–APS data were compared to measurements using TEOM in Pittsburgh, USA. The SMPS and APS values were merged on the basis of an approach reported in CitationShen et al. (2002), as well as a second approach through the introduction of a size correction factor related to the ratio of particle density and the shape factor. Using the second approach an average standard error of approximately 20% was found and at the same time an average aerosol effective density of 1.5 g cm−3 was considered.
As regards submicrometer measurements, in CitationSioutas et al. (1999) findings from the monodisperse aerosol tests indicated that SMPS measurements were in good agreement with the gravimetric analysis for particle sizes between 0.3–0.5 μm. At any rate, for particles of less than 0.30 μm, the SMPS overestimated the mass concentrations by a factor of 1.5–1.6. The mass concentrations obtained through the APS results quite similar to those obtained using the gravimetric method. Finally, in CitationMorawska et al. (1999a) the method of experimental correlation of particle mass and number using a TEOM and a SMPS operating in the submicrometer size ranges was developed and validated using two aerosols of known density. The results indicate that when the particle density is constant the correlation is strong. By contrast high differences were found in the case of ambient air due to the variability of the particle density.
The present study relates the results of a two-month experimental campaign carried out to compare the continuous SMPS–APS system and the gravimetric time-integrated method in measuring PM1, PM2.5, and PM10. The main innovative aspects of this work are hereinafter specified.
Firstly, an in depth metrological analysis of the SMPS–APS system is presented through a detailed estimation of the uncertainty budget in determining the mass concentration. The SMPS–APS uncertainty budget, as well as the gravimetric method one, is necessary in order to evaluate the compatibility between continuous and time-integrated measurements (CitationISO/IEC Guide 99–12 2007). Compatibility is assured if the absolute value of the difference of any pair of measured quantity values from two different measurement results is smaller than some chosen multiple of the standard measurement uncertainty of that difference. Metrological compatibility of measurement results replaces the traditional concept of “staying within the error,” as it represents the criterion to decide whether two measurement results refer to the same measurand or not. In the above-mentioned literature the comparison is limited to the evaluation of average standard errors with no reference to compatibility.
A second aspect regards the use of an APS 3321 in the experimental campaign carried out. The ability of the APS in making accurate mass-weighted size distribution measurements was improved over the past decade. In fact the old APS 3320, used in CitationShen et al. (2002), featuring double-crest optics and improved signal processing, eliminated the effect of false counts due to coincidence and phantom particles measured in the previous 3300 and 3310 APS Models (CitationHeitbrink et al. 1991) providing better distribution measurements of more concentrated aerosols. However, the accuracy in calculating mass distribution was still limited by a very low-level background of false, large-particle counts revealed when the effect of the coincidence and phantom particles was eliminated. This analysis was in depth carried out by CitationStein et al. (2002) with a CFD simulation of the particle patterns in the measurement domain of the APS. They found out small particles recirculated and reentered in the measurement domain with a considerable lower velocity, which makes them large from an aerodynamics point of view even if small optically. With the introduction of the APS 3321, the possibility of particle recirculation in the optics region, redesigned on the basis of the flow modeling results (CitationOberreit et al. 2001) was minimized with a consequent more accurate mass distribution.
Finally, conversely to the above-mentioned literature (where urban aerosols were monitored), the sampling site is located in a rural area in Italy, far away from significant sources of fresh ultrafine particles. This situation entails consideration of the sampled aerosol constituted by aged particles with a spherical shape and a negligible presence of nanoparticle agglomerates. Consequently, the hypothesis of spherical particles was taken into account in the estimation of the uncertainty budget of mass concentrations whereas the uncertainty analysis of aerosols with high percentage of agglomerates will be developed in future works.
2. EXPERIMENTAL APPARATUS AND SAMPLING SITE
2.1. Scanning Mobility Particle Sizer
A Scanning Mobility Particle Sizer consists of an Electrostatic Classifier and a Condensation Particle Counter. In the Electrostatic Classifier a radioactive source, Kr-85 gas, imposes a Boltzmann charge distribution on the aerosol, then the aerosol passes through the Differential Mobility Analyzer. Here an electric field acts on the charged particles in order to classify them according to their electrical mobility equivalent diameter and then the resulting size selected particles pass to the CPC (CitationKinney et al. 1991; CitationHinds 1999). In the CPC particles grow by condensation of a saturated vapor and these are counted by means of an optical detector using the scattered light of a laser diode focused onto the particle beam. In the present experimental campaign a TSI Model 3936 is used to measure particle number concentration in the 14–700 nm size range, constituted by the TSI Model 3080 Electrostatic Classifier and the TSI Model 3775 Condensation Particle Counter.
The particle number concentration for every channel (nSMPS,i) is calculated from the channel raw count of the CPC (c'i) through the CPC dilution factor (φ), the sampling time (ti), the sampling flow rate (θ) and the counting efficiency (ηi). The channel mass concentration (mSMPS,i) is evaluated from nSMPS,i by means of:
where dve,i represents the equivalent volumetric diameter (the diameter of a sphere having the same volume of the particle under examination) and ρp is the particle density. In this article, adopting the hypothesis of spherical particles, the volumetric and mobility diameters result coincident (CitationSioutas et al. 1999; CitationMcMurry et al. 2002).
The sampling time for channel (ti) is a function of the aerosol-sheath flow rate ratio, the up-scan time, the size range width and the shape of the transfer function (CitationMamakos et al. 2008). The sample efficiency factor per channel (ηi) is evaluable as the product of the DMA efficiency (ηDMA,i), CPC efficiency (ηCPC,i) and SMPS diffusion efficiency (ηdiff,i):
The DMA efficiency (ηDMA,i takes into account three parameters: the charging impactor and DMA transfer function efficiencies. In particular, the charging efficiency is the fraction of particles having an elemental positive charge: it is evaluated through the Boltzmann equilibrium distribution (CitationHinds 1999). Instead the SMPS diffusion efficiency (ηdiff,i takes into account the diffusion losses of particle in the tubes carrying aerosol from the Electrostatic Classifier aerosol inlet to CPC's optical chamber: it depends on the particle diffusion coefficient, the tube length and the flow rate (CitationReineking and Porstendörfer 1986). The CPC counting efficiency (ηCPC,i provides the estimation of the miscounted particles fraction due to their very small size which makes them undetectable for the optical detector. The scientific literature examined the counting efficiencies of different CPC models (CitationHämeri et al. 2002; CitationMertes et al. 1995; CitationPetäjä et al. 2006; CitationStolzenburg et al. 1991; CitationBanse et al. 2001; CitationLiu et al. 2006): in the present study the efficiency for the CPC3775 evaluated by CitationHermann et al. (2007) was considered.
Finally, the total mass concentration (MSMPS) is obtained as the sum of the N channel mass concentrations.
2.2. Aerodynamic Particle Sizer
The Aerodynamic Particle Sizer (Model 3321 TSI Inc.) measures particle number concentration in the 0.5–20 μm range size. The measurement is based on the time of flight (TOF) calculation (average velocity across the timing gate) of the particle at the exit of an accelerating nozzle. This method consists of drawing the aerosol into the inlet and of immediately splitting it into a sample flow (1 L min−1), through an inner nozzle, and a sheath flow (4 L min−1), through an outer nozzle. The filtered sheath flow is reunited with the sample flow at the accelerating orifice nozzle. This flow confines the sample particles to the center stream and accelerates the air flow around the particles. Particle inertia causes the particle velocity to lag behind the velocity of the entraining gas. In this way it manages to measure particle velocity in the optics chamber which also provides particle aerodynamic sizing. In fact as soon as particles exit the nozzle they cross through two partially overlapping laser beams in the detection area, light is scattered and an elliptical mirror, placed at 90 degrees to the laser beam axis, collects the light and focuses it onto an avalanche photodetector (APD). Then the APD converts the light pulses into electrical pulses. The use of two partially overlapping laser beams results in each particle generating a single two-crested signal. Peak-to-peak time-of-flight is measured with a 4-nanosecond resolution for aerodynamic sizing (CitationHolm et al. 1997).
Besides the APS measures the number of particles for every channel. For each channel, the raw count (c'i) is related to the final concentration (n) through the dilution factor (φ, ratio between the total flow rate θtot and the aerosol flow rate θaerosol), the sampling time (t) and the counting efficiency (ηi) as:
As for the SMPS mass concentration for the i-channel (mAPS,i) is calculated from number channel concentration (nAPS,i through:
where dve,i represents the channel equivalent volumetric diameter and ρp is the particle density.
The APS provides the measurement in terms of aerodynamic diameter dae,i. The relationship between aerodynamic and volumetric diameter was evaluated for spherical particles by CitationSioutas et al. (1999):
where ρ0 is the reference density (1 g cm−3), χi is the shape factor, Cc(dae,i), and Cc(dve,i) are the slip correction factors referred to the aerodynamic and the volumetric diameter, respectively, and defined in CitationAllen and Raabe (1985).
The total mass concentration by means of APS (MAPS) is calculated as the sum of the N channel mass concentrations.
2.3. Gravimetric Time-Integrated Sampler
A gravimetric time-integrated sampler (Zambelli 6000 Plus) was used to measure PM mass concentration. It is based on the measurement of the gas flow rate through a low porosity filter and the subsequent measurement of PM mass. The dimensional and metrological characteristics of the impactors for PM10 and PM2.5 sampling are described in the European standards EN 12341:2001 and EN 14907:2005, and in the U.S. standard US-EPA 40 CFR.
2.4. Sampling Site
In the present study the site selected is located in the center of Italy. This location can be considered a rural site because of the absence of both residential and industrial settlements as well as local traffic, therefore it is characterized by a high percentage of aged spherical particles (CitationWexler and Johnston 2008). Several papers measured high percentages of aggregates along the roadsides due to diesel emissions and lower values in the urban background (CitationXiong and Friedlander 2001; CitationDye et al. 2000). These agglomerates are typically flexible nanoparticle chains (CitationFriedlander 2000), which significantly differ in respect of spherical particles from a dynamic point of view. This aspect could lead to errors in the data interpretation of mobility size and subsequent calculations of the surface area and volume (and hence mass) distributions for an aerosol with a high percentage of aggregates. CitationLall and Friedlander (2006) and CitationLall et al. (2006) developed a method to analyze the mobility of nanoparticle aggregates for a limiting case of idealized aggregates (fractal dimension <2): the Idealized Aggregate (IA) theory. The basic assumption of this theory is that aggregates are composed of primary particles with the same (known) diameter. Principally the sampling site was selected by the authors in order to have the sampled aerosol constituted by spherical particles with negligible percentages of aggregates. Future developments will be focused on the evaluation of the IA theory uncertainty. In fact, by using the IA theory, the aggregate primary particle size and the percentage of aggregate structures of the sampled aerosol could represent large uncertainty sources and have to be further analyzed.
3. UNCERTAINTY BUDGET IN THE MEASUREMENT OF PM CONCENTRATION
In order to carry out a comparison in the measurement of the PM the uncertainty budget has to be determined both for the time-integrated gravimetric sampler and for the SMPS–APS system. The uncertainty propagation can be applied for number, surface area and mass distributions, determined using the SMPS–APS system and for PM measured by time-integrated gravimetric samplers. The only uncertainty budget in the measurement of mass particle distributions for the SMPS–APS system is hereinafter presented.
The uncertainty determined for SMPS, UM − SMPS2, and APS, UM − APS2, spectrometers are used to estimate the overall SMPS–APS system uncertainty, USMPS − APS2. The SMPS–APS total mass concentration, MSMPS − APS, and its absolute expanded uncertainty, USMPS − APS (k= 2, level of confidence 95%) are calculated as:
where
![]() and
and ![]() are the mass concentrations measured by the SMPS and APS, respectively.
are the mass concentrations measured by the SMPS and APS, respectively.
3.1. PM Uncertainty Budget Using SMPS
Applying the ISO-Guide (ISO/IEC Guide 98-3:2008) to Equation (Equation1), mass concentration uncertainty for every channel (
![]() is evaluated as:
is evaluated as:
where the mass concentration uncertainty contributions,
![]() (xi), are related to the uncertainties of the single xi sources, ui(xi), through the sensitivity coefficients,
(xi), are related to the uncertainties of the single xi sources, ui(xi), through the sensitivity coefficients, ![]() , as:
, as:
The total mass concentration uncertainty budget (![]() is estimated as:
is estimated as:
where the θ, φ, and ρp contributions, being channel independent and therefore fully correlated, are simply summed in the total uncertainty: the remaining contributions are hypothesized to be uncorrelated.
The uncertainty contribution of the volumetric diameter, ![]() (dve,i) has to be determined considering the Electrostatic Classifier. In fact, the uncertainty on the size is only due to the misclassification of the particles through the DMA column. This uncertainty contribution was estimated by CitationMulholland et al. 1999 and CitationMulholland et al. 2006 for 100 and 60 nm SRM® spheres. A relative uncertainty for every channel of ±0.95% is assumed in the present paper as a consequence of the results of CitationMulholland et al. 1999 for 100 nm spheres. In particular the aerosol-sheath flow rate ratio of 0.1, adopted in CitationMulholland et al. 1999, is the same used in the present study whereas a 0.025 ratio is reported in CitationMulholland et al. 2006.
(dve,i) has to be determined considering the Electrostatic Classifier. In fact, the uncertainty on the size is only due to the misclassification of the particles through the DMA column. This uncertainty contribution was estimated by CitationMulholland et al. 1999 and CitationMulholland et al. 2006 for 100 and 60 nm SRM® spheres. A relative uncertainty for every channel of ±0.95% is assumed in the present paper as a consequence of the results of CitationMulholland et al. 1999 for 100 nm spheres. In particular the aerosol-sheath flow rate ratio of 0.1, adopted in CitationMulholland et al. 1999, is the same used in the present study whereas a 0.025 ratio is reported in CitationMulholland et al. 2006.
The aerosol flow rate uncertainty, ![]() (θ), was evaluated on the basis of CPC specifications (CitationTSI Inc. 2006), CitationBirmili et al. (1999) and CitationFletcher et al. (2009). The counting statistical uncertainty,
(θ), was evaluated on the basis of CPC specifications (CitationTSI Inc. 2006), CitationBirmili et al. (1999) and CitationFletcher et al. (2009). The counting statistical uncertainty, ![]() , was modeled through the Poisson distribution obtaining a relative uncertainty equal to
, was modeled through the Poisson distribution obtaining a relative uncertainty equal to ![]() as reported in CitationBevington and Robinson (1992). The uncertainty of the counting efficiency outcomes from the above-reported three contributions: η
as reported in CitationBevington and Robinson (1992). The uncertainty of the counting efficiency outcomes from the above-reported three contributions: η![]() , η
, η![]() , and ηCPC. The DMA efficiency uncertainty was hypothesized to be included in the diameter classification uncertainty (CitationMulholland et al. 1999). The average diffusion and CPC counting efficiency uncertainties are estimated as ±10% and ±8%, respectively (CitationHermann et al. 2007). The uncertainty contribution of the sampling time is evaluated negligible as well as the flow rate ratio matching (CitationMulholland et al. 2006).
, and ηCPC. The DMA efficiency uncertainty was hypothesized to be included in the diameter classification uncertainty (CitationMulholland et al. 1999). The average diffusion and CPC counting efficiency uncertainties are estimated as ±10% and ±8%, respectively (CitationHermann et al. 2007). The uncertainty contribution of the sampling time is evaluated negligible as well as the flow rate ratio matching (CitationMulholland et al. 2006).
As regards particle density a value of 1.7 g cm−3 was considered in the environmental aerosol mass concentration estimation. Literature studies on monitoring ambient aerosol, in fact, estimated particle density in the size range 1.5–1.8 g cm−3 (CitationMorawska et al. 1999a; CitationSioutas et al. 2000; CitationShen et al. 2002; CitationFine et al. 2004; CitationBarone et al. 2006; CitationBuonanno et al. 2009). The density has to be directly measured in every aerosol characterization. Using on-line measurement techniques based on mobility-aerodynamic sizing for density estimation, it is difficult to separate the combined effect of bulk density and shape factor (CitationSchmid et al. 2007). To this purpose, an effective particle density was introduced (CitationMcMurry et al. 2002; CitationGeller et al. 2006; CitationDe Carlo et al. 2004; CitationKhlystov et al. 2004) as a parameter involving both bulk density and shape factor. An elegant method to measure effective particle density was developed by CitationMcMurry et al. (2002) through the mass-mobility relationship. Analyzing atmospheric particles of a certain diameter, they realized that different effective density modes could be obtained: one in the range lower than 1 g cm−3, another one in the 1.35–2.23 g cm−3 size range (with an average value of 1.7 g cm−3). The first mode was indicated by CitationMcMurry et al. (2002) as typical of aggregate structures. Otherwise, the effective densities ranging in the higher density values could represent the bulk densities. In fact, these values were obtained with an Aerosol Particle Mass (APM) Analyzer voltage very close to the expected APM voltage for the selected particle size: thus, the so-obtained effective density could better approximate the spherical particle density. In this way a separation of the bulk density and shape factor effects is obtained and an uncertainty model here-developed for spherical particles can be used. Finally, the uncertainty associated to density value, ![]() (ρp) was calculated hypothesizing a rectangular distribution with ±0.5 g cm−3 as extended uncertainty (±29% in terms of relative extended uncertainty). This large uncertainty considered could be reduced measuring the particle density directly.
(ρp) was calculated hypothesizing a rectangular distribution with ±0.5 g cm−3 as extended uncertainty (±29% in terms of relative extended uncertainty). This large uncertainty considered could be reduced measuring the particle density directly.
3.2. PM Uncertainty Budget Using APS
Applying the ISO-Guide (ISO/IEC Guide 98–3:2008) to Equation (Equation4), total mass concentration uncertainty (
![]() is evaluated as:
is evaluated as:
where the mass concentration uncertainty contributions,
![]() (xi), are related to the uncertainties of the single xi sources, ui(xi), through the sensitivity coefficients,
(xi), are related to the uncertainties of the single xi sources, ui(xi), through the sensitivity coefficients, ![]() :
:
The total mass concentration uncertainty budget (![]() is estimated as:
is estimated as:
where the t, ρp, and θ contributions, being channel independent and therefore fully correlated, are simply summed in the total uncertainty.
The aerosol flow rate uncertainty, ![]() (θ), was evaluated as ±10% on the basis of CitationRader et al. (1990) and CitationTSI Inc. APS specifications (2004). The APS counting statistical uncertainty, um−APS,i(c'i), was estimated through the Poisson distribution as reported in the SMPS uncertainty analysis. The counting efficiency was carefully evaluated by CitationVolckens and Peters (2005) for both solid and liquid particles: for solid particles counting efficiencies ranged between 85% (at 0.8 μm) and 99%; for liquid droplets, counting efficiencies progressively decline from 75% at 0.8 μm to 25% for 10 μm drops. In the present study a relative uncertainty of ±10% of the APS counting efficiency correction model was adopted.
(θ), was evaluated as ±10% on the basis of CitationRader et al. (1990) and CitationTSI Inc. APS specifications (2004). The APS counting statistical uncertainty, um−APS,i(c'i), was estimated through the Poisson distribution as reported in the SMPS uncertainty analysis. The counting efficiency was carefully evaluated by CitationVolckens and Peters (2005) for both solid and liquid particles: for solid particles counting efficiencies ranged between 85% (at 0.8 μm) and 99%; for liquid droplets, counting efficiencies progressively decline from 75% at 0.8 μm to 25% for 10 μm drops. In the present study a relative uncertainty of ±10% of the APS counting efficiency correction model was adopted.
The uncertainty in volumetric diameter, ![]() (dve,i) can be evaluated on the basis of Equation (Equation5
(dve,i) can be evaluated on the basis of Equation (Equation5). The volumetric diameter uncertainty is determined as:
The uncertainty of the aerodynamic diameter is strictly related to the Time of Flight (TOF) uncertainty. The diameter resolution can be obtained through the typical monotonic Time-of-Flight Response for APS (CitationTSI Inc. 2004). In the authors' opinion, this technique overestimates the diameter resolution uncertainty: the calibration curve, in fact, is a continuous curve relating the TOF of the particles to the corresponding aerodynamic diameters. In any case, the instrumentation provides a non continuous concentration distribution associating particles of a certain dimensional range to a nominal diameter (the midpoint diameter of the channel): this means that the TOF resolution uncertainty represents a very small amount in respect to the channel width. Therefore, an ad hoc uncertainty model is hereinafter developed to estimate the diameter resolution uncertainty. This model is based on the statement that TOF resolution can generate errors in misallocating particles having TOFs very close to the ones referred to the boundaries of every channel. The proposed method weighs the diameter uncertainty with the probability of the particle to be included in the channel or in the adjacent ones (CitationBetta et al. 2004). The probability of a particle (P) to be counted in the closer channels is calculated as:
where TOFupperbound and TOFlowerbound are the TOFs corresponding to the boundary diameters for the i-channel through the monotonic Time-of-Flight Response for APS 3321 (CitationTSI Inc. 2004). The diameter uncertainties are estimated through a rectangular distribution. The resulting diameter uncertainty is
According to the literature studies, the particle shape factor (χ) can vary as a function of the origin of the aerosol (CitationDahneke 1982; CitationDavies 1979; CitationJohnson et al. 1987). The knowledge of the aerosol sampled can reduce the uncertainty of the shape factor. In the present uncertainty model, a ±9% relative uncertainty is assumed for the shape factor on the basis of CitationMcMurry et al. 2002. The density uncertainty was estimated as in the SMPS section: it is evaluated as ±29%.
The slip correction factor uncertainty is evaluated through the analysis reported in CitationMulholland et al. (1999). In this study, an uncertainty of 0.08 nm was associated with the slip correction factor when 100 nm NIST SRM 1963 particles were measured. Thus, in the present study a value of ±0.8% was adopted for both slip correction factors (Cc(dae) and Cc(dve)) for every channel size. In addition, sampling time and unit density uncertainties are considered negligible in respect to the other parameters.
FIG. 1 Average particle size distribution referred to the 5–10 September 2008 period.
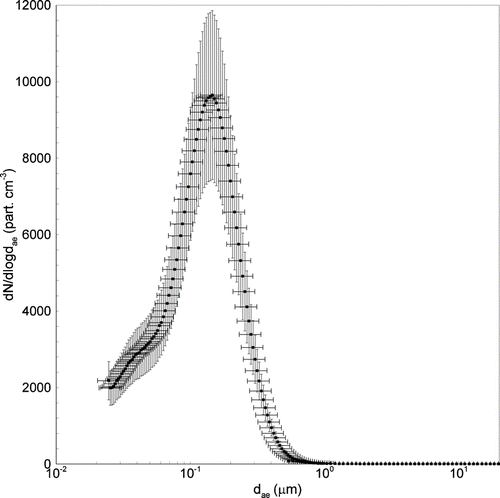
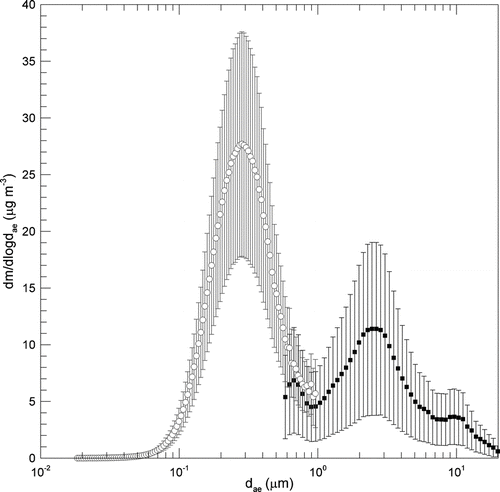
FIG. 2 Average mass concentration distribution referred to the 5–10 September 2008 period.
4. EXPERIMENTAL RESULTS
The above-reported uncertainty budget models were applied to the airborne particle distributions sampled in the rural site selected during the experimental campaign conducted from May to October 2008. The operating conditions used for the SMPS sample collections included a monodisperse air flow rate of 0.3 L min−1 and scan time of 240 s, and for the APS scan times of 240 s. Samplings were conducted daily every 30 min by the SMPS and APS, and triplicate samples were collected at each sampling event.
As regards number distribution, the typical SMPS and APS single channel uncertainties are equal to 20% and 18%, respectively. Number particle distribution, corresponding number and aerodynamic diameter uncertainties for the average size distribution referred to the 5–10 September 2008 period, reported as example, are shown in . As expected, the distribution presents a typical modality of an aged aerosol. The aerodynamic diameter uncertainty (evaluated by applying the propagation law of uncertainty to Equation [5], considering a coverage factor equal to 2 with a confidence level of 95%) ranges between 18% and 20%.
This uncertainty is very important in order to characterize the modality of the aerosol distribution (CitationMorawska et al. 1999b and Citation2008) that is fundamental to understand the aerosol origin. In , the average mass concentration distribution sampled in the same period is reported. The bimodal mass distribution, as well as the number one, present typical values of rural influenced aerosol (CitationSeinfeld and Pandis 2006). SMPS and APS channel uncertainties are equal to 36% and 67–80%, respectively. In the overlapping size range between 500 and 800 nm both instruments (SMPS and APS) measure the same particle population. In order to evaluate the contribute to the total mass concentration of the overlapping range, the average values between the SMPS and APS values are chosen without considering the data merge approaches reported in CitationShen et al. (2002) and CitationKhlystov et al. (2004). This choice is allowed by the compatibility between SMPS and APS measurements in the overlapping region, as shown in .
FIG. 3 PM uncertainty trends determined using the SMPS-APS.
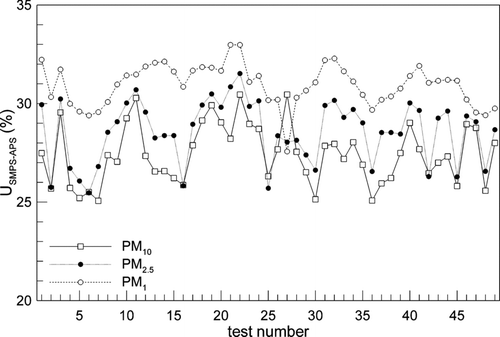
In the trends of the PM10, PM2.5, and PM1 uncertainties obtained for the SMPS–APS system are reported. The average values are equal to 27%, 29%, and 31% with corresponding variations of ±1.5%, ±1.6%, and ±1.1% for PM10, PM2.5, and PM1, respectively. The PM1 uncertainty is generally greater than PM2.5 and PM10 uncertainties. This is due to the type of measurement performed by the SMPS–APS system: an integrated measurement based on the sum of several channels. In fact, by increasing the number of channels involved in the measurement the total uncertainty has to decrease. The lowest uncertainties reported in correspond to the highest mass concentrations measured by the APS.
FIG. 4 PM10 and PM1 uncertainties of the SMPS-APS system as the mass measured by the APS varies.
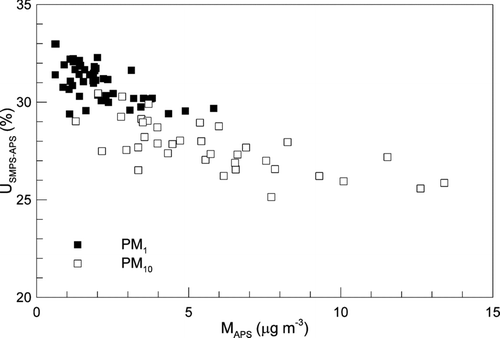
TABLE 1 SMPS uncertainty contribution in the PM2.5 measurement referred to the 5–10 September 2008 period
In the uncertainty model developed, the SMPS uncertainty does not depend on the mass concentration whereas the APS uncertainty (and, consequently the total uncertainty U![]() increases as the concentration decreases. To this purpose, in the
increases as the concentration decreases. To this purpose, in the ![]() as function of the mass concentration measured by the APS, M
as function of the mass concentration measured by the APS, M![]() , is reported both for PM10 and PM1. The
, is reported both for PM10 and PM1. The ![]() decreases as the
decreases as the ![]() increases with a higher variability in the case of PM10 because of the larger contribution of the APS in respect to the PM1 measurement. Furthermore, the modality of the mass distribution measured by the APS has a negligible influence on
increases with a higher variability in the case of PM10 because of the larger contribution of the APS in respect to the PM1 measurement. Furthermore, the modality of the mass distribution measured by the APS has a negligible influence on ![]() . In fact, in the case of a mass triangular distribution and a constant one, the
. In fact, in the case of a mass triangular distribution and a constant one, the ![]() varies between 36% and 37%.
varies between 36% and 37%.
The number of channels or stages influences the uncertainty. In the case of SMPS, a PM concentration uncertainty obtained on the basis of 6 channels (4 channels-per-decade) is higher of 2–3% in respect to 64 channels-per-decade. This consideration is important for several instruments that measure mass concentration by integrating some channels such as the Electrical Low Pressure Impactor (ELPI—12 stages), the Micro Orifice Uniform Deposit Impactor (MOUDI—8 stages), optical Particle Counters (OPC—6 stages), etc.
TABLE 2 APS uncertainty contribution in the PM2.5 measurement referred to the 5–10 September 2008 period
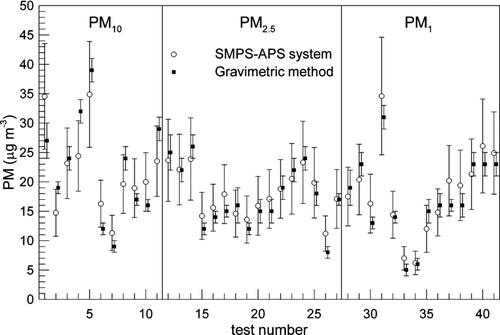
FIG. 5 SMPS-APS system and gravimetric method comparison in measuring PM10, PM2.5, and PM1.
In order to show the main influence parameters to the PM2.5 concentration uncertainty evaluated by means of SMPS and APS, and report the single contribution uncertainties. For both the instruments, particle density uncertainty represents the main contribution to the total mass concentration uncertainty. The authors point out that the high uncertainty value imposed on the particle density (±29%) is due to the fact that the density was not measured during the experimental campaign. In the case, for example, of a direct measurement of the particle density with an uncertainty of 5%, the corresponding PM uncertainty will be reduced to about 7%. Then, in order to perform accurate measurements of mass concentrations using the SMPS–APS system, the particle density has to be directly measured with a low uncertainty value.
Finally, in the comparison between the PM measurements obtained through the SMPS–APS system and the gravimetric method is reported. The gravimetric method uncertainties, determined through the ISO/IEC Guide 43–1:1997, are equal to 9.0%, 11%, and 12% with corresponding variations of ±2.8%, ±3.6%, and ±5.3% for PM10, PM2.5, and PM1, respectively.
Metrological compatibility is determined in terms of normalized error En, defined on the basis of the above-reported uncertainties as (ISO/IEC Guide 43–1:1997):
Average normalized error show values of 0.66, 0.32, and 0.38 for PM10, PM2.5, and PM1, respectively, confirming the good compatibility between the two measurement techniques and the validity of the uncertainty model proposed.
5. CONCLUSIONS
In this article an uncertainty budget model of a SMPS–APS system is evaluated and applied on the basis of a two-months experimental campaign carried out in a rural site in Italy in order to determine the compatibility between this continuous indirect method and a gravimetric reference one in measuring PM concentrations. The following conclusions can be withdrawn:
the typical uncertainty on the aerodynamic diameter (and, therefore on the mode diameter) is about 20%. The modality of an aerosol distribution is very important in order to evaluate the type of aerosol;
the PM10, PM2.5, and PM1 uncertainties obtained for the SMPS–APS system are equal to 27%, 29%, and 31%, respectively. The increasing of the uncertainty as the PM size diminishes depends on the type of measurement (integrated measurement by summing several channels);
the highest uncertainties found during the experimental campaign depend on the mass measured by the APS: in particular, they correspond to the minimum values of the total mass concentrations. The modality of mass distribution measured by the APS has a negligible influence on the mass concentration uncertainty;
the number of channels or stages influences the uncertainty. A PM concentration uncertainty obtained on the basis of 6 channels (4 channels-per-decade) is higher of 2–3% in respect to 64 channels-per-decade. This consideration is important for several instruments that measure mass concentration by integrating channels;
particle density uncertainty represents the main contribution to the total mass concentration uncertainty. The authors point out that the high uncertainty value imposed on the particle density (±29%) is due to the fact that the density was not measured during the experimental campaign. For example, in the case of a direct measurement of the particle density with lower uncertainty, the corresponding PM uncertainties will be strongly reduced;
metrological compatibility is determined in terms of normalized error that shows values of 0.66, 0.32, and 0.38 for PM10, PM2.5, and PM1, respectively, confirming the compatibility between the two measurements.
The authors point out that this analysis was carried out assuming a spherical particle morphology. Future developments should deepen morphological aspects. In particular, this could be very important for SMPS measurements where the presence of aggregate structures can weakly affect the total mass and surface area concentrations.
REFERENCES
- Allen M. D.Raabe O. G.Slip Correction Measurements of Spherical Solid Aerosol Particles in an Improved Millikan ApparatusAerosol Sci. Technol.198543269–286
- Banse D. F.Esfeld K.Hermann M.Sierau B.Wiedensohler A.Particle Counting Efficiency of the TSI CPC 3762 for Different Operating Parameters.Aerosol Sci.200132157–161
- Barone T.Lall A. A.Zhu Y.Yu R.Friedlander S. K.Inertial Deposition of Nanoparticle Chain Aggregates: Theory and Comparison with Impactor Data for Ultrafine Atmospheric AerosolsJ. Nanopart. Res.20068669–680
- Bevington P. R.Robinson D. K.Data Reduction and Error Analysis for the Physical SciencesWCB McGraw-HillBoston1992
- Betta G.Liguori C.Pietrosanto A.Uncertainty Evaluation in Algorithms with Conditional StatementIEEE Transactions on Instrumentation and Measurement2004534969–976
- Birmili W.Stratmann F.Wiedensohler A.Design of a DMA-Based Size Spectrometer for a Large Particle Size Range and Stable OperationJ. Aerosol Sci.199930549–5531999
- Buonanno G.Lall A. A.Stabile L.Temporal Size Distribution and Concentration of Particles Near a Major HighwayAtmos. Environment2009431100–1105
- Chow J. C.Doraiswamy P.Watson J. G.Chen L. W. A.Ho S. S. H.Sodeman D. A.Advances in Integrated and Continuous Measurements for Particle Mass and Chemical CompositionJ. Air & Waste Management Assoc.200858141–163
- Dahneke B. A.Viscous Resistance of Straight-Chain Aggregates of Uniform SpheresAerosol Sci. Technol.19821179–185
- Davies C. N.Particle Fluid InteractionJ. Aerosol Sci.197910477–513
- De Carlo P. F.Slowik J. G.Worsnop D. R.Davidovits P.Jimenez J. L.Particle Morphology and Density Characterization by Combined Mobility and Aerodynamic Diameter Measurements. Part 1: TheoryAerosol Sci. Technol.2004381185–1205
- Dockery D. W.Pope C. A.Xu X.Spengler J. D.Ware J. H.Ferris B. G.Speizer F. E.Mortality Risks of Air Pollution: A Prospective Cohort StudyNew England J. Medicine19933291753–1759
- Dye A. L.Rhead M. M.Trier C. J.The Quantitative Morphology of Roadside and Background Urban Aerosol in Plymouth, UKAtmos. Environ.2000343139–3148
- EN 12341 2001 Air quality—Determination of the PM10 Fraction of Suspended Particulate Matter—Reference Method and Field Test Procedure to Demonstrate Reference Equivalence of Measurement Methods.
- EN 14907 2005—Ambient Air Quality—Reference Gravimetric Method for the Determination of the PM2.5 Mass Fraction of Suspended Particulate Matter.
- Fine P. M.Shen S.Sioutas C.Inferring the Sources of Fine and Ultrafine Particulate Matter at Downwind Receptor Sites in the Los Angeles Basin Using Multiple Continuous MeasurementsAerosol Sci. Technol.20043812182–195
- Fletcher R. A.Mulholland G. W.Winchester M. R.King R. L.Klinedinst D. B.Calibration of a Condensation Particle Counter Using a NIST Traceable MethodAerosol Sci. Technol.2009435425–441
- Friedlander S. K.Smoke, Dust and Haze: Fundamentals of Aerosol DynamicsOxford University PressNew York2000
- Geller M.Biswas S.Sioutas C.Determination of Particle Effective Density in Urban Environments with a Differential Mobility Analyzer and Aerosol Particle Mass AnalyzerAerosol Sci. Technol.200640709–723
- Hämeri K.Koponen I. K.Aalto P. P.Kulmala M.The Particle Detection Efficiency of the TSI–3007 Condensation Particle CounterJ. Aerosol Sci.200233101463–1469
- Heitbrink W. A.Baron P. A.Willeke K.Coincidence in Time-of-Flight Aerosol Spectrometers: Phantom Particle CreationAerosol Sci. Technol.199114112–126
- Hermann M.Wehner B.Bischof O.Han H.-S.Krinke T.Liu W.Zerrath A.Wiedensohler A.Particle Counting Efficiencies of New TSI Condensation Particle CountersAerosol Sci.200738674–682
- Hinds W. C.Aerosol Technol.—Properties, Behavior and Measurement of Airborne ParticlesJohn Wiley & SonsNew York1999
- Holm R. L.Caldow R.Hairston P. P.Quant F. R.Sem G. J.An Enhanced Time-of-Flight Spectrometer that Measures Aerodynamic Size Plus Light-Scattering IntensityJ. Aerosol Sci.199728S1S11–S12
- ISO/IEC Guide 43–1:1997: Proficiency Testing by Interlaboratory comparisons—Part 1.
- ISO/IEC Guide 98–32008 Uncertainty of Measurement—Part 3: Guide to the Expression of Uncertainty in Measurement.
- ISO/IEC Guide 99–122007 International Vocabulary of Metrology—Basic and General Concepts and Associated Terms, VIM.
- Johnson D. L.Leith D.Reist P. C.Drag on Non-Spherical, Orthotropic Aerosol ParticlesJ. Aerosol Sci.19871887–97
- Khlystov A.Stanier C.Pandis S. N.An Algorithm for Combining Electrical Mobility and Aerodynamic Size Distributions Data when Measuring Ambient AerosolAerosol Sci. Technol.20043812229–238
- Kinney P. D.Pui D. Y. H.Mulholland G. W.Bryner N. P.Use of the Electrostatic Classification Method to Size 0.1 μm SRM Particles—A Feasibility StudyJ. Res. Natl. Inst. Stand. Technol.199196147–176
- Lall A. A.Friedlander S. K.On-Line Measurement of Ultrafine Aggregate Surface Area and Volume Distributions by Electrical Mobility Analysis: I. Theoretical AnalysisJ. Aerosol Sci.200637260–271
- Lall A. A.Seipenbusch M.Rong W.Friedlander S. K.On-Line Measurement of Ultrafine Aggregate Surface Area and Volume Distributions by Electrical Mobility Analysis: II. Comparison of Theory and MeasurementsJ. Aerosol Sci.200637272–282
- Liu W.Kaufman S.Osmondson B.Sem G.Quant F.Oberreit D.Water-Based Condensation Particle Countersfor Environmental Monitoring of Ultrafine ParticlesJ. of Air & Waste Management Assoc.2006564444–455
- Mamakos A.Ntziachristos L.Samaras Z.Differential Mobility Analyzer Transfer Functions in Scanning ModeAerosol Sci.200839227–243
- McMurry P. H.A Review of Atmospheric Aerosol MeasurementsAtmos. Environ.2000341959–1999
- McMurry P. H.Wang X.Park K.Ehara K.The Relationship between Mass and Mobility for Atmospheric Particles: A New Technique for Measuring Particle DensityAerosol Sci. Technol.2002362227–238
- Mertes S.Schröder F.Wiedensohler A.The Particle Detection Efficiency Curve of the TSI–3010 CPC as a Function of the Temperature Difference between Saturator and CondenserAerosol Sci. Technol.1995232257–261
- Morawska L.Johnson G.Ristovski Z. D.Agranovski V.Relation between Particle Mass and Number for Submicrometer Airborne ParticlesAtmos. Environment1999a331983–1990
- Morawska L.Thomas S.Jamriska M.Johnson G.The Modality of Particle Size Distributions of Environmental AerosolsAtmos. Environment1999b334401–4411
- Morawska L.Keogh D. U.Thomas S. B.Mengersen K. L.Modality in Ambient Particle Size Distributions and its Potential as a Basis for Developing Air Quality RegulationAtmos. Environ.20084271617–1628
- Mulholland G. W.Bryner N. P.Croarkin C.Measurement of the 100 nm NIST SRM 1963 by Differential Mobility AnalysisAerosol Sci. Technol.199931139–55
- Mulholland G. W.Donnelly M. K.Hagwood C. R.Kukuck S. R.Hackley V. A.Pui D. Y. H.Measurement of 100 nm and 60 nm Particle Standards by Differential Mobility AnalysisJ. Res. Natl. Inst. Stand. Technol.2006111
- Oberreit D. R.Holm R. L.Hairston P. P.Quant F. R.Sem G. J.Improvements in Particle Mass Distribution Measurement with the TSI 3320 APS2001 poster paper presented at American Association for Aerosol Research Conference.
- Petäjä T.Mordas G.Manninen H.Aalto P. P.Hämeri K.Kulmala M.Detection Efficiency of a Water-Based TSI Condensation Particle Counter 3785Aerosol Sci. Technol.200640121090–1097
- Pope C. A.What do Epidemiologic Findings Tell us About Health Effects of Environmental Aerosols?J. Aerosol Med.200013335–354
- Rader D. J.Brockmann J. E.Ceman D. L.Lucero D. A.A Method to Employ the Aerodynamic Particle Sizer Factory Calibration Under Different Operating ConditionsAerosol Sci. Technol.1990134514–521
- Reineking A.Porstendörfer J.Measurements of Particle Loss Functions in a Differential Mobility Analyzer (TSI, Model 3071) for Different Flow RatesAerosol Sci. Technol.19865483–486
- Seinfeld J. H.Pandis S. N.Atmospheric Chemistry and Physics: From Air Pollution to Climate ChangeWiley-Interscience2006
- Schmid O.Karg E.Hagen D. E.Whitefield P. D.Ferron G. A.On Effective Density of Non-Spherical Particles as Derived from Combined Measurements of Aerodynamic and Mobility Equivalent SizeJ. Aerosol Sci.200738431–443
- Shen S.Jaques P. A.Zhu Y.Geller M. D.Sioutas C.Evaluation of the SMPS-APS System as a Continuous Monitor for Measuring PM2.5, PM10 and Coarse (PM2.5-10) ConcentrationsAtmos. Environ.2002363939–3950
- Sioutas CAbt EWolfson J. M.Koutrakis P.Evaluation of the Measurement Performance of the Scanning Mobility Particle Sizer and Aerodynamic Particle SizerAerosol Sci. Technol.19993084–92
- Sioutas C.Kim S.Chang M.Terrell L. L.Gong H.Jr.Field Evaluation of a modified DataRAM MIE Scattering Monitor for Real-Time PM2.5 Mass Concentration MeasurementsAtmos. Environ.2000344829–4838
- Solomon P. A.Sioutas C.Continuous and Semicontinuous Monitoring Techniques for Particulate Matter Mass and Chemical Components: A Synthesis of Findings from EPA's Particulate Matter Supersites Program and Related StudiesJ. the Air & Waste Management Association200858164–195
- Stein S. W.Gabrio B. J.Oberreit D. R.Hairston P. P.Myrdal P. B.Beck T. J.An Evaluation of Mass-Weighted Size Distribution Measurements with the Model 3320 Aerodynamic Particle SizerAerosol Sci. Technol.200236845–854
- Stolzenburg M. R.McMurry P. H.An Ultrafine Aerosol Condensation Nucleus CounterAerosol Sci. Technol.199114148–65
- TSI IncorporatedAerodynamic Particle Sizer® Spectrometer—Model 3321: Instruction Manual. Revision E.2004
- TSI IncorporatedCondensation Particle Counter®—Model 3775: Operation and Service Manual. Revision C 2006
- US–EPA 40 CFR Protection of Environment Part 50–51 1997.
- Volckens J.Peters T. M.Counting and Particle Transmission Efficiency of the Aerodynamic Particle SizerJ. Aerosol Sci.200536121400–1408
- Wexler A. S.Johnston M. V.What have We Learned from Highly Time-Resolved Measurements during EPA's Supersites Program and Related Studies?J. Air & Waste Management Association200858303–319
- Xiong C.Friedlander S. K.Morphological Properties of Atmospheric Aerosol AggregatesProc. Natl. Acad. Sci. U.S.A.20019811851