Abstract
We describe a new method, Micro-Orifice Volatilization Impactor-CIMS (MOVI-CIMS) that couples two well-proven techniques, inertial impaction and chemical ionization mass spectrometry (CIMS). This technique allows both gas and condensed-phase composition data to be obtained on a semi-continuous basis. Gas-phase compounds are analyzed while particles are collected on a post. This collection step is followed by thermal desorption in an inert atmosphere to detect condensed-phase compounds. Differentiation between gas and condensed-phase compounds can likely occur on hourly or shorter timescales. The unique aspects of this approach are the use of an impactor with 100 nozzles that allows particle collection at a pressure within 15% of ambient and the ability to use a wide suite of negative and positive reagent ions. A sample flow rate of 10 L min−1 results in a cut-point diameter (d 50, diameter of 50% collection efficiency) of 0.13 μ m. We demonstrate the capabilities of this technique by applying it to the determination of mono- and dicarboxylic acid vapor pressures and studies of the heterogeneous oxidation of oleic acid aerosol particles.
INTRODUCTION
Particulate organic matter (POM) is an important constituent of fine aerosol (≤ 2.5 μ m) typically contributing 30–60% of total aerosol mass, depending on the location and season, and up to 90% in forested regions (CitationAndreae and Crutzen 1997; CitationKanakidou et al. 2005; CitationMurphy et al. 2006; CitationZhang et al. 2007). POM can affect the water content of aerosol particles with implications for multiphase chemistry, visibility, cloud formation, and climate (CitationNovakov and Penner 1993; CitationO'Dowd et al. 2004; CitationQuinn et al. 2005; CitationMochida et al. 2008); yet its sources and transformations are highly uncertain. For example, several recent studies have indicated that the organic mass predicted by models is currently substantially lower, sometimes by as much as a factor of 10 to 100, than that inferred from measurements (Citationde Gouw et al. 2005; CitationHeald et al. 2005; CitationJohnson et al. 2006; CitationVolkamer et al. 2006; Citationde Gouw et al. 2008; CitationKleinman et al. 2008). Knowledge of the temporal and spatial variation in POM, its chemical composition and phase state, and its thermodynamic parameters are clearly needed to understand its climate and human health effects (CitationFuzzi et al. 2006).
POM measurement is traditionally done by laboratory analysis of quartz filter samples collected on timescales ranging from a few hours to few days. But, due to the integrated nature of the measurements and delayed analysis, critical information on the time evolution of POM is often lost. Nevertheless, data from offline techniques has significantly improved our understanding of aerosol particle speciation (CitationHamilton et al. 2004), and guided the research community for many decades. Since offline analysis is not the focus of this paper, the reader is referred to CitationChow (1995) and CitationChow et al. (2008) for a more comprehensive review.
Over the past decade, numerous continuous and semi-continuous techniques have been developed that provide POM mass and speciation data on a faster timescale. POM in atmospheric aerosols is complex and fragile. As a result, no single instrument currently gives the information needed to completely understand the sources and gas-particle partitioning of POM in the atmosphere (CitationSullivan and Prather 2005).
Two thermal-optical instruments that are widely used in field studies are Sunset Laboratory Inc. (Tigard, OR) organic/elemental carbon analyzer (CitationTurpin et al. 1990) and Rupprecht & Patashnick Co., Inc., (east Greenbush, NY) Series 5400 carbon analyzer (CitationRupprecht et al. 1995). Recently, CitationSullivan et al. (2004) coupled the particle into liquid sampler (PILS) to a total organic carbon analyzer and measured the water soluble fraction of POM. These techniques are quantitative and have fast sampling times, but they lack organic speciation at the molecular-level, which is useful in understanding the chemical mechanisms associated with POM evolution and source identification.
Mass spectrometry (MS) has become an important tool in real-time detection and analysis of aerosol particles (CitationSullivan and Prather 2005; CitationNash et al. 2006). Many variations of aerosol mass spectrometers (AMS) have been developed for organic and inorganic compounds, differing in sampling inlets, desorption/ionization, and detection methods employed. Two main categories are instruments that analyze (a) single and (b) ensembles of aerosol particles.
Single-particle AMS allows the mixing state and composition of individual particles within a population to be assessed (CitationPrather et al. 1994; CitationMurphy and Thomson 1995; CitationThomson et al. 2000; CitationLake et al. 2003; CitationSu et al. 2004; CitationZelenyuk and Imre 2005). In most cases, aerosol particles are sampled through an aerodynamic lens, desorbed and ionized using a single or combination of lasers, and the ion cloud is then analyzed by a quadrupole or time-of-flight MS. Laser-desorption/ionization is generally qualitative or semi-quantitative at best, compared to other ionization methods. The high-energy UV lasers used for simultaneous desorption and ionization tend to cause excessive fragmentation of organic compounds. In addition, the high density of ions can lead to matrix effects, limiting their use for POM quantification or speciation (CitationNash et al. 2006). Nevertheless, single particle AMS provide valuable information on aerosol particle mixing state and certain composition markers (CitationMurphy et al. 2006). In addition, recent improvements such as the separation of desorption and ionization steps by vacuum ultraviolet (VUV) photoionization have reduced some of these limitations (CitationWoods et al. 2001).
Analyzing an ensemble, rather than individual aerosol particles has proven to be quite useful for POM quantification and/or speciation. Instruments so far developed generally use either a quadrupole MS (CitationTobias and Ziemann 1999; CitationJayne et al. 2000; CitationVoisin et al. 2003; CitationHearn and Smith 2004a), quadrupole ion trap MS (CitationHeld et al. 2009; CitationThornberry et al. 2009), or a gas chromatograph (GC) coupled to an MS (CitationWilliams et al. 2006; CitationGoldstein et al. 2008; CitationKreisberg et al. 2009).
Temperature-programmed thermal desorption particle beam MS (TD-PBMS) (CitationTobias and Ziemann 1999), and the Aerodyne AMS (CitationJayne et al. 2000) use similar sampling and ionization techniques. The sample is first thermally desorbed, then ionized using electron impact (EI) ionization, and detected with a quadrupole or a time-of-flight MS (CitationDrewnick et al. 2005; CitationDeCarlo et al. 2006). These techniques allow quantification of non-refractory organic carbon and its speciation into general classes such as more or less oxidized carbonaceous material. But, similar to laser ionization methods, EI uses a high energy of ionization (70 eV) which excessively fragments organic molecules making it difficult to quantify specific molecular species (CitationZhang et al. 2005, Citation2007). However, with programmed desorption, TD-PBMS is able to enhance speciation especially if the aerosol components have a large volatility spectrum (CitationTobias and Ziemann 1999).
As in single particle AMS instruments, recent developments in soft laser ionization methods have been used in those based on bulk analysis. Photoelectron resonance capture ionization MS (PERCI) uses a very low energy pulsed UV laser focused onto a metal surface to generate photoelectrons that ionize analyte molecules. The low energy EI (< 10 eV) coupled with thermal desorption causes minimal fragmentation making it suitable to detect various functional groups in aerosol particles (CitationLaFranchi et al. 2004; CitationLaFranchi and Petrucci 2006). Photoionization AMS (PIAMS) uses IR laser desorption followed by coherent VUV radiation (10.5 eV) for analysis of ensemble aerosol particles. Although some fragmentation is reported due to laser desorption, aliphatic and aromatic compounds have been detected with low detection limits using PIAMS (CitationOktem et al. 2004).
GC/MS has been in use for offline analysis of aerosol samples for several decades (CitationChow et al. 2008). Recently, GC/MS has been successfully used for in-situ analysis of ambient POM (CitationWilliams et al. 2006; CitationGoldstein et al. 2008; CitationKreisberg et al. 2009). The aerosol sample is initially humidified, then pre-concentrated using inertial impaction before thermal desorption and subsequent analysis. Although this approach provides data at the compound level, in-situ quantification of highly oxygenated and polar functional groups can be a challenge due to the need for multiple columns or long separation times.
Thermal desorption followed by chemical ionization MS (CIMS) is another technique that has proven effective in analyzing complex organic aerosol particles (CitationHoffmann et al. 1998; CitationHearn and Smith 2004a; Citation2006; CitationThornberry et al. 2009). Chemical ionization is a soft ionization technique and is well suited for POM in ambient aerosol particles (CitationNash et al. 2006). A semi-continuous technique, recently developed by Smith and co-workers (CitationVoisin et al. 2003; CitationSmith et al. 2004; CitationSmith and Rathbone 2008; CitationHeld et al. 2009), couples CIMS to an electrostatic precipitator for collection of sub-20 nm aerosol particles. They report very low detection limits for sulfate, ammonium and carboxylic acids in Aitken mode but have not yet investigated accumulation mode particles, which are responsible for climate and health effects and where the majority of organic mass resides. CitationHearn and Smith (2006), using a cold trap to concentrate compounds thermally desorbed from aerosol particles, reported detection of non-volatile and semi-volatile organics with various functionalities. Recently, CitationThornberry et al. (2009) developed a semi-continuous technique for particulate organic compounds. They use a single nozzle, under choked flow conditions to impact particles on a post held at low pressures (8–20 torr). The impacted material is flash volatilized and detected with PTR-MS using quadrupole ion trap.
These existing analytical techniques certainly provide a wealth of information on bulk and single particle compositions, greatly improving our knowledge of POM. But other complementary methods are needed to fully acquire a molecular-level understanding of the evolution of POM, its abundance, and speciation in the atmosphere.
A similarity of all techniques aimed at both quantification and speciation of POM at the molecular-level is mass accumulation by pre-collection. This paper describes the development and initial characterization of one such aerosol-collection thermal-desorption technique directly coupled to a selected negative-ion based CIMS, which we designate as the Micro-Orifice Volatilization Impactor (MOVI)-CIMS. The novel features of this method which distinguish it from the previously described techniques include: a multi-orifice aerosol impactor, similar to a single stage microorifice uniform deposited impactor (MOUDI) (CitationMarple et al. 1991), particle accumulation at 85% of ambient pressure (760 torr), the ability to perform programmed thermal desorption or near-flash volatilization, and the use of a selected negative chemical ionization scheme that can improve selectivity and thus molecular specificity. Design details along with various evaluation tests conducted to characterize MOVI-CIMS performance are discussed below.
METHOD DESCRIPTION
The MOVI process has 3 steps: particle collection, volatilization, and chemical analysis. Particle laden sample air is drawn through a custom impactor, collecting particles while monitoring gaseous composition with the CIMS. In the second step, the sample air is replaced with dry ultra high purity (UHP) N2 and simultaneously the collection plate is heated volatilizing the sampled POM. In the third step, specific volatilized species are detected and quantified using CIMS. Below we describe the components and operation involved in these three steps.
Micro-Orifice Impactor
The impaction unit consists of a single stage, multi-jet impactor with 100 nozzles, each having a diameter Dn = 0.15 mm drilled into the blank face of a 1.27 cm OD aluminum rod, bored to 1.06 cm ID. The nozzles are approximately 0.76 mm in length. The collection surface, a 1.17 cm diameter disc machined from brass and soldered to a 1.27 cm OD stainless steel tube, is placed at a distance of < 1 mm (∼ 4Dn) from the nozzle plate. We chose brass for the collection surface because of the combination of its thermal conductivity, coefficient of thermal expansion and relative inertness in an oxidizing atmosphere. A schematic of the MOVI is given in .
FIG. 1 Schematic of the micro-orifice volatilization impactor. Numbers 1–4 correspond to different pressure regions during operation, with region 1 approximately at ambient pressures (760 torr), region 3 at 647 torr and region 4 at 60 torr. This is a 100-nozzle jet impactor with D = 0.15 mm. TC – thermocouple.
Both the nozzle tube and the collection surface tube are fixed relative to one another by means of an aluminum manifold block using Swagelok compression fittings having PTFE ferrules. To reduce the condensation of organic vapors on the inside walls of the manifold block, it is constantly maintained at 75 ± 5°C. Although the PTFE ferrules do not provide perfect thermal insulation, they isolate the impaction surface from the heated manifold block. This isolation along with the cooling provided by the large gas flow has kept the collection surface at 25°C during laboratory sampling. Active cooling of the impaction surface, while not used in this prototype, is readily possible with this design by immersion of the support post in a temperature-controlled bath or by using a thermoelectric cooler (CitationTobias and Ziemann 1999; CitationThornberry et al. 2009).
The manifold block is 2.5 × 3 × 3.8 cm in dimension and has three 0.95 cm (3/8″) NPT female ports. The manifold block and the ion-molecule region (of the CIMS) are separated by a 0.55 mm diameter critical orifice oriented perpendicular to the nozzle flow axis. This critical orifice drops the pressure in the ion-molecule region to 60 Torr and restricts the flow entering the CIMS to 2.0 L min−1. A small diaphragm pump is connected to the third 0.95 cm Swagelok compression fitting on the manifold block and another critical orifice inline to this diaphragm pump, along with the CIMS pump, maintains a total sample flow of 10 L min−1 through the nozzles.
Negative artifacts, due to loss of semivolatile species, are potentially a major limitation for impactors operating at low pressures. Therefore, the goal of this design was to develop an impactor which not only minimizes the pressure drop across the nozzles but also has a low cut-point. For the design and flow conditions above, the pressure drop across the nozzles is only 14.8 ± 0.2% of ambient, resulting in a pressure of 647 ± 2 torr at the collection surface for ambient pressures of 760 torr. Using the sample flow and the pressure drop, the calculated jet velocity is 110 m s−1, Reynolds number (Re) = 991 and the theoretical cut-point (d 50) = 0.140 μ m. The theoretical d 50 is calculated using the critical Stokes number (Stokes number corresponding to 50% collection efficiency) for round-jet impactors (CitationHinds 1999). The cross-flow interferences usually common for multijet impactors are estimated using the expression given by CitationKwon et al. (2002) and are minimal for this design.
During sampling, aerosols are collected on the brass impaction surface, while a portion (2 L min–1) of the total flow is drawn into the IMR region. This CIMS sample flow also likely contains particles below the d 50. The remainder of the total flow is pumped away by a diaphragm pump. In the IMR region, the gas is ionized by the reagent ions and a small part of it (∼ 10%) is sampled into the quadrupole chamber and mass analyzed. After sampling particle-laden air for a predetermined time, a valve between the manifold and the diaphragm pump (not shown in ) closes, dropping the flow rate through the nozzles to that sampled by the CIMS (2 L min–1). This CIMS sample flow is largely dry UHP N2 achieved by overflowing the nozzle tube via a flow controller. Simultaneously, the underside of the impaction surface is resistively heated using a 0.95 cm OD, 5 cm long cartridge heater (200 watts) inserted into the stainless tube and controlled by an Omega temperature controller. The temperature of the impaction surface is monitored using a thermocouple inserted into a notch drilled into the side of the impaction body, just below the surface.
For rapid volatilization, the collection surface is heated for 90 sec, during which the surface temperature is raised to 120 ± 1°C, and the collected POM desorbs into the carrier gas. This method of rapid heating is consistent with other studies (CitationWilliams et al. 2006; CitationThornberry et al. 2009). We chose the maximum desorption temperature by repeatedly impacting (or manually depositing) a constant amount of test organic compounds and increasing the maximum desorption temperature until the relevant CIMS signal passed through a maximum. Some very low vapor pressure material likely remains on the surface of the impactor for our current desorption temperature. However, we prefer to minimize thermal decomposition and degraded CIMS operation observed with very high desorption temperature. After the volatilization cycle, the cartridge heater is turned off and the inline valve is opened again increasing the flow through the nozzles to 10 L min−1. In addition, 2 small AC-powered fans are turned on to aid in the cooling process.
Chemical Ionization Mass Spectrometry (CIMS)
Chemical Ionization (CI) is a technique which has found application in many fields to measure inorganic and organic compounds (CitationJennings 1979; CitationHarrison 1983; CitationArnold and Hauck 1985; CitationBudzikiewicz 1986; CitationViggiano 1993; CitationHuey et al. 1995; CitationHansel et al. 1998; CitationHuey 2006; Citationde Gouw and Warneke 2007). It is sensitive, with pptv or lower detection thresholds possible, and has a fast response limited ultimately by the reaction time in the ion-molecule region. In this present study, we use selected negative ion CIMS (here-on referred to as only CIMS), with I − and SF 6 − as reagent ions to specifically detect organic acids in gas and condensed phases. These reagent ions are in wide use for atmospheric chemistry studies (CitationHuey et al. 1995). The reaction of an organic acid with I − proceeds through ion association and that of SF 6 − is through fluoride (F −) transfer and/or proton transfer
Apart from negative reagent ions, gaseous organic molecules have also been detected using positive ions such as H3O+, O2 +, and NO+ (e.g., CitationHearn and Smith 2004a), among which H3O+ is most widely used for proton-transfer reaction mass spectrometry, PTR-MS (CitationHansel et al. 1998; Citationde Gouw and Warneke 2007). Species with a proton affinity greater than H2O, which includes essentially all oxygenated VOCs (OVOCs), are thus ionized. PTR-MS is quite sensitive, but not entirely selective, making the mass spectra more challenging to interpret if a complex mixture of POM is analyzed as is generally the case for ambient aerosol (CitationHamilton et al. 2004; CitationWilliams et al. 2006). On the other hand, negative reagent ions can be very selective. Using negative ions for specific organic compounds, appreciable sensitivity and selectivity can be achieved. In an earlier study, CitationHearn and Smith (2004a), while testing CIMS for analysis of organic aerosol particles reported that negative reagent ions such as O 2 −, F −, and SF 6 − were less sensitive than the protonated water cluster ion, H + (H 2 O)2, for detection of organic acids. But recently, acetate (CH 3 C(O)O −) ion has been demonstrated for organic acid detection and is reported to have high sensitivity (CitationVeres et al. 2008). Therefore, our future work will involve testing the MOVI-CIMS sensitivity with this new ion for organic acids.
The CIMS approach used in this work, except for the inlet impactor, is similar to that described earlier (CitationMcNeill et al. 2007; CitationKercher et al. 2009). First, the analyte molecules are sampled through a stainless steel orifice at 2.0 L min−1 into an ion-molecule region (IMR), maintained at a pressure of 60 Torr by means of a rotary vane pump, and react with I − or SF 6 − reagent ions. I − ions are generated by flowing 2.0 L min−1 N2 over a permeation tube maintained at 45–50°C containing methyl iodide (CH3I, Acros Organics) and then through a 210Po α -particle radioactive source (NRD model 2021). SF 6 − is produced by adding a trace flow of pure sulfur hexafluoride gas (SF6, Scott Specialty Gases, 99.99%) to 2.0 L min−1 of dry N2 prior to the radioactive source. The α -particle radioactive source is biased to −20 V relative to ground. Product ions are then focused through an orifice biased at −20 V relative to ground into a collisional dissociation chamber (CDC) maintained at 0.75 torr.
Reagent and product ions cluster with water molecules present in the sample gas. Very high [H 2 O] in the IMR can spread the product ions across several m/z associated with different coordination numbers of H 2 O clustered with the parent product ion. Use of a CDC can minimize this effect. Cluster ions are dissociated through collisions with the bath gas enhanced by means of an electric field. The stronger the electric field, the higher the fragmentation of cluster ions. Therefore, care has to be taken not to fragment the parent molecule by using excessively high electric fields. In this study, the optimal electric field was found to be 1.1 V cm−1. Water clusters with analyte ions were not observed and this field maximized the sensitivity for I −/F − organic acid clusters.
The quadrupole mass spectrometer (QMS) is computer controlled by custom lab-view software, which also records and stores the data. Each mass-to-charge (m/z) ratio is counted for 100 ms, leading to a sampling frequency of approximately 1 Hz per m/z during a typical experiment where 10 m/z are monitored simultaneously.
MOVI-CIMS Coupled System
The process of sampling, volatilization, and ion detection is illustrated in . The figure shows a time trace of the ion abundance of two compounds produced during the heterogeneous OH oxidation of palmitic acid (PA, C16H32O2) particles as described by CitationMcNeill et al. (2008). For these experiments the volume weighted mean particle radius was 0.15 μ m with a geometric standard deviation, σ g = 1.35. Example particle size distributions for experiments described herein are given in the supplemental material. The CIMS signal at m/z 100 amu increased during impaction, suggesting that the compound with that m/z had high enough volatility to be present largely in the gas-phase. In contrast, the signal for 270 amu (PA + 14 amu) had much lower volatility, thereby remaining in the condensed-phase and detected only when the collection surface was heated. It is possible that some semivolatile species on particles smaller than the impactor cut point may partition to the gas phase within their transit through the IMR, thereby adding systematic uncertainties to our MOVI-CIMS measurements. Presently we do not have any experimental data to quantify this potential artifact, which will affect all instruments transmitting particles through a low-pressure region. Moreover, the magnitude of such an artifact will be species dependent. We roughly estimate that for a 50 nm particle containing species with vapor pressures of 10−3–10−6 Pa, less than 1% of the mass would volatilize during the 50 ms residence time in the IMR.
FIG. 2 Products observed during the heterogeneous oxidation of Palmitic acid by OH radicals. Signal at an m/z corresponding to an organic acid with a molecular mass of 100 amu (dashed line) was only observed during impaction, suggesting it was entirely in the gas-phase. In contrast, signal at an m/z corresponding to an organic acid with a molecular mass of 270 amu (solid line) was only observed during volatilization after impaction, suggesting it was entirely in the particle phase.
Data Analysis
The signal for each m/z ratio in the condensed-phase is converted to concentration using the procedure described below. shows a schematic of the ion signal from a typical experiment, followed by a blank desorption (sampling particle-free N2) along with a trace indicating the instrument state. First, each ion signal from a volatilization cycle is normalized against the reagent ion signal collected simultaneously in order to account for changes in instrument sensitivity on short timescales (seconds to minutes). Such changes are mainly caused by fluctuations in ion transmission or abundance related to variations in the flow, pressure, or water vapor mixing ratios (CitationKercher et al. 2009). Second, a 10 point running mean filter is applied to the data and the resulting smoothed signal is corrected for baseline noise determined when sampling N2 with the cartridge heater off. Third, the signal under the ion peak is integrated to get the total area (normalized counts).
FIG. 3 An example of palmitic acid peak evolution. The baseline is the region shaded by ![]()
As shown in the , apart from the main initial peak in ion signal, the baseline (typically detector noise) is small, but a non-negligible secondary peak is usually observed upon volatilization. We assume this secondary peak is the contribution from material deposited or adsorped on the inside walls of the manifold block or on the nozzle tube, i.e., surfaces not in direct contact with the heater cartridge. To quantify this contribution, intermittently, particle free dry N2 is analyzed, shown as the “blank signal” peak in the figure. The area under the blank peak is calculated the same way as described above with normalization and smoothing. The blank area is then subtracted from the total integrated sample area. The resulting area is divided by a calibration factor, C f , in normalized counts μ g−1, to convert the observed signal into a deposited mass. This procedure is repeated for all heating cycles and each ion monitored.
METHOD EVALUATION
Particle Collection Efficiency
Particle collection efficiency experiments were performed using monodisperse PA and oleic acid (OA, C18H34O2) aerosol particles (see the supplemental material for aerosol generation and experimental setup). For these experiments the impactor was isolated from the IMR so that the total flow (10 L min−1) goes through the diaphragm pump. shows the collection efficiency curves as a function of particle aerodynamic diameter. As predicted by impaction theory, experimental data for each particle type falls on a single curve with a d 50 of 0.13 μ m. The experimental d 50 is in good agreement with the theoretical estimate of 0.14 μ m based on the impaction design (shown as + in the figure). The critical stokes number is 0.21 and is similar to that suggested for round jet impactors (CitationHinds 1999). For OA particles, the particle collection efficiency exceeds more than 90% for particles with d p ∼ 0.25 μ m and for PA particles with d p ∼ 0.4 μ m. It is assumed that the collection of particles occurs primarily on the impaction surface but total collection inferred from this figure is likely enhanced by the inside walls of the manifold block.
FIG. 4 Collection efficiency curves for oleic (Δ) and palmitic (°) acid aerosol particles. The “+” indicates the estimated theoretical cut-point (d 50) for our impactor.
We hypothesize that the difference between the collection efficiencies of OA and PA aerosol particles is probably due to the difference in particle phase. OA particles are liquid, therefore showing higher particle collection efficiency. On the other hand, pure PA particles may have a rough crystalline morphology resulting in higher particle bounce or shattering, causing lower collection efficiency. Data from the linearity and sensitivity experiments, explained in the next section, provides additional support for particle bounce as a reason for differences in PA and OA collection. We presently do not have a good explanation for the higher collection efficiency of PA aerosol particles at lower sizes. This effect was very reproducible and may indicate a bias in our estimated aerodynamic diameters for PA particles, which, for simplicity, we assumed to be spherical.
Linearity and Sensitivity
The MOVI-CIMS linearity and sensitivity were assessed for organic acids using PA, OA, and azelaic acid (AA, C9H16O4) as representative compounds. Two different methods were used for these experiments. In the first, homogeneously nucleated, polydisperse PA and OA aerosol particles with volume weighted mean radius r p = 0.33 and 0.16 μ m and σ g = 1.2 and 1.25, respectively, were sampled (see Figure S1 in the supplemental material). Aerosol generation is similar to that described in the previous section. To vary the amount of collected mass, the particle sampling time was varied from 45 to 210 s while the particle mass concentration was maintained at a relatively constant value. A differential mobility analyzer/condensation particle counter (DMA/CPC, Grimm technologies) was used to monitor the size and number distribution during the sampling cycle. For chemical ionization we used I − as the reagent ion in these experiments.
The second method relied on direct deposition of a solution, containing individual organic acid in acetone, on the collection surface using a microliter syringe. The concentrations were 0.4 and 0.6 mM for PA and OA solutions, respectively. AA was also tested once to estimate the sensitivity of the method for dicarboxylic acids with a 0.9 mM solution. After deposition, the manifold block was reassembled and the collection surface was pre-heated at 33°C for 15 min. The cartridge heater was then ramped for 90 s to vaporize the deposited sample. This procedure was repeated, varying the amount of solution deposited on the collection surface to span a range in the organic acid mass on the impactor.
The ion peak area versus sampled and deposited organic acid mass is shown in . Both PA and OA peak areas are linear with sample mass over the range studied. This linearity indicates minimal post depositional losses at longer sampling times. In addition to the linear relationship, we observed differences for impacted and deposited samples of PA and OA. The possible reasons for these differences are discussed below.
FIG. 5 Normalized peak areas as a function of organic acid mass deposited using a syringe (open symbols) and aerosol particle impaction (filled symbols) for palmitic, oleic, and azelaic acids. The lines are least-squares fits to the data.
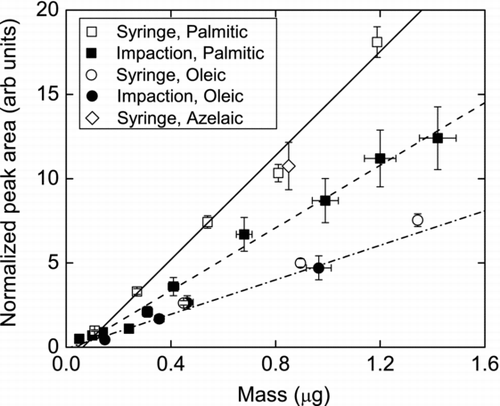
For PA, the area from syringe deposition is higher than that from impaction for the same amount of mass exposed to the collection surface. If we treat syringe deposition as a 100% collection efficiency case, then the PA data shows that there is approximately 35% loss of mass due to either lower collection efficiency or particle bounce. Based on the mean geometric size of the PA aerosol particles used during the impaction experiments we expect a collection efficiency of more than 95%. Therefore, we conclude that particle bounce is the main reason for the discrepancy between the deposited and impacted PA.
Particle bounce is a concern with impaction methods, especially for dry collection surfaces (CitationLai et al. 2008). It can be minimized by greasing the collection surface, so long as the grease does not interfere with chemical analysis, or by humidifying the sample air stream before impaction (CitationWilliams et al. 2006). Humidification of the sample stream may further improve the collection efficiency of the MOVI-CIMS, as long as the particles are hygroscopic.
For OA, we observe good agreement between deposited and impacted mass indicating minimal bounce, as expected for liquid particles. But the integrated area is lower than that for PA possibly due to two reasons: (1) decomposition of OA prior to or upon heating or (2) lower transmission efficiency of larger molecules in the quadrupole region. The first possibility is reasonable in the sense that OA stored for extended periods is known to degrade through light or oxidant mediated processes. The OA used here was 5 years old and not purified. The second possible reason for the low sensitivity of OA may be related to the transmission efficiency for larger m/z molecules in a QMS. The mass transmission of a QMS decreases exponentially, due to fringing field effects, and reaches 20% by m/z 205 (CitationKim et al. 2009). Although the above-mentioned study was done with a different quadrupole, we assume that this effect occurs in CIMS quadrupole. At this time we speculate that some combination of the above two reasons accounts for the different sensitivities to PA and OA.
The calibration factor, C f , for condensed-phase organic acids is the slope of the least squares fit to the calibration data shown in . Using I − as the reagent ion, the calculated C f for impacted and syringe deposited PA is 0.9 ± 0.03 and 1.5 ± 0.1 normalized counts μ g−1, respectively, and 0.5 ± 0.08 normalized counts μ g− 1 for OA. Azelaic acid, a straight-chain dicarboxylic acid, yielded the same sensitivity as the saturated monocarboxylic acid, PA. The agreement between PA and AA sensitivities, in contrast to that observed for OA, is more consistent with our expectations about the iodide ion chemistry, i.e., similar sensitivities towards most carboxylic acids.
Precision and Accuracy
We estimate the precision of the method by using replicate experiments involving PA impaction. The error bars in indicate the typical 1σ deviation in signal obtained while sampling a constant PA mass concentration. For this data, dry N2 flow containing constant aerosol number concentration was sampled and analyzed by the MOVI-CIMS three times, with the collection time remaining constant. Volatilization followed by CIMS detection was as described before. The fluctuations in aerosol concentration were ∼ 5%, resulting in a 1σ error of 0.05 normalized counts μ g−1 for area calculation. Using these estimates we calculate a relative precision of 15% for our measurements.
Ideally, the accuracy of our method could be tied to the accuracy of known standards of organic compounds in aerosol particles. By performing calibrations similar to that described above we can quantify possible biases and correct them, thereby improving accuracy. Here we estimate the total uncertainty in the calculated mass from the measured signal using errors in the calibration data (shown in ) as an estimate of the accuracy. For signals measured by the MOVI-CIMS for which there is no standard available, we would then extrapolate this uncertainty assuming that the chemical ionization signal is similar for similar acid amounts.
For estimating uncertainty, the data from PA and OA impaction experiments is plotted as signal versus mass (instead of mass versus signal) and a linear least squares line is fit to that data. The mass concentration (M) of a compound of interest in a collected sample is given by the expression
Detection Limit
The detection limit for organic acids calculated using the data similar to that shown in and the expression
Using the measured sensitivity (C f ) with our current laboratory CIMS instrument, σtotal calculated above, and a signal-to-noise ratio (S/N) of 2, detection limits of 80 ± 10 and 120 ± 20 ng are obtained with the deposited and impacted PA, respectively. For the OA sensitivity reported here, we estimate a somewhat higher detection limit than that calculated above. The values reported here are based on a typical sample rate for 10 individual m/z, each scanned for 100 ms. Beyond this number of m/z the detection limit decreases approximately by 1/√N, where N is the number of m/z monitored, for a constant dwell time (100 ms).
Our field-deployable CIMS instrument used for measurement of gas-phase nitrogen oxides and halogen species (CitationWolfe et al. 2007; CitationKercher et al. 2009) exhibits 10× larger sensitivity towards these species than the laboratory CIMS described here. Not wanting to unnecessarily contaminate the field system, we have refrained from using the MOVI apparatus on it. But, assuming we would achieve a factor of 10 in sensitivity on that system, we estimate the detection limits for straight-chain, saturated mono- and dicarboxylic acids to be ∼ 8–12 ng on our field system. Presently, we are in the process of converting the laboratory CIMS into a more sensitive version.
METHOD APPLICATION
To assess the performance of the MOVI-CIMS technique we performed two sets of experiments (a) vapor pressure measurements of PA, OA, and AA using temperature programmed desorption (TPD) similar to those described by Cappa et al. (Citation2007, Citation2008a), and (b) heterogeneous oxidation of OA aerosol particles by ozone. These tests allow comparison of the results obtained with our technique to those obtained by independent investigations and instruments.
Vapor Pressure Measurement using TPD
One of the key parameters that is needed to model the partitioning of organic compounds between gas and aerosol phases is their saturation vapor pressure (CitationPankow 1994a, Citation1994b). Vapor pressure, and therefore partitioning of a compound, is affected by many factors such as temperature, solubility in water, number of carbons, functional groups, and its mole fraction (CitationGoldstein and Galbally 2007). There is limited experimental data for low volatility and semi-volatile compounds that partition into the aerosol phase, and even for those that have been studied, the reported values differ by more than 2 orders of magnitude (CitationChattopadhyay and Ziemann 2005; CitationCappa et al. 2007, Citation2008a). Therefore, below we describe some initial experiments performed with PA, OA, and AA to test the performance of the MOVI-CIMS technique to measure vapor pressures of compounds using TPD. (Details of data analysis used to calculate the enthalpy and entropy of sublimation and vaporization (Δ H sub 0,Δ S sub 0,Δ H vap 0 Δ S vap 0) are presented in the supplemental material.)
shows sample mass spectral signals as a function of desorption temperature and shows ln(p 0(T)) verses 1000/RT for the three organic acids. The vapor pressures measured in this study for all the three acids are within a factor of 2 of those measured by Cappa et al. (Citation2007, Citation2008a), but about 1 to 2 orders of magnitude lower than other previous measurements (CitationTao and McMurry 1989; Citationda Silva et al. 1999; CitationBilde et al. 2003; CitationChattopadhyay and Ziemann 2005). Whereas, Δ H sub 0 and Δ S sub 0 are within the range reported in the literature. CitationCappa et al. (2007) suggested that the higher vapor pressures observed in previous studies (CitationTao and McMurry 1989; Citationda Silva et al. 1999; CitationBilde et al. 2003; CitationChattopadhyay and Ziemann 2005) were due to the presence of residual solvent molecules in the bulk, from aerosol generation schemes. The residual solvent molecules increase the measured p sub 0 (298K) by increasing the evaporation flux at lower temperatures. To avoid this, Cappa et al. pre-heated the deposited aerosol sample for 30 min at 70°C prior to thermal desorption. In our study we use homogeneous nucleation to deposit pure organic acid aerosol particles, and therefore remove any such potential positive biases, leading to similar results to that of Cappa et al. (Citation2007, Citation2008a). Our values were determined from measurements made at 647 torr, while those of Cappa et al. were made at 0.5–0.7 torr. The agreement between the two techniques suggests possible diffusion related effects were negligible.
FIG. 6 (a) Azelaic acid (♦), Palmitic acid (°), and Oleic acid (Δ) mass spectral signals as a function of impaction surface (desorption) temperature, and (b) ln(p 0) vs 1000/RT curves for the same acids. The solid lines indicate the region of the curve used for least-squares regression.
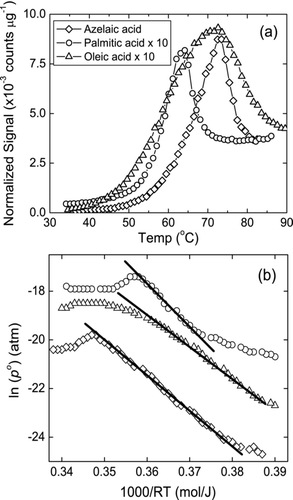
Comparing to the values reported by Cappa et al. (Citation2007, Citation2008a) (shown as the second number in ), the p sub 0 (298K) calculated for PA and AA is 48 and 36% lower. Although this difference seems large, it is much smaller than the range reported in the literature for these two acids. For OA, p Liq 0 (298K) and its associated thermodynamic parameters are in excellent agreement to that reported by CitationCappa et al. (2008a), although lower than that calculated by SPARC (6.7 × 10⁻⁶ Pa) and Yaws (6.7 × 10⁻⁵ Pa) (CitationYaws 2003; CitationHilal et al. 2007).
TABLE 1 Vapor pressures and thermodynamic parameters for palmitic, azelaic, and oleic acids at 298 K and 1 atm measured using the MOVI-CIMS. The uncertainty reported is 1σ calculated from n individual experiments
One feature that is observed in is the long tail at high temperatures for PA. A possible reason for this tailing may be physical or chemical interactions of long-chain organic molecules with the bare brass collection surface. CitationChattopadhyay and Ziemann (2005) reported that pentadecanoic acid (C15H30O2), when deposited on gold surfaces, desorbed at a higher temperature with a long tail in the desorption profile. To overcome this artifact, they coated the aerosol collection surface with Kisscote (a hydrophobic polymer, KISS Polymers LLC, Tampa) and observed lower desorption temperatures and no change in sample peak. Therefore, our future improvements will likely involve similarly coating the collection surface.
The above experiments and comparisons indicate that this method can be successfully used in SOA chamber and field experiments to determine the vapor pressure and other thermodynamic parameters of compounds in POM.
Ozonolysis of Unsaturated Organic Aerosol Particles
As a means to study the advantages and disadvantages of the MOVI-CIMS as a tool for laboratory/chamber studies of POM processing, we performed an array of experiments probing the reactive uptake of ozone (O3) on liquid OA aerosol particles. This reaction has become a standard benchmark against which new methods are assessed (CitationZahardis and Petrucci 2007). A description of the experimental apparatus and information related to the kinetic analysis of the results is supplied in the supplemental material.
shows the loss of OA as a function of O3 exposure for aerosol particles having a volume-weighted mean mobility radius of 93 nm. The straight line is the model fit, which assumes that the reacto-diffusive length is much smaller than the particle diameter (see supplemental material).
FIG. 7 Oleic acid decay as a function of ozone exposure for volume-weighted mean particle radius of 93 nm. Experimental data obtained using the MOVI-CIMS system are plotted as square root of the ratio OA/OA0 (Δ) along with the model (dashed line) from Worsnop et al. (2002).
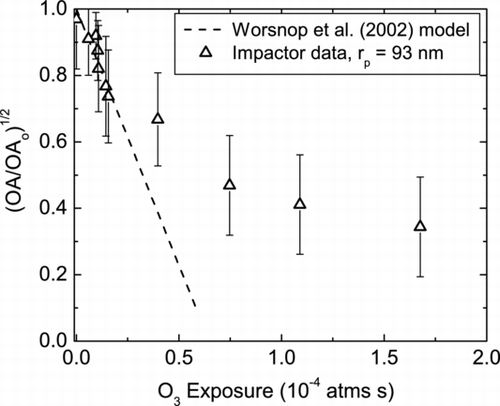
The value of the ozone-particle reaction probability, γ O 3 , calculated from the kinetic model is (8.1 ± 3) × 10− 4. This value is similar to that obtained by other OA-O3 kinetic studies (CitationMoise and Rudich 2002; CitationThornberry and Abbatt 2004; CitationHearn and Smith 2004b; CitationHearn 2005; CitationKnopf et al. 2005; CitationZiemann 2005; CitationSage et al. 2009). CitationHearn and Smith (2004b) measured γ O 3 = (7.5 ± 1.2) × 10−4 for particle sizes ranging from 0.8 to 1.5 μ m with a maximum O3 exposure of 5 × 10⁻⁴ atm s. Both CitationMoise and Rudich (2002), and CitationThornberry and Abbatt (2004) using OA coated tubes and measuring the loss of gas-phase O3 with a CIMS reported γ O 3 = (8.3 ± 0.2) × 10−4 and (8.0 ± 1) × 10−4, respectively. CitationMorris et al. 2002) using an aerosol mass spectrometer measured γ O 3 = (1.6 ± 0.2) × 10−3 on particles of sizes 0.2 to 0.6 μ m. CitationZiemann (2005) reported observing γ O 3 = (6.1 ± 5) × 10−4 using 0.2 μ m particles and the TD-PBMS. Therefore, this study which uses smaller particles than others indicates that for monitoring the same chemical process, i.e., ozonolysis, the MOVI-CIMS technique yields results that are similar to those obtained by independent groups using unrelated instruments.
The decrease in oleic acid loss rate observed at higher ozone exposures has been reported by several studies and is characteristic of this reaction. Hearn et al. (2007) suggest that oleic acid-O3 reaction is mainly limited to the surface of the aerosol particle due to the orientation of the oleic acid molecule as a closely spaced, “quasi-smectic” structure. They postulate that this structure limits O3 diffusion into the oleic acid particle decreasing γ O 3 . More recently, CitationSage et al. (2009) indicate that the decrease in γ O 3 is due to the decreasing oleic acid mass fraction (mass concentration of oleic acid/mass concentration of organic aerosol) which decreases the second order reaction rate between O3 and oleic acid within the particle volume, and thus γ O 3 .
shows the evolution of three major OA oxidation products, 9-Oxononanoic acid, nonanoic acid, and AA as a function of O3 exposure from the MOVI-CIMS experiments. Organic peroxides and nonanal are other products commonly observed from heterogeneous ozonolysis of OA (CitationZiemann 2005; CitationZahardis and Petrucci 2007). But due to the ion chemistry used in this study only acids are detected. AA has been reported to have a much smaller yield, 1–6%, than the other 3 products, consistent with the relative signals shown in . Since we did not calibrate CIMS for any of the products during this test phase, we do not know the sensitivity for these compounds and therefore do not calculate their absolute yields from the data. But, the instrument sensitivity is likely similar for 9-Oxononanoic acid, nonanoic acid and AA so we can calculate their relative yields.
FIG. 8 Major condensed-phase products observed during oleic acid ozonolysis using the MOVI-CIMS apparatus; 9-Oxononanoic acid (°), nonanoic acid (°), and azelaic acid (Δ) plotted versus increasing ozone exposures.
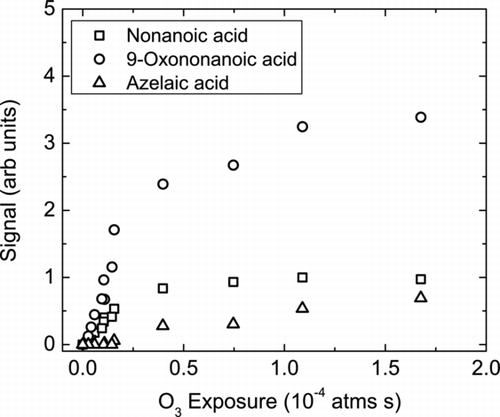
As shown in , 9-Oxononanoic acid has a relative yield approximately 3.5 times that of nonanoic acid and 5 times that of AA, which is consistent with other literature reports (CitationZahardis and Petrucci 2007). One interesting point is that we observe nonanoic acid in the particle phase (CitationZiemann 2005), which is puzzling as nonanoic acid is much more volatile than the other products. We presently do not have a good explanation for this observation but it is consistent with earlier experiments by our group using a completely different detection method (CitationMcNeill et al. 2007).
SUMMARY
NI-CIMS is typically very selective, allowing the detection of compounds containing only specific functional groups. Although its specificity is an advantage in that it reduces the inherent complexity of compound identification, this trait can also be viewed as a limitation in that it cannot be used for identification of all the compounds present in ambient aerosol particles. The MOVI-CIMS technique has shown good reliability, especially for sampling liquid particles, and proved to be a useful tool for simultaneously characterizing gas and condensed phases of laboratory generated reaction mixtures. The impactor design allows high flow rates (10 L min−1), making it suitable for in-situ analysis on the hourly timescale. The experimental cut-point is 0.13 μ m and compares well with the theoretically predicted value of 0.14 μ m. Using I − as reagent ion, the detection limit for monocarboxylic acids using our lower sensitivity laboratory-based CIMS is estimated to be 80 ± 10 ng. Future experiments will be performed with other reagent ions and a CIMS instrument that is likely 10× more sensitive.
Temperature-programmed desorption experiments using MOVI-CIMS were conducted to calculate the vapor pressure and thermodynamic parameters of PA, OA, and AA. The Δ H sub 0 and Δ S sub 0 obtained are within the range reported by various studies for PA and AA, whereas the Δ H vap 0 and Δ S vap 0 for OA agreed very well to the most recent estimate of CitationCappa et al. (2008a). The calculated vapor pressures for PA and AA are generally lower than the recent estimate. Nevertheless, these experiments support the use of this technique for vapor pressure determination of complex mixtures of POM.
The kinetics of the heterogeneous oxidation of OA by O3 was also investigated using the MOVI-CIMS. The reaction probability, γ O 3 , was inferred to be (8.1 ± 3) × 10−4, similar to that reported by various studies. While our focus so far has been to characterize the technique, and not to determine the yields of gas- and condensed-phase products or their vapor pressures, such studies will be part of future research. More over, our approach should allow facile quantification of many functionalized organic species, in the gas and particulate phase, during chamber or laboratory studies of POM evolution.
uast_a_438201_sup_11784120.zip
Download Zip (57.3 KB)Acknowledgments
The MOVI-CIMS development was funded in large part by the National Science Foundation (NSF-ATM-0633897) and a NASA Earth and Space Science Graduate Fellowship (07-Earth07F-0069) for R.L.N.Y. The authors would like to thank Chris Stipe of the Seattle University for lending us the TSI DMA and CPC units, and Timothy Bertram (now at the University of California, San Diego) and Dean Hegg (University of Washington) for helpful comments on the article.
[Supplementary materials are available for this article. Go to the publisher's online edition of Aerosol Science and Technology to view the free supplementary files.]
Notes
a The second number shown for each compound is either measured by or calculated using the data given by Cappa et al. (Citation2007, Citation2008a, Citation2008b).
b Number of experiments.
c Temperature range considered for the calculations. Note that palmitic and azelaic acids are solids at room temperature, whereas oleic acid is a liquid.
Related Research Data
REFERENCES
- Andreae , M. O. and Crutzen , P. J. 1997 . Atmospheric Aerosols: Biogeochemical Sources and Role in Atmospheric Chemistry . Science , 276 : 1052 – 1058 .
- Arnold , F. and Hauck , G. 1985 . Lower Stratosphere Trace Gas Detection Using Aircraft-Borne Active Chemical Ionization Mass Spectrometry . Nature , 315 : 307 – 309 .
- Bilde , M. , Svenningsson , B. , Monster , J. and Rosenorn , T. 2003 . Even-Odd Alternation of Evaporation Rates and Vapor Pressures of C3–C9 Dicarboxylic Acid Aerosols . Environ. Sci. Technol. , 37 : 1371 – 1378 .
- Budzikiewicz , H. 1986 . Negative Chemical Ionization (NCI) of Organic Compounds . Mass. Spec. Rev. , 5 : 345 – 380 .
- Caldwell , G. W. , Masucci , J. A. and Ikonomou , M. G. 1989 . Negative Ion Chemical Ionization Mass Spectrometry—Binding of Molecules to Bromide and Iodide Anions . Org. Mass Spec. , 24 : 8 – 14 .
- Cappa , C. D. , Lovejoy , E. R. and Ravishankara , A. R. 2007 . Determination of Evaporation Rates and Vapor Pressures of Very Low Volatility Compounds: A Study of the C–C and C Dicarboxylic Acids . J. Phys. Chem. A , 111 : 3099 – 3109 .
- Cappa , C. D. , Lovejoy , E. R. and Ravishankara , A. R. 2008a . Evaporation Rates and Vapor Pressures of the Even-Numbered C-C Monocarboxylic Acids . J. Phys. Chem. A , 112 : 3959 – 3964 .
- Cappa , C. D. , Lovejoy , E. R. and Ravishankara , A. R. 2008b . Evidence for Liquid-Like and Nonideal Behavior of a Mixture of Organic Aerosol Components . PNAS , 105 : 18687 – 18691 .
- Chattopadhyay , S. and Ziemann , P. J. 2005 . Vapor Pressures of Substituted and Unsubstituted Monocarboxylic and Dicarboxylic Acids Measured Using an Improved Thermal Desorption Particle Beam Mass Spectrometry Method . Aerosol Sci. Technol. , 39 : 1085 – 1100 .
- Chow , J. C. 1995 . Measurement Methods to Determine Compliance With Ambient Air-Quality Standards for Suspended Particles . J. Air & Waste Manage. Assoc. , 45 : 320 – 382 .
- Chow , J. C. , Doraiswamy , P. , Watson , J. G. , Chen , L. W.A. , Ho , S. S. H. and Sodeman , D. A. 2008 . Advances in Integrated and Continuous Measurements for Particle Mass and Chemical Composition . J. Air & Waste Manage. Assoc. , 58 : 141 – 163 .
- da Silva , M. A. V. R. , Monte , M. J. S. and Ribeiro , J. R. 1999 . Vapor Pressures and the Enthalpies and Entropies of Sublimation of Five Dicarboxylic Acids . J. Chem. Thermodynamics , 31 : 1093 – 1107 .
- de Gouw , J. A. , Brock , C. A. , Atlas , E. L. , Bates , T. S. , Fehsenfeld , F. C. , Goldan , P. D. , Holloway , J. S. , Kuster , W. C. , Lerner , B. M. , Matthew , B. M. , Middlebrook , A. M. , Onasch , T. B. , Peltier , R. E. , Quinn , P. K. , Senff , C. J. , Stohl , A. , Sullican , A. P. , Trainer , M. , Warneke , C. , Weber , R. J. and Williams , B. J. 2008 . Sources of Particulate Matter in the Northeastern United States in Summer: 1. Direct Emissions and Secondary Formation of Organic Matter in Urban Plumes . J. Geophys. Res. , 113 doi:10.1029/2007JD009243
- de Gouw , J. A. , Middlebrook , A. M. , Warneke , C. , Goldan , P. D. , Kuster , W. C. , Roberts , J. M. , Fehsenfeld , F. C. , Worsnop , D. R. , Canagaratna , M. R. , Pszenny , A. A. P. , Keene , W. C. , Marchewka , M. , Bertman , S. B. and Bates , T. S. 2005 . Budget of Organic Carbon in a Polluted Atmosphere: Results from the New England Air Quality Study in 2002 . J. Geophys. Res. , 110 doi:10.1029/2004JD005623
- de Gouw , J. A. and Warneke , C. 2007 . Measurements of Volatile Organic Compounds in the Earth's Atmosphere Using Proton-Transfer-Reaction Mass Spectrometry . Mass. Spec. Rev. , 26 : 223 – 257 .
- DeCarlo , P. F. , Kimmel , J. R. , Trimborn , A. , Northway , M. J. , Jayne , J. T. , Aiken , A. C. , Gonin , M. , Fuhrer , K. , Horvath , T. , Docherty , K. S. , Worsnop , D. R. and Jimenez , J. L. 2006 . Field-Deployable, High-Resolution, Time-of-Flight Aerosol Mass Spectrometer . Anal. Chem. , 78 : 8281 – 8289 .
- Drewnick , F. , Hings , S. S. , DeCarlo , P. F. , Jayne , J. T. , Gonin , M. , Fuhrer , K. , Weimer , S. , Jimenes , J. L. , Demerjian , K. L. , Borrmann , S. and Worsnop , D. R. 2005 . A New Time-of-Flight Aerosol Mass Spectrometer (TOF-AMS)—Instrument Description and First Field Deployment . Aerosol Sci. Technol. , 39 : 637 – 658 .
- Fuzzi , S. , Andreae , M. O. , Huebert , B. J. , Kulmala , M. , Bond , T. C. , Boy , M. , Doherty , S. J. , Guenther , A. , Kanakidou , M. , Kawamura , K. , Kerminen , V.-M. , Lohmann , U. , Russell , L. M. and Poschl , U. 2006 . Critical Assessment of the Current State of Scientific Knowledge, Terminology, and Research Needs Concerning the Role of Organic Aerosols in the Atmosphere, Climate and Global Change . Atmos. Chem. Phys. , 6 : 2017 – 2038 .
- Goldstein , A. H. and Galbally , I. E. 2007 . Known and Unexplored Organic Constituents in the Earth's Atmosphere . Environ. Sci. Technol. , : 1515 – 1521 .
- Goldstein , A. H. , Worton , D. R. , Williams , B. J. , Susanne , V. H. , Kreisberg , N. M. , Panic , O. and Gorecki , T. 2008 . Thermal Desorption Comprehensive Two-Dimensional Gas Chromatography for In-Situ Measurements of Organic Aerosols . J. Chroma. , 1186 : 340 – 347 .
- Hamilton , J. F. , Webb , P. J. , Lewis , A. C. , Hopkins , J. R. , Smith , S. and Davy , P. 2004 . Partially Oxidised Organic Components in Urban Aerosol Using GCXGC-TOF/MS . Atmos. Chem. Phys. , 4 : 1279 – 1290 .
- Hansel , A. , Jordan , A. , Warneke , C. , Holzinger , R. and Lindinger , W. 1998 . Improved Detection Limit of the Proton-Transfer Reaction Mass Spectrometer: On-Line Monitoring of Volatile Organic Compounds at Mixing Ratios of a Few pptv . Rapid Commun. Mass Spectrom. , 12 : 871 – 875 .
- Harrison , G. A. 1983 . Chemical Ionization Mass Spectrometry , 22 – 29 . Boca Roton : CRC Press .
- Heald , C. L. , Jacob , D. J. , Park , R. J. , Russell , L. M. , Huebert , B. J. , Seinfeld , J. H. , Liao , H. and Weber , R. J. 2005 . A Large Organic Aerosol Source in the Free Troposphere Missing From Current Models . Geophys. Res. Lett. , 32 doi:10.1029/2005GL023831
- Hearn , J. D. 2005 . Ozonolysis of Oleic Acid Particles: Evidence for a Surface Reaction and Secondary Reactions Involving Criegee Intermediates . Phy. Chem. Chem. Phys. , 7 : 501 – 511 .
- Hearn , J. D. and Smith , G. D. 2004a . A Chemical Ionization Mass Spectrometry Method for the Online Analysis of Organic Aerosols . Anal. Chem. , 76 : 2820 – 2826 .
- Hearn , J. D. and Smith , G. D. 2004b . Kinetics and Product Studies for Ozonolysis Reactions of Organic Particles using Aerosol CIMS . J. Phys. Chem. A , 108 : 10019 – 10029 .
- Hearn , J. D. and Smith , G. D. 2006 . Reactions and Mass Spectra of Complex Particles Using Aerosol CIMS . Int. J. Mass. Spectrom. , 258 : 95 – 103 .
- Held , A. , Rathbone , G. J. and Smith , J. N. 2009 . A Thermal Desorption Chemical Ionization Ion Trap Mass Spectrometer for the Chemical Characterization of Ultrafine Aerosol Particles . Aerosol Sci. Technol. , 43 : 264 – 272 .
- Hilal , S. H. , Carreira , L. A. and Karickhoff , S. W. 2007 . SPARC v 4.2 http://ibmlc2.chem.uga.edu.sparc/June 12, 2009
- Hinds , W. C. 1999 . Aerosol Technology: Properties, Behavior, and Measurements of Airborne Particles , 126 New York : John Wiley & Sons Inc. .
- Hoffmann , T. , Bandur , R. , Marggraf , U. and Linscheid , M. 1998 . Molecular Composition of Organic Aerosols Formed in the α -pinene/O3 Reaction: Implication for New Particle Formation Processes . J. Geophys. Res. , 103 : 25569 – 25578 .
- Huey , L. G. 2006 . Measurement of Trace Atmospheric Species by Chemical Ionization Mass Spectrometry: Speciation of Reactive Nitrogen and Future Directions . Mass. Spec. Rev. , 26 : 166 – 184 .
- Huey , L. G. , Hanson , D. R. and Howard , C. J. 1995 . Reaction of SF6− and I− with Atmospheric Trace Gases . J. Phys. Chem. A , 99 : 5001 – 5008 .
- Jayne , J. T. , Leard , D. C. , Zhang , X. , Davidovits , P. , Smith , K. A. , Kolb , C. E. and Worsnop , D. 2000 . Development of an Aerosol Mass Spectrometer for Size and Composition Analysis of Submicron Particles . Aerosol Sci. Technol. , 33 : 49 – 70 .
- Jennings , K. R. 1979 . Negative Ions . Phil. Trans. R. Soc. Lond. A. , 293 : 125 – 133 .
- Johnson , D. , Utembe , S. R. , Jenkin , M. J. , Derwent , R. G. , Hayman , G. D. , Alfarra , M. R. , Coe , H. and McFiggans , G. 2006 . Simulating Regional Scale Secondary Organic Aerosol Formation During the TORCH 2003 Campaign in the Southern UK . Atmos. Chem. Phys. , 6 : 403 – 418 .
- Kanakidou , M. , Seinfeld , J. H. , Pandis , S. N. , Barnes , I. , Dentener , F. J. , Facchini , M. C. , Van Dingenen , R. , Ervens , B. , Nenes , A. , Nielsen , C. J. , Swietlicki , E. , Putaud , J. P. , Balkanski , Y. , Fuzzi , S. , Horth , J. , Moortgat , G. K. , Winterhalter , R. , Myhre , C. L. E. , Tsigaridis , K. , Vignati , E. , Stephanou , E. G. and Wilson , J. 2005 . Organic Aerosol and Global Climate Modeling: A Review . Atmos. Chem. Phys. , 5 : 1053 – 1123 .
- Kercher , J. P. , Riedel , T. P. and Thornton , J. A. 2009 . Chlorine Activation by N2O5: Simultaneous, in-situ Detection of ClNO2 and N2O5 by Chemical Ionization Mass Spectrometry . Atmos. Meas. Tech. , 2 : 193 – 204 .
- Kim , S. , Karl , T. , Helmig , D. , Daly , R. , Rasmussen , R. and Guenther , A. 2009 . Measurement of Atmospheric Sesquiterpenes by Proton Transfer Reaction-Mass Spectrometry (PTR–MS) . Atmos. Meas. Tech. , 2 : 99 – 112 .
- Kleinman , L. I. , Springston , S. R. , Daum , P. H. , Lee , Y.-N. , Nunnermacker , L. J. , Senum , G. I. , Wang , J. , Weinstein-Lloyd , J. , Alexander , M. L. , Hubbe , J. , Ortega , J. , Canagaratna , M. R. and Jayne , J. T. 2008 . The Time Evolution of Aerosol Composition Over the Mexico City Plateau . Atmos. Chem. Phys. , 8 : 1559 – 1575 .
- Knopf , D. A. , Anthony , L. M. and Bertram , A. K. 2005 . Reactive Uptake of O3 by Multicomponent and Multiphase Mixtures Containing Oleic Acid . J. Phys. Chem. A , 109 : 5579 – 5589 .
- Kreisberg , N. M. , Hering , S. V. , Williams , B. J. , Worton , D. R. and Goldstein , A. H. 2009 . Quantification of Hourly Speciated Organic Compounds in Atmospheric Aerosols, Measured by an In-Situ Thermal Desorption Aerosol Gas Chromatograph (TAG) . Aerosol Sci. Technol. , 43 : 38 – 52 .
- Kwon , S. B. , Kim , M. C. and Lee , K. W. 2002 . Effects of Jet Configuration on the Performance of Multi-Nozzle Impactors . J. Aerosol Sci. , 33 : 859 – 869 .
- LaFranchi , B. W. and Petrucci , G. A. 2006 . A Comprehensive Characterization of Photoelectron Resonance Capture Ionization Aerosol Mass Spectrometry for the Quantitative and Qualitative Analysis of Organic Particulate Matter . Int. J. Mass Spec. , 258 : 120 – 133 .
- LaFranchi , B. W. , Zahardis , J. and Petrucci , G. A. 2004 . Photoelectron Resonance Capture Ionization Mass Spectrometry: A Soft Ionization Source for Mass Spectrometry of Particle-Phase Organic Compounds . Rapid Commun. Mass Spectrom. , 18 : 2517 – 2521 .
- Lai , C.-Y. , Huang , S.-H. , Chang , C.-P. and Jia-Yun , L. 2008 . Reducing Particle Bounce and Loading Effect for a Multi-Hole Impactor . Aerosol Sci. Technol. , 42 : 114 – 122 .
- Lake , D. L. , Tolocka , M. P. , Wexler , A. S. and Johnston , M. V. 2003 . Mass Spectrometry of Individual Particles Between 50 and 750 nm in Diameter at the Baltimore Supersite . Environ. Sci. Technol. , 37 : 3268 – 3274 .
- Marple , V. A. , Rubow , K. L. and Behm , S. M. 1991 . A Microorifice Uniform Deposit Impactor (MOUDI): Description, Calibration, and Use . Aerosol Sci. Technol. , 14 : 434 – 446 .
- McNeill , V. F. , Wolfe , G. M. and Thornton , J. A. 2007 . The Oxidation of Oleate in Submicron Aqueous Salt Aerosols: Evidence of a Surface Process . J. Phys. Chem. A , 111 : 1073 – 1083 .
- McNeill , V. F. , Yatavelli , R. L. N. , Thornton , J. A. , Stipe , C. B. and Landgrebe , O. 2008 . Heterogeneous OH Oxidation of Palmitic Acid in Single Component and Internally Mixed Aerosol Particles: Vaporization and the Role of Particle Phase . Atmos. Chem. Phys. , 8 : 5465 – 5476 .
- Mochida , M. , Miyakawa , T. , Takegawa , N. , Morino , Y. , Kawamura , K. and Kondo , Y. 2008 . Significant Alteration in the Hygroscopic Properties of Urban Aerosol Particles by the Secondary Formation of Organics . Geophys. Res. Lett. , 35 doi:10.1029/2007GL031310
- Moise , T. and Rudich , Y. 2002 . Reactive Uptake of Ozone by Aerosol-Associated Unsaturated Fatty Acids: Kinetics, Mechanism, and Products . J. Phys. Chem. A , 106 : 6469 – 6476 .
- Morris , J. W. , Davidovits , P. , Jayne , J. T. , Jimenez , J. L. , Shi , Q. , Kolb , C. E. , Worsnop , D. R. , Barney , W. S. and Cass , G. 2002 . Kinetics of Submicron Oleic Acid Aerosols with Ozone: A Novel Aerosol Mass Spectrometric Technique . Geophys. Res. Lett. , 29 doi:10.1029/2002GL014692
- Murphy , D. M. , Cziczo , D. J. , Froyd , K. D. , Hudson , P. K. , Matthew , B. M. , Middlebrook , A. M. , Peltier , R. E. , Sullivan , A. P. , Thomson , D. S. and Weber , R. J. 2006 . Single-Particle Mass Spectrometry of Tropospheric Aerosol Particles . J. Geophys. Res. , 111 doi:10.1029/2006JD007340
- Murphy , D. M. and Thomson , D. S. 1995 . Laser Ionization Mass Spectroscopy of Single Aerosol Particles . Aerosol Sci. Technol. , 22
- Nash , D. G. , Baer , T. and Johnston , M. V. 2006 . Aerosol Mass Spectrometry: An Introductory Review . Int. J. Mass. Spectrom. , 258 : 2 – 12 .
- Novakov , T. and Penner , J. E. 1993 . Large Contribution of Organic Aerosols to Cloud-Condensation Nuclei Concentrations . Nature , 365 : 823 – 826 .
- O'Dowd , C. D. , Facchini , M. C. , Cavalll , F. , Ceburnais , D. , Mircea , M. , Decesari , S. , Fuzzi , S. , Yoon , Y. J. and Putaud , J.-P. 2004 . Biogenically Driven Organic Contribution to Marine Aerosol . Nature , 431 : 676 – 680 .
- Oktem , B. , Tolocka , M. P. and Johnston , M. V. 2004 . On-Line Analysis of Organic Components in Fine and Ultrafine Particles by Photoionization Aerosol Mass Spectrometry . Anal. Chem. , 76 : 253 – 261 .
- Pankow , J. F. 1994a . An Absorptive-Model of the Gas-Particle Partitioning of Organic Compounds in the Atmosphere . Atmos. Environ. , 28 : 185 – 188 .
- Pankow , J. F. 1994b . An Absorptive-Model of the Gas Aerosol Partitioning Involved in the Formation of Secondary Organic Aerosol . Atmos. Environ. , 28 : 189 – 193 .
- Prather , K. A. , Nordmeyer , T. and Salt , K. 1994 . Real-Time Characterization of Individual Aerosol Particles Using Time-of-Flight Mass Spectrometry . Anal. Chem. , 66 : 1403 – 1407 .
- Quinn , P. K. , Bates , T. S. , Baynard , T. , Clarke , A. D. , Onasch , T. B. , Wang , W. , Rood , M. J. , Andrews , E. , Allan , J. , Carrico , C. M. , Coffman , D. and Worsnop , D. 2005 . Impact of Particulate Organic Matter on the Relative Humidity Dependence of Light Scattering: A Simplified Parameterization . Geophys. Res. Lett. , 32 doi:10.1029/2005GL024322
- Rupprecht , G. , Patashnick , H. , Beeson , D. E. , Green , R. N. and Meyer , M. B. A New Automated Monitor for the Measurement of Particulate Carbon in the Atmosphere . Presented at Particulate Matter: Health and Regulatory Issue . April 4–6 , Pittsburgh, PA.
- Sage , A. M. , Weitkamp , E. A. , Robinson , A. L. and Donahue , N. M. 2009 . Reactivity of Oleic Acid in Organic Particles: Changes in Oxidant Uptake and Reaction Stoichiometry with Particle Oxidation . Phy. Chem. Chem. Phys. , 11 : 7951 – 7962 .
- Smith , J. N. , Moore , K. F. , McMurry , P. H. and Eisele , F. L. 2004 . Atmopsheric Measurements of Sub–20 nm Diameter Particle Chemical Composition by Thermal Desorption Chemical Ionization Mass Spectrometry . Aerosol Sci. Technol. , 38 : 100 – 110 .
- Smith , J. N. and Rathbone , G. J. 2008 . Carboxylic Acid Characterization in Nanoparticles by Thermal Desorption Chemical Ionization Mass Spectrometry . Int. J. Mass. Spectrom. , 274 : 8 – 13 .
- Su , Y. , Sipin , M. F. , Furutani , H. and Prather , K. A. 2004 . Development and Characterization of an Aerosol Time-of-Flight Mass Spectrometer with Increased Detection Efficiency . Anal. Chem. , 76 : 712 – 719 .
- Sullivan , A. P. , Weber , R. J. , Clements , A. L. , Turner , J. R. , Bae , M. S. and Schauer , J. J. 2004 . A Method for On-Line Measurement of Water-Soluble Organic Carbon in Ambient Aerosol Particles: Results from an Urban Site . Geophys. Res. Lett. , 31 doi:10.1029/2004GL019681
- Sullivan , R. C. and Prather , K. A. 2005 . Recent Advances in Our Understanding of Atmospheric Chemistry and Climate Made Possible by On-Line Aerosol Analysis Instrumentation . Anal. Chem. , 77 : 3861 – 3886 .
- Tao , Y. and McMurry , P. H. 1989 . Vapor Pressures and Surface Free Energies of C14–C18 Monocarboxylic Acids and C5 and C6 Dicarboxylic Acids . Environ. Sci. Technol. , 23 : 1519 – 1523 .
- Thomson , D. S. , Schein , M. E. and Murphy , D. M. 2000 . Particle Analysis by Laser Mass Spectrometry WB–57F Instrument Overview . Aerosol Sci. Technol. , 33 : 153 – 169 .
- Thornberry , T. and Abbatt , J. P. D. 2004 . Heterogeneous Reaction of Ozone with Liquid Unsaturated Fatty Acids: Detailed Kinetics and Gas-Phase Product Studies . Phy. Chem. Chem. Phys. , 6 : 84 – 93 .
- Thornberry , T. , Murphy , D. M. , Thomson , D. S. , de Gouw , J. A. , Warneke , C. , Bates , T. S. , Quinn , P. K. and Coffman , D. 2009 . Measurement of Aerosol Organic Compounds Using A Novel Collection/Thermal-Desorption PTR-ITMS Instrument . Aerosol Sci. Technol. , 43 : 486 – 501 .
- Tobias , H. J. and Ziemann , P. J. 1999 . Compound Identification in Organic Aerosols Using Temperature-Programmed Thermal Desorption Particle Beam Mass Spectrometry . Anal. Chem. , 71 : 3428 – 3435 .
- Turpin , B. J. , Cary , R. A. and Huntzicker , J. J. 1990 . An In-Situ, Time-Resolved Analyzer for Aerosol Organic and Elemental Carbon . Aerosol Sci. Technol. , 12 : 161 – 171 .
- Veres , P. , Roberts , J. M. , Warneke , C. , Welsh-Bon , D. , Zahniser , M. , Herndon , S. , Fall , R. and de Gouw , J. A. 2008 . Development of Negative-Ion Proton-Transfer Chemical-ionization Mass Spectrometry (NI-PT-CIMS) for the Measurement of Gas-Phase Organic Acids in the Atmosphere . Int. J. Mass Spec. , 274 : 48 – 55 .
- Viggiano , A. A. 1993 . In Situ Mass Spectrometry and Ion Chemistry in the Stratosphere and Troposphere . Mass. Spec. Rev. , 12 : 115 – 137 .
- Voisin , D. , Smith , J. N. , Sakurai , H. , McMurry , P. H. and Eisele , F. L. 2003 . Thermal Desorption Chemical Ionization Mass Spectrometer for Ultrafine Particle Chemical Composition . Aerosol Sci. Technol. , 37 : 471 – 475 .
- Volkamer , R. , Jimenez , J. L. , Martini , F. S. , Dzepina , K. , Zhang , Q. , Salcedo , D. , Molina , L. T. , Worsnop , D. R. and Molina , M. J. 2006 . Secondary Organic Aerosol Formation From Anthropogenic Air Pollution: Rapid and Higher Than Expected . Geophys. Res. Lett. , 33 doi:10.1029/2006GL026899
- Williams , B. J. , Goldstein , A. H. , Kreisberg , N. M. and Hering , S. V. 2006 . An In-Situ Instrument for Speciated Organic Composition of Atmospheric Aerosols: Thermal Desorption Aerosol GC/MS–FID (TAG) . Aerosol Sci. Technol. , 40 : 627 – 638 .
- Wolfe , G. M. , Thornton , J. A. , McNeill , V. F. , Jaffe , D. A. , Reidmiller , D. , Chand , D. , Smith , J. , Swartzendruber , P. , Flocke , F. and Zheng , W. 2007 . Influence of Trans-Pacific Pollution Transport on Acyl Peroxy Nitrate Abundances and Speciation at Mount Bachelor Observatory During INTEX-B . Atmos. Chem. Phys. , 7 : 5309 – 5325 .
- Woods , E. , Smith , G. D. , Dessiaterik , Y. , Baer , T. and Miller , R. E. 2001 . Quantitative Detection of Aromatic Compounds in Single Aerosol Particle Mass Spectrometry . Anal. Chem. , 73 : 2317 – 2322 .
- Yaws , C. L. 2003 . “ Yaws' Handbook of Vapor Pressures ” . In Yaws' Handbook of Thermodynamic and Physical Properties of Chemical Compounds http://www.knovel.com/web/portal/homeKnovel, June 12, 2009
- Zahardis , J. and Petrucci , G. A. 2007 . The Oleic Acid-Ozone Heterogeneous Reaction System: Products, Kinetics, Secondary Chemistry, and Atmospheric Implications of a Model System—A Review . Atmos. Chem. Phys. , 7 : 1237 – 1274 .
- Zelenyuk , A. and Imre , D. 2005 . Single Particle Laser Ablation Time-of-Flight Mass Spectrometer: An Introduction to SPLAT . Aerosol Sci. Technol. , 39 : 554 – 568 .
- Zhang , Q. , Alfarra , M. R. , Worsnop , D. R. , Allan , J. D. , Coe , H. , Canagaratna , M. R. and Jimenez , J. L. 2005 . Deconvolution and Quantification of Hydrocarbon-like and Oxygenated Organic Aerosols Based on Aerosol Mass Spectrometry . Environ. Sci. Technol. , 39 : 4938 – 4952 .
- Zhang , Q. , Jimenez , J. L. , Canagaratna , M. R. , Allan , J. D. , Coe , H. , Ulbrich , I. , Alfarra , M. R. , Takami , A. , Middlebrook , A. M. , Sun , Y. L. , Dzepina , K. , Dunlea , E. , Docherty , K. , DeCarlo , P. F. , Salcedo , D. , Onasch , T. , Jayne , J. T. , Miyoshi , T. , Shimono , A. , Hatakeyama , S. , Takegawa , N. , Kondo , Y. , Schneider , J. , Drewnick , F. , Borrmann , S. , Weimer , S. , Demerjian , K. , Williams , P. , Bower , K. , Bahreini , R. , Cottrell , L. , Griffin , R. J. , Rautiainen , J. , Sun , J. Y. , Zhang , Y. M. and Worsnop , D. R. 2007 . Ubiquity and Dominance of Oxygenated Species in Organic Aerosols in Anthropogenically-Influenced Northern Hemisphere Midlatitudes . Geophys. Res. Lett. , 34 doi:10.1029/2007GL029979
- Ziemann , P. J. 2005 . Aerosol Products, Mechanisms, and Kinetics of Heterogeneous Reactions of Ozone with Oleic Acid in Pure and Mixed Particles . Faraday Discuss. , 130 : 469 – 490 .