Abstract
For studying the formation and photochemical/thermal reactions of aerosols relevant to the troposphere, a unique, high-volume, slow-flow, stainless steel aerosol flow system equipped with UV lamps has been constructed and characterized experimentally. The total flow system length is 8.5 m and includes a 1.2 m section used for mixing, a 6.1 m reaction section and a 1.2 m transition cone at the end. The 45.7 cm diameter results in a smaller surface to volume ratio than is found in many other flow systems and thus reduces the potential contribution from wall reactions. The latter are also reduced by frequent cleaning of the flow tube walls which is made feasible by the ease of disassembly. The flow tube is equipped with ultraviolet lamps for photolysis. This flow system allows continuous sampling under stable conditions, thus increasing the amount of sample available for analysis and permitting a wide variety of analytical techniques to be applied simultaneously. The residence time is of the order of an hour, and sampling ports located along the length of the flow tube allow for time-resolved measurements of aerosol and gas-phase products. The system was characterized using both an “inert” gas (CO 2 ) and particles (atomized NaNO 3 ). Instruments interfaced directly to this flow system include a NO x analyzer, an ozone analyzer, relative humidity and temperature probes, a scanning mobility particle sizer spectrometer, an aerodynamic particle sizer spectrometer, a gas chromatograph-mass spectrometer, an integrating nephelometer, and a Fourier transform infrared spectrophotometer equipped with a long path (64 m) cell. Particles collected with impactors and filters at the various sampling ports can be analyzed subsequently by a variety of techniques. Formation of secondary organic aerosol from α-pinene reactions (NO x photooxidation and ozonolysis) are used to demonstrate the capabilities of this new system.
INTRODUCTION
A great deal of recent research has focused on sources and fates of airborne particles, including secondary organic aerosols (SOA) (CitationRudich 2003; CitationFuzzi et al. 2006; CitationJohnson and Marston 2008; CitationKroll and Seinfeld 2008). In addition to adverse health effects (CitationPope et al. 2002; CitationChow et al. 2006; CitationPope and Dockery 2006), particles affect climate by scattering sunlight and by impacting the formation, properties and lifetimes of clouds (CitationSeinfeld and Pandis 1998; CitationFinlayson-Pitts and Pitts 2000; CitationFuzzi et al. 2006; CitationGhan and Schwartz 2007; CitationSolomon et al. 2007).
The health and environmental impacts of organic aerosols are highly uncertain due to the limited understanding of their compositions, sources, and transformations in ambient air. Reduction of these uncertainties requires a combination of comprehensive field and laboratory studies coupled with appropriate modeling (CitationFuzzi et al. 2006; CitationGhan and Schwartz 2007; CitationSolomon et al. 2007).
Ambient aerosols are complex mixtures of inorganic and organic species from multiple primary and secondary sources (CitationSeinfeld and Pandis 1998; CitationFinlayson-Pitts and Pitts 2000; CitationHamilton et al. 2004; CitationGoldstein et al. 2008). Field studies provide data on the size distribution and composition of these complex particles found in air. However, the large number of uncontrolled variables coupled with numerous products present at small concentrations complicates interpretation of sources and fates of the various components.
Laboratory experiments provide more control of experimental variables but also have significant limitations. For example, concentrations of precursor species are typically greater than those found in ambient air, which can contribute to discrepancies between laboratory experiments and field studies, for example yields of SOA (CitationPankow 1994). Another issue is the possible contribution of artifacts due to reactions on the chamber walls; while similar heterogeneous reactions may occur on boundary layer surfaces, there is insufficient understanding of these processes to allow confident extrapolation from laboratory systems to field studies.
One technique to reduce laboratory reactant concentrations and to minimize the effects of surface reactions is to use large chambers with volumes of up to several cubic meters that provide correspondingly large sample volumes. These can be operated in a continuous flow, constant volume mode in which steady state conditions are reached in the chamber after a number of hours to a day or more. Assuming complete mixing in the chamber, the residence/reaction times are on the order of hours (CitationKleindienst et al. 1999; CitationSeinfeld et al. 2003; CitationVanReken et al. 2006; CitationKing et al. 2007; CitationShilling et al. 2008; CitationChe et al. 2009; CitationShilling et al. 2009). While this approach provides large sample volumes, changing the effective reaction time and cleaning the chamber walls is cumbersome and time-consuming. Many of these large chambers are constructed of Teflon film and are subject to substantial particle loss to the walls due to electrostatic effects (CitationMcMurry and Rader 1985).
Another approach involves the use of flow systems. These are typically much smaller in volume with shorter residence/reaction times, often of the order of a few seconds to minutes (CitationHarrison and Collins 1998; CitationMorris et al. 2002; CitationSmith et al. 2002; CitationBröske et al. 2003; CitationJang et al. 2003; CitationLee and Kamens 2005; CitationMochida et al. 2006; CitationTolocka et al. 2006; CitationVlasenko et al. 2006). Flow systems are readily disassembled for cleaning and provide access to different reaction times in one experiment via sampling from ports at different locations along the length of the flow tube. Experimental conditions can be rapidly modified, and temperature and total pressure control more readily provided than is the case for the large chambers (CitationKhalizov et al. 2006a; Citation2006b). However, sampling volumes are limited and the short total reaction times are not sufficient for studying slower processes that occur over time periods of hours or more. In addition, the surface-to-volume (S/V) ratios are relatively large (e.g., ∼ 200 m–1 compared to ∼ 3.5 m−1 for the large chamber flow systems), which can increase the contribution of wall reactions.
A unique, high-volume, slow-flow aerosol flow system for the study of the formation and reactions of aerosols relevant to the troposphere is described here. The emphasis is on photochemically driven systems, but it also has the capability to study dark reactions. This system combines many of the advantages of the large chambers used in continuous flow mode with those associated with the smaller flow tube systems. Specifically, it provides the option of collecting large sample volumes over extended periods of time and at a range of reaction times from minutes to several hours. This enables the study of reactions with slower kinetics and/or lower concentrations. Furthermore, there is sufficient sample flow to support concurrent real-time sampling of gases and particles along the length of the flow tube, for example by particle mass spectrometry or proton-transfer reaction mass spectrometry. This system also has a relatively small S/V ratio approaching that of the large chambers, is easily disassembled for cleaning, and allows for rapid changes in experimental conditions. The formation of secondary organic aerosol from reactions of α -pinene is used to demonstrate typical applications of this apparatus.
AEROSOL FLOW SYSTEM DESIGN
is a schematic of the aerosol flow system. It is fabricated from stainless steel, 8.5 meters in total length and divided into three sections: (1) inlet/mixing section; (2) central reaction/photolysis section; and (3) terminal transition region. The major portion of the system is a cylinder that is 7.3 m long and 45.7 cm in diameter. The first 1.2 m section contains multiple inlets including a perforated “showerhead” disk and two spoked inlet hubs to enhance mixing of reactants. This is followed by a 6.1 m reaction/photolysis section, divided lengthwise into two halves to allow cleaning and changing of UV lamps that are positioned longitudinally at the center of the flow tube. The two halves are clamped together by 2 cm wide straight flanges that run laterally along both sides of the flow tube. The reaction/photolysis section is joined to the mixing section by transecting circular flanges. The system is interfaced at the downstream end of the reaction/photolysis section also by circular flanges to a 1.2 m long, cone-shaped transition region whose diameter smoothly drops from 45.7 to 1.9 cm. This last section minimizes turbulence and recirculation of species from the downstream end. The flow tube body, straight flanges, mixing tube and transition cone are all fabricated from 16 gauge, 316 stainless steel. Both the straight and circular flanges are sealed using 2.54 cm wide by 3.2 mm thick expanded PTFE gaskets (Inertex, UHF).
FIG. 1 (a) Schematic illustrating major sections of flow system: inlet/mixing, reaction/photolysis, and transition cone; (b) Details of mixing section and first sampling section, including end views of mixing tube and 1st spoked-hub, showerhead disk, and cross-section of reaction/photolysis section.
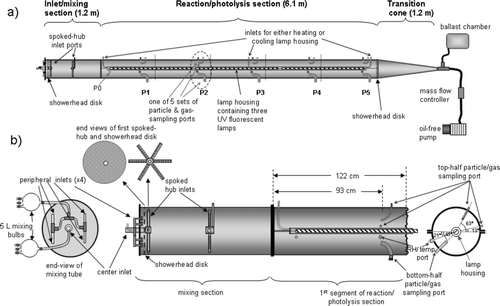
Positioned along the main axis of the reaction/photolysis section of the flow tube, is an air-cooled Pyrex glass tube, 5.02 cm o.d. (outside diameter) and 2.6 mm wall thickness, containing three six-foot, narrow-band, ultraviolet, fluorescent lamps. In the initial studies, lamps that emit a narrow band of UV light centered at 311 nm (Phillips, TL100W/FS72) are used, but they can be readily exchanged for lamps having different emission spectra, e.g., centered at different wavelengths or broadband blacklamps. Alternatively, there is sufficient space between the lamp tube and the glass housing for placement of filters for targeted photolysis if broadband lamps are used. The lamps are powered by external magnetic ballasts (Advance, RS-110-TP and R2S-110-TP) and are connected by Teflon covered wiring. The glass housing decreases the light intensity below 300 nm but only slightly at the 311 nm peak. When the lamps are employed for photolysis, cooling air enters the lamp housing at ∼ 460 L min–1 through a 9.5 mm i.d. (inside diameter) glass and metal tube at the center of the 5.3 m long housing and exits both the housing and the flow tube through 9.5 mm Teflon tubes at each end. The aerosol/reactant flow within the flow tube is unaffected by this large flow of air through the lamp housing which is sealed by Ultra-Torr fittings and Ace Glass bushings. The lamps are centered within the housing using wire spacers and the housing/lamp combination is suspended at the flow tube center by several 2.54 cm or 5.08 cm wide stainless steel straps positioned strategically along the length of the lamp housing (not shown in ). For dark experiments, the lamp housing is heated 4 to 6°C above the surrounding gas and/or particle mixture by pre-heating the air flowing into the housing and reversing the direction of flow. This maintains the same flow dynamics as when heating is produced by the lamps.
To enhance mixing of the reactants in a non-turbulent flow prior to entering the reaction/photolysis section, the mixing section is fitted with three types of inlets for gas-phase reactants, carrier gas, and/or aerosol ():
-
Peripheral inlets. A common exterior manifold supplies four 6.35 mm tubes passing through holes located in the front end plate, 16.5 cm from the center of the plate. Each of these four tubes is connected to a 6.35 mm Swagelok tee on the interior, 2.5 cm downstream from the end plate (). These four interior tees divide reagents added through these inlets into eight equivalent portions which then feed into a small volume separated from the rest of the mixing tube by a 16 gauge stainless steel showerhead diffuser disk that has 940 equally spaced 3.2 mm holes. This showerhead disk is located 5.0 cm downstream of the end plate. Typically 50% of the total flow (carrier gas as well as at least one of the reactants) passes through this disk.
-
Center inlet/1st spoked hub. A 20 cm long, 1.90 cm diameter stainless steel tube passes from the exterior of the mixing tube through a bulk-head fitting in the end plate and through the showerhead disk to the spoked hub described below. There is also a short elbow constructed of 3.2 mm stainless steel tubing that passes through the side of the 1.90 cm tube at a location exterior to the endplate of the flow tube. This elbow is directed co-axially downstream (see ) in order to minimize recirculation within the inlet (CitationKhalizov et al. 2006b), and it is used for the addition of aerosol particles. A significant portion of the carrier gas flow is added through a 6.35 mm Swagelok fitting at the head of the 1.90 cm tube, and additional reagents could also be included in this flow. The spoked hub at the end of the 1.90 cm tube consists of a small hollow cylinder (5 cm o.d. by 2 cm) fitted with six equivalent 9.5 mm o.d. stainless steel tubes, 21 cm long, directed radially outward as in the spokes of a wheel. This spoked hub is positioned 7.5 cm downstream of the end plate and 2.5 cm downstream of the showerhead disk. Each of the spokes has 14 equally spaced 6.35 mm holes on one side oriented to inject the center-inlet flow upstream toward the showerhead disk, thus providing efficient mixing of the added material. Typically, 25% of total carrier gas flow was added through the center inlet.
-
2nd Spoked hub. Located midway along the mixing section is a second spoked hub similar to the one connected to the center inlet, with the following modifications: (a) carrier gas with or without additional gas-phase reagent is fed into the 3.2 cm hub via a 6.35 mm stainless steel tube that passes through the flow tube wall in the mixing section; (b) the six spokes of the wheel are 21 cm long and; (c) a total of 28 holes 4.1 mm in diameter are staggered on opposite sides of each spoke and positioned in the hub so that the flow is directed in a plane transecting the mixing section. Typically, 25% of total carrier gas flow was added through the 2nd spoked hub.
Thus, through a combination of inlets, a well mixed flow of carrier gas and reactants pass from the mixing section into the reaction/photolysis section described below.
Located at fixed and equally spaced distances along the length of the reaction/photolysis section are five sets of sampling ports (P1 to P5) at intervals that divide this section into five equal 122-cm segments. Each set contains two 90°-elbow ports, a gas sampling port and an additional port for a relative humidity/temperature probe. (See dotted oval in .) The two 90°-elbow ports are used for all particle sampling (as well as for some gas sampling), with one located in the top-half (4.76 mm i.d. and 6.35 mm o.d.) and one in the bottom half (3.5 cm i.d and 3.8 cm o.d) of the sampling section. Each elbow curves upstream, and isoaxially samples 93 cm from the start of each section. The interior ends of the sampling elbows are radially equidistant (10 cm) from the lamp housing and the flow tube wall. The gas-sampling and relative humidity ports are also located 93 cm downstream in each section. There is one additional unique port, P0 located in the first reaction/photolysis section, 23 cm downstream of the transecting flange and 7 cm below the straight flange. This 6.3 mm diameter port, due to its close proximity to the mixing/inlet section, is used to sample reaction mixtures prior to extensive photolysis/reaction.
The majority of gas phase reactants, carrier gas, and aerosol which enter the upstream end of the flow tube are pumped out at the terminal end of the flow tube using an oil-free rotary pump (Gast Manufacturing, Model 0523) whose flow is restricted by a MKS Alta model mass flow controller with a MKS 247C 4-channel readout. The pumping speed is typically adjusted to maintain the total output (from pump and sampling instruments) at a rate just below the total input flow. (See for instrument sampling rates.) Excess flow, if any, is accommodated by a 100-L Teflon ballast chamber attached at a tee at the exhaust end of the transition cone. This aerosol flow system is designed to operate near ambient pressure and temperature.
TABLE 1 Summary of analytical techniques with volume sampling rates for instrumentation interfaced to flow system. (For additional details, see Supplementary Material available online.)
The unique design of this system presents several advantages: a residence time for particles of the order of an hour, a surface to volume ratio of 10 m–1 and a total volume of 1.2 m3. Photolysis using different wavelengths is possible using selected lamps located along the longitudinal axis of the flow tube. This system has the capability of providing large sampling volumes and the ability to sample gases and particles at multiple locations/reaction times along the length of the flow tube. As an example, summarizes the types of instruments that are interfaced to this flow tube and the sampling rates for each. Even with 20 L min–1 total flow rate, some of the measurements requiring high sampling rates had to be carried out sequentially. However, given the system stability, this is not a significant limitation. Finally, it provides easy accommodation of experiments with a variety of reagents and reaction conditions, and ease of cleaning to reduce contamination from wall reactions.
FLOW PARAMETERS
The dynamic behavior of gases and particles in the flow system was characterized by three dimensionless parameters: the Reynolds number (Re), the Richardson number (Ri), and the Stokes number (Stk). First, the dimensionless Reynolds number that characterizes bulk flow reflects the ratio of inertial to viscous forces and is given by Re = ρ UD/η where ρ and η are the density and dynamic viscosity of air, U the mean flow velocity and D a characteristic length scale, e.g., the diameter of the flow tube for the mixing section or the difference between the flow tube and lamp-housing diameters for the reaction/photolysis section. CitationHolman (2002) states that fully developed laminar flow occurs when Re < 2300. On the other hand, a high Reynolds number (Re > 4000) indicates the presence of turbulence in the flow. Owing to the large diameter (∼ 0.45 m) and low total flow rate (20 L min–1), the Reynolds number is 61 for the mixing section and 54 for the reaction/photolysis section of the flow tube, showing that the flow should be laminar.
This aerosol flow system is designed to be used primarily for photolysis studies. Operation of the UV lamps, even with a large flow of cooling air, results in the lamp housing surface temperature being higher than ambient. Heating of the lamp housing in this manner results in an average surface temperature of the housing of ∼ 30°C while that of the flow tube wall is at ambient, ∼ 24°C. Thus, the system exhibits natural convection in which the motion of air is caused by temperature gradients. The system also exhibits forced convection in which motion of air is caused by external sources such as the pump at the end of the flow tube. In order to determine the dominant mechanism, the dimensionless Richardson number is introduced, Ri = (gβ Δ TD)/U2 where g is the acceleration due to gravity, β the thermal expansion coefficient of air, Δ T the temperature difference between the lamp housing and room temperature, and D the diameter of the flow tube (CitationKhalizov et al. 2006a, Citation2006b). The Richardson number quantifies the ratio of natural convection to forced convection. Typically, forced convection is negligible when Ri > 10. In this system, for a 6°C temperature difference between the flow tube wall (24°C) and lamp housing (30°C) and at typical operating conditions, Ri > 15000. Thus, natural convection dominates radial movement as the aerosol/air mixture moves down the reaction/photolysis section of the flow tube (CitationKhalizov et al. 2006a, Citation2006b; CitationIncropera 2007). As a result, convective cells are expected which, while promoting good mixing of reactants, will also increase the residence time. Note this 6°C temperature difference is radial in nature while the observed longitudinal temperature difference measured at port 1 and port 5 is less than 1°C. Furthermore, the temperature of the gas stream at the exit to the sampling ports is within a degree of ambient so that shifts in the gas-particle equilibrium that may occur at the higher temperatures close to the lamp housing should be restored prior to measurement.
Finally, the Stokes number, Stk, determines whether a particle suspended in a fluid flow will follow the gas streamlines. Stk is the ratio of stopping distance S to a characteristic obstacle dimension D (such as the lamp-housing diameter of 5.2 cm, the sampling port diameter of 3.8 cm, etc.). The stopping distance is calculated by S = Uoρpd2Cc/18η where Uo is the undistributed fluid velocity, ρp the particle density, d the particle diameter, and Cc the Cunningham slip correction factor (CitationSeinfeld and Pandis 1998; CitationHinds 1999). The stopping distance calculated for particles from 0.02 to 20 μ m diameter at typical bulk flow speeds in this system (0.20 cm s–1) shows that for all particle sizes and for all obstacle dimensions, Stk ≤ 1, so that particles are expected to follow gas streamlines.
The system exhibits potential particle losses due to diffusion to the walls and gravitational settling. Deposition by diffusion to the walls increases as particle diameter decreases. Particle throughput in a flow tube due to diffusion to the walls is taken into account by the penetration term, P = nout/nin, which is defined as the ratio of the particle concentration coming out of the cylindrical tube at a distance L (nout) to that at distance L = 0 (nin). Calculations of P for this system for either laminar (CitationHinds 1999) or turbulent flow regimes (CitationFriedlander and Johnstone 1957; CitationWells and Chamberlain 1967; CitationLee and Gieseke 1994) show that even for the smallest particles sampled by SMPS (21 nm), particle loss by diffusion to the walls is ≤2% and represents a negligible loss for particles larger than 50 nm. Additionally, wall loss due to electrostatic effects which results in substantial particle deposition in Teflon chambers is not a problem in a metallic flow system (CitationMcMurry and Rader 1985).
Gravitational settling increases with particle size. The deposition parameter, the ratio of residence time to settling time, is calculated for this system using a common form suggested by CitationRobinson et al. (2007). The transmission efficiency through a horizontal tube decays exponentially with the deposition parameter (CitationStröm 1972). As a result, the transmission efficiency for this system was calculated to be greater than 98% for particles of diameter 300 nm or smaller, decreasing to 91% for 800 nm and 86% for 1000 nm particles.
Additionally, total particle concentration may decrease due to coagulation which increases with particle concentration and time. At a fixed concentration, coagulation is independent of particle diameter for large particles while for smaller particles where the Cunningham slip correction factor must be applied, coagulation increases with decreasing diameter. The fractional loss of particles due to coagulation is calculated (CitationHinds 1999) for several particle diameters assuming a particle concentration of 3 × 10⁴ particles cm–3 at the first spoked inlet where the aerosol entered the flow tube. This concentration is typical of the total concentration of particles sampled from this flow system, and thus calculated losses at any given diameter represent an upper limit since the concentration at a particular diameter is much less than the total. The fractional loss at 56 minutes (corresponding to sampling at P5) is 11% for 21 nm particles, 7% for 100 nm particles, and 3% for all particles larger than 700 nm.
EXPERIMENTAL CHARACTERIZATION OF GAS AND PARTICLE FLOW
A. CO2 Flow Studies
To test the system for stability under steady-state conditions as well as the ability to respond to time-dependent events, a small flow (∼ 110 cm3 min–1) of CO2 was added to the system along with 20 ± 1 L min–1 of either dry or humid air. Samples were continuously withdrawn for FTIR measurement of the CO2 every few minutes at each of five sampling ports P1–P5. Once a set of measurements was made at all five ports, the process was repeated until the CO2 concentrations leveled off at all sampling ports. illustrates time resolution among sampling ports as well as attainment of steady state. Many such sets of measurements indicate that, at a total flow of 20 L min–1, steady-state conditions exist within the flow system about 100 minutes after addition of CO2 into the system. This was true regardless of which of the inlets was used for the addition of sample gas, which port or type of port (particle or gas) was used for sampling, whether the background air was humid or dry or whether aerosol was added. After 100 or more minutes, the 2σ error of the average absorbance readings at all five sampling ports was within 3%. Similar results were obtained at both higher and lower total flows (40 and 10 L min–1). For comparison, the times required for the measured absorbance at port 1 to attain half the steady state maximum were 8, 13, and 48 min at 40, 20, and 10 L min–1 total flow, respectively. These values compare favorably with times of 9, 17, and 34 min, calculated assuming plug flow of CO2.
FIG. 2 Port to port monitoring of carbon dioxide/air mixture with CO2/humid air added through peripheral inlets at 12 L min–1 in the presence of sodium nitrate aerosol/humidified air added through center inlet at 8 L min–1.
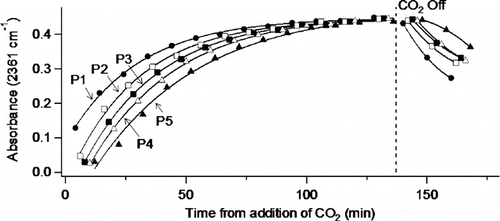
Carbon dioxide is relatively inert compared to other gas-phase species of interest to atmospheric studies. More reactive species such as nitrogen dioxide or ozone required three to four hours for conditioning of the flow tube walls before reaching the calculated steady-state value (based on measured initial concentration and known dilution) at all five sampling ports. For this reason, reactive reagents are flowed for several hours prior to initiation of photolysis or addition of a final reactant.
B. Aerosol Studies
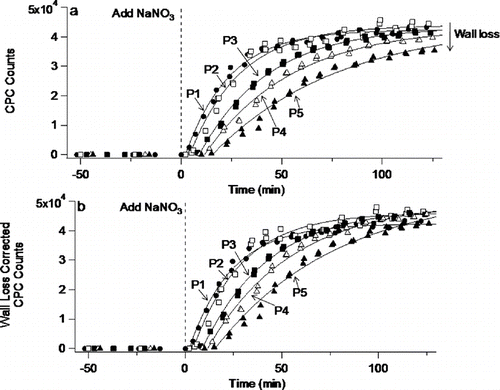
illustrates the port-to-port behavior as total particle counts, measured by a condensation particle counter, were followed with time when a 0.50 L min–1 flow of NaNO3 aerosol was diluted with 4.5 L min–1 of humidified air and added via the center inlet. Additional flows of humidified air were added through the peripheral inlets (10 L min–1) and the 2nd spoked inlet (5.0 L min–1). For these conditions, the typical geometric mean diameter was 150 nm with a geometric standard deviation of 1.6. As was the case for CO2, steady state conditions prevailed within the flow system after about 100 min. However, even after steady-state is reached, the particle counts decreased with increasing distance along the flow tube as expected from particle losses to the walls due to settling and coagulation. The wall loss constant, calculated in a manner similar to that of CitationPathak et al. (2007) using data from P1 through P5 produced a value for kwall = 8.8 × 10⁻⁵ s–1. The measured particle counts at P2 to P5 were corrected for wall loss using this value for kwall and are plotted in . Port-to-port agreement in the average particle count using wall loss corrected values has a 2σ error of 9%. There are sufficient port-to-port differences in the first 60 minutes to suggest that the system is capable of detecting new aerosol formation in cases where aerosol was first formed upstream and then grew in concentration and/or size as the reaction proceeded downstream. Note that shows the behavior of particles when the lamp housing was warmed by a flow of heated air so as to mimic the heating and associated mixing it causes when the UV lamps are used. Heating of the lamp housing arising from either operation of the UV-lamps or the passage of heated air has the potential of establishing thermophoretic radial flow of particles due to the small temperature gradient between the heated lamp housing and the cooler flow-tube walls (≤ 6°C). However, the thermophoretic velocity imparted to particles 100 nm or smaller in diameter (which would respond more strongly than even larger particles) was calculated to be less than 0.01 cm min−1 and would therefore not be expected to significantly affect aerosol flow.
FIG. 3 Aerosol flow studies with atomized NaNO3 (a) without correction, and (b) with correction for wall loss. Lines are meant as guide to the eye.
APPLICATION TO SOA FORMATION
Reactions of α -pinene have served as a model system for SOA formation in numerous studies (e.g., see CitationJaoui and Kamens 2001; CitationKamens and Jaoui 2001; CitationBonn and Moortgat 2002; CitationBröske et al. 2003; CitationBaltensperger et al. 2005; CitationLee and Kamens 2005; CitationTolocka et al. 2006; CitationBonn et al. 2007; CitationOffenberg et al. 2007; CitationVenkatachari and Hopke 2008; CitationYu et al. 2008), and thus was used here to demonstrate the capabilities of the new flow system. SOA formation is shown here from two separate reaction systems, the NO x photooxidation of α -pinene and the ozonolysis of α -pinene. Only the data on the reactants (NO x , O3, and α -pinene) and on the number concentrations and sizes of the particles formed are shown. The chemical composition measurements and mechanisms are the subject of additional papers (CitationPerraud et al. 2010a; Citation2010b; Zelenyuk et al. 2009; CitationBruns et al. 2010).
A. NO x Photooxidation of α -Pinene
In this experiment, 1.8 ppm NO2 was introduced to the aerosol flow system through the peripheral inlets, and 1 ppm α -pinene was introduced through the 2nd spoked hub. The ultraviolet lamps were turned on after steady-state concentrations had been obtained.
shows concentrations of α -pinene, NO, NOy and O3 at P1 before and after the photolysis lamps were turned on. As expected, NOy decreased and NO, which was present as an impurity in the NO2, increased initially upon irradiation and then decreased. Well-known organic-NOx photochemistry (CitationFinlayson-Pitts and Pitts 2000) leads to photolysis of NO2 and the formation first of NO and then O3, which reacts with α -pinene and generates SOA. In addition, OH is formed in this system and also attacks the α -pinene. Because the SOA yields from the OH reaction are significantly smaller than those from ozonolysis (CitationBonn and Moortgat 2002), most of the SOA is expected to arise from the ozone reaction. shows the steady-state concentrations of α -pinene, NO, NOy, and O3 at increasing reaction times (i.e., at different ports along the length of the flow tube). Taking t = 0 at the point of α -pinene addition gives reaction times of 13, 23, 33, 43, and 53 min. at P1 through P5, respectively. As seen in , the photolysis lamps extend about half way between the first sampling port and the 2nd spoked hub so that the reaction mixture is not fully exposed to the lamp output in the first ∼ 6 min; however, the metal surfaces of the flow tube scatter light quite efficiently, initiating photolysis in these first few minutes.
FIG. 4 Measured concentrations of α -pinene at P1 (initial concentration 1.0 ppm), NO2 (initial concentration 1.8 ppm), NO (initial concentration 10 ppb), and O3 before and after the lamps were turned on (defined here as t = 0).
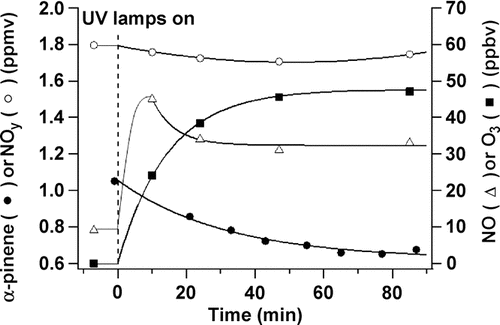
FIG. 5 (a) Steady-state concentrations of α -pinene, NO2, NO, and O3 as a function of time; (b) number concentration, geometric mean diameter (GMD) and total mass of particles formed in the NOx photooxidation of α -pinene at steady state as a function of time.
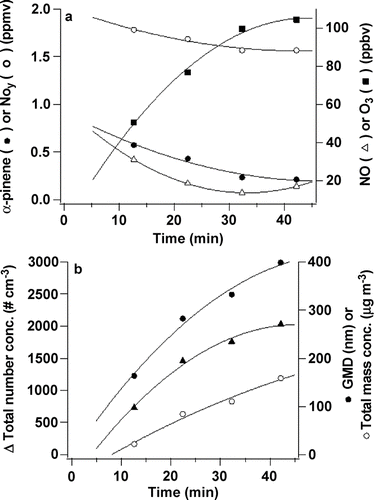
shows that the steady-state number concentration of SOA formed in the NOx photooxidation as well as the geometric mean diameter of the particles and total mass increase as a function of reaction time. (The actual increase is greater than indicated since corrections for wall loss were not included.) This is consistent with both new particle formation and growth of existing particles occurring over the first hour of this reaction.
B. Reaction of O3 with α -Pinene
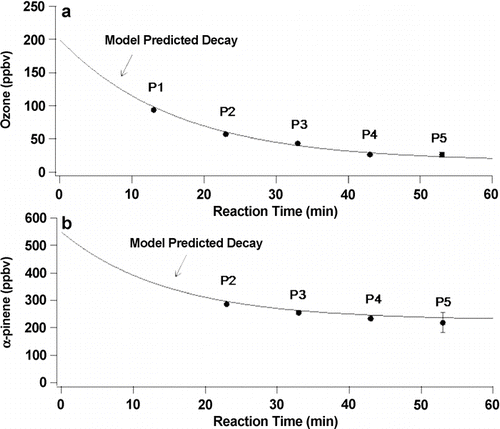
In this experiment, 500 ppb α -pinene were introduced in the dark to the flow system through the 2nd spoked hub. After 135 min 200 ppb ozone was added through the peripheral inlets. shows typical time-dependent measurements of ozone at each port in this experiment. The measured steady-state concentrations at each port give the concentrations of α -pinene and O3 as a function of reaction time, which is shown in . A simplified reaction scheme for the α -pinene reaction with ozone was developed based on known reactions and kinetics (Atkinson et al. 2007). Numerical integration of the rate equations for this mechanism using AcuChem (CitationBraun et al. 1988) gives the solid lines shown in . The predicted reactant concentrations are clearly in excellent agreement with the measured values.
FIG. 6 Time dependence of ozone (initial concentration 200 ppb) measured at each port after addition of α -pinene.
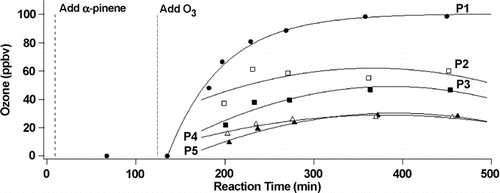
FIG. 7 Average of measured steady-state concentrations of (a) O3 and (b) α -pinene as a function of reaction time for the experiment shown in . The solid curves are the AcuChem model predicted decays.
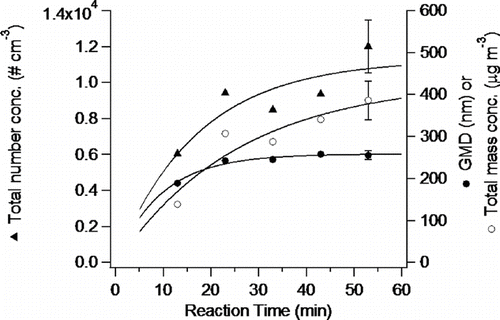
shows data on the SOA formation in terms of number concentration, geometric mean diameter and the total mass as a function of reaction time for the ozone reaction with α -pinene. As expected, the total number concentration and mass increase with reaction time. Interestingly, in contrast to SOA formed in the NOx photooxidation, the geometric mean diameter increases rapidly in the first 25 min of reaction but then remains relatively constant, suggesting that new particle formation dominates over this time scale in the ozonolysis reaction. Experimental details are available online in Supplementary Material.
FIG. 8 Total number concentration, mass, and geometric mean diameter (GMD) measured under steady-state conditions from P1 through P5 for ozonolysis of α -pinene. Error bars represent 2σ.
CONCLUSIONS
A new, high-volume, slow-flow aerosol flow system described here has a number of advantages for studying the formation and reactions/photochemistry of aerosols. Once steady-state conditions are achieved, sampling can be conducted over a period of several hours if desired, providing large sample volumes and permitting a number of different analytical techniques to be used during one experiment. It also provides sampling at different ports along the length of the flow system which can yield valuable information regarding the changes in aerosol particles that occur with time. Furthermore, experimental conditions can readily be changed over the course of an hour or two. Finally, the relatively small S/V ratio compared to smaller flow systems along with ease of disassembly for cleaning minimizes the contributions of wall reactions to the chemistry occurring in this system. Detailed results of studies of ozone and nitrate radical reactions with α -pinene and of nitrate and nitrite ion-induced photochemistry using this system will be described in future publications.
uast_a_464479_sup_12978516.zip
Download Zip (78.4 KB)We are grateful to the U.S. Department of Energy (Grant # DE-FG02-05ER64000) for support of this work. Additional support was provided by the AirUCI Environmental Molecular Science Institute funded by the National Science Foundation (Grant # CHE-0431312). E.A.B. acknowledges financial support from a National Science Foundation graduate student fellowship. This research was in part in collaboration with the Environmental Molecular Sciences Laboratory, a national scientific user facility sponsored by the U.S. Department of Energy's Office of Biological and Environmental Research at Pacific Northwest National Laboratory (PNNL) and supported by the U.S. Department of Energy Office of Basic Energy Sciences, Chemical Sciences Division. PNNL is operated by the U.S. Department of Energy by Battelle Memorial Institute under contract # DE-AC06-76RL0 1830. We appreciate helpful discussions with Prasad Pokkunuri. We are grateful for the invaluable technical expertise and advice from George Schade, Reliable Sheet Metal Works, Fullerton, CA; Lee Moritz, Ron Hulme, and Richard Busby of the UCI Physical Sciences Machine Shop; and Jörg Meyer of the UCI Chemistry Department Glassblowing Shop. Finally, we thank J. N. Pitts Jr. for helpful comments on the article.
[Supplementary materials are available for this article. Go to the publisher's online edition of Aerosol Science and Technology to view the free supplementary files.]
Notes
a Subsequently analyzed using LC-UV and LC-MS.
b 20 L is sampled from the flow system into the long path cell to give a static sample.
c Subsequently analyzed using GC-MS, ESI-MS, API-MS, LC-MS, and LC-UV.
d Subsequently analyzed using FTIR.
Related Research Data
REFERENCES
- Atkinson , R. , Baulch , D. L. , Cox , R. A. , Crowley , J. N. , Hampson , R. F. , Hynes , R. G. , Jenkin , M. E. , Rossi , M. J. and Troe , J. 2006 . Evaluated Kinetic and Photochemical Data for Atmospheric Chemistry: Volume II-Gas Phase Reactions of Organic Species . Atmos. Chem. Phys. , 6 : 3625 – 4055 .
- Baltensperger , U. , Kalberer , M. , Dommen , J. , Paulsen , D. , Alfarra , M. R. , Coe , H. , Fisseha , R. , Gascho , A. , Gysel , M. and Nyeki , S. 2005 . Secondary Organic Aerosols from Anthropogenic and Biogenic Precursors . Faraday Discuss. , 130 : 265 – 278 .
- Bonn , B. , Korhonen , H. , Petäjä , T. , Boy , M. and Kulmala , M. 2007 . Understanding the Formation of Biogenic Secondary Organic Aerosol from α -Pinene in Smog Chamber Studies: Role of Organic Peroxy Radicals . Atmos. Chem. Phys. Discuss. , 7 : 3901 – 3939 .
- Bonn , B. and Moortgat , G. K. 2002 . New Particle Formation During α - and β -Pinene Oxidation by O3, OH and NO3, and the Influence of Water Vapour: Particle Size Distribution Studies . Atmos. Chem. Phys. , 2 : 183 – 196 .
- Braun , W. , Herron , J. T. and Kahaner , D. K. 1988 . ACUCHEM: A Computer Program for Modeling Complex Chemical Reaction Systems . Int. J. Chem. Kinet. , 20 : 51 – 62 .
- Bröske , R. , Kleffmann , J. and Wiesen , P. 2003 . Heterogeneous Conversion of NO2 on Secondary Organic Aerosol Surfaces: A Possible Source of Nitrous Acid (HONO) in the Atmosphere? . Atmos. Chem. Phys. , 3 : 469 – 474 .
- Bruns , E. A. , Perraud , V. , Zelenyuk , A. , Ezell , M. J. , Johnson , S. N. , Yu , Y. , Imre , D. , Finlayson-Pitts , B. J. and Alexander , M. L. 2010 . Comparison of FTIR and Particle Mass Spectrometry for the Measurement of Particulate Organic Nitrates . Environ. Sci. Technol. , 44 : 1056 – 1061 .
- Che , D. , Smith , J. , Leone , S. , Ahmed , M. and Wilson , K. 2009 . Quantifying the Reactive Uptake of OH by Organic Aerosols in a Continuous Flow Stirred Tank Reactor . Phys. Chem. Chem. Phys. , 11 : 7885 – 7895 .
- Chow , J. C. , Watson , J. G. , Mauderly , J. L. , Costa , D. L. , Wyzga , R. E. , Vedal , S. , Hidy , G. M. , Altshuler , S. L. , Marrack , D. , Heuss , J. M. , Wolff , G. T. , Pope , C. A. and Dockery , D. W. 2006 . Health Effects of Fine Particulate Air Pollution: Lines that Connect . J. Air Waste Manag. Assoc. , 56 : 1368 – 1380 .
- Finlayson-Pitts , B. J. and Pitts , J. N. Jr. 2000 . Chemistry of the Upper and Lower Atmosphere—Theory, Experiments, and Applications , San Diego : Academic Press .
- Friedlander , S. K. and Johnstone , H. F. 1957 . Deposition of Suspended Particles from Turbulent Gas Streams . Ind. Eng. Chem. , 49 : 1151 – 1156 .
- Fuzzi , S. , Andreae , M. O. , Huebert , B. J. , Kulmala , M. , Bond , T. C. , Boy , M. , Doherty , S. J. , Guenther , A. , Kanakidou , M. and Kawamura , K. 2006 . Critical Assessment of the Current State of Scientific Knowledge, Terminology, and Research Needs Concerning the Role of Organic Aerosols in the Atmosphere, Climate, and Global Change . Atmos. Chem. Phys , 6 : 2017 – 2038 .
- Ghan , S. J. and Schwartz , S. E. 2007 . Aerosol Properties and Processes: A Path from Field and Laboratory Measurements to Global Climate Models . Bull. Am. Meteorol. Soc. , 88 : 1059 – 1083 .
- Goldstein , A. H. , Worton , D. R. , Williams , B. J. , Hering , S. V. , Kreisberg , N. M. , Panic , O. and Górecki , T. 2008 . Thermal Desorption Comprehensive Two-Dimensional Gas Chromatography for In-Situ Measurements of Organic Aerosols . J. Chrom. A , 1186 : 340 – 347 .
- Hamilton , J. , Webb , P. , Lewis , A. , Hopkins , J. , Smith , S. and Davy , P. 2004 . Partially Oxidised Organic Components in Urban Aerosol Using GCxGC-TOF/MS . Atmos. Chem. Phys. , 4 : 1279 – 1290 .
- Harrison , R. M. and Collins , G. M. 1998 . Measurements of Reaction Coefficients of NO2 and HONO on Aerosol Particles . J. Atmos. Chem. , 30 : 397 – 406 .
- Hinds , W. C. 1999 . Aerosol Technology , New York : John Wiley & Sons .
- Holman , J. P. 2002 . Heat Transfer. , 207 New York : McGraw-Hill .
- Incropera , F. P. 2007 . Fundamentals of Heat and Mass Transfer , New York : John Wiley & Sons .
- Jang , M. , Lee , S. and Kamens , R. M. 2003 . Organic Aerosol Growth by Acid-Catalyzed Heterogeneous Reactions of Octanal in a Flow Reactor . Atmos. Environ. , 37 : 2125 – 2138 .
- Jaoui , M. and Kamens , R. M. 2001 . Mass Balance of Gaseous and Particulate Products Analysis from α -Pinene/NOx/Air in the Presence of Natural Sunlight . J. Geophys. Res. Atmos. , 107 : 12541 – 12558 .
- Johnson , D. and Marston , G. 2008 . The Gas-Phase Ozonolysis of Unsaturated Volatile Organic Compounds in the Troposphere . Chem. Soc. Rev. , 37 : 699 – 716 .
- Kamens , R. M. and Jaoui , M. 2001 . Modeling Aerosol Formation from α -Pinene + NO x in the Presence of Natural Sunlight Using Gas-Phase Kinetics and Gas-Particle Partitioning Theory . Environ. Sci. Technol. , 35 : 1394 – 1405 .
- Khalizov , A. , Earle , M. , Johnson , W. , Stubley , G. and Sloan , J. 2006a . Modeling of Flow Dynamics in Laminar Aerosol Flow Tubes . J. Aerosol Sci. , 37 : 1174 – 1187 .
- Khalizov , A. F. , Earle , M. E. , Johnson , W. J. W. , Stubley , G. D. and Sloan , J. J. 2006b . Development and Characterization of a Laminar Aerosol Flow Tube . Rev. Sci. Instrum. , 77 : 033102
- King , S. M. , Rosenoern , T. , Shilling , J. E. , Chen , Q. and Martin , S. T. 2007 . Cloud Condensation Aucleus Activity of Secondary Organic Aerosol Particles Mixed with Sulfate . Geophys. Res. Lett. , : 34
- Kleindienst , T. E. , Smith , D. F. , Li , W. , Edney , E. O. , Driscoll , D. J. , Speer , R. E. and Weathers , W. S. 1999 . Secondary Organic Aerosol Formation from the Oxidation of Aromatic Hydrocarbons in the Presence of Dry Submicron Ammonium Sulfate Aerosol . Atmos. Environ. , 33 : 3669 – 3681 .
- Kroll , J. H. and Seinfeld , J. H. 2008 . Chemistry of Secondary Organic Aerosol: Formation and Evolution of Low-Volatility Organics in the Atmosphere . Atmos. Environ. , 42 : 3593 – 3624 .
- Lee , K. W. and Gieseke , J. A. 1994 . Deposition of Particles in Turbulent Pipe Flows . J. Aerosol Sci. , 25 : 699 – 709 .
- Lee , S. and Kamens , R. M. 2005 . Particle Nucleation from the Reaction of α –Pinene and O3 . Atmos. Environ. , 39 : 6822 – 6832 .
- McMurry , P. H. and Rader , D. J. 1985 . Aerosol Wall Losses in Electrically Charged Chambers . Aerosol Sci. and Technol. , 4 : 249 – 268 .
- Mochida , M. , Katrib , Y. , Jayne , J. T. , Worsnop , D. R. and Martin , S. T. 2006 . The Relative Importance of Competing Pathways for the Formation of High-Molecular-Weight Peroxides in the Ozonolysis of Organic Aerosol Particles . Atmos. Chem. Phys. , 6 : 4851 – 4866 .
- Morris , J. , Davidovits , P. , Jayne , J. , Jimenez , J. , Shi , Q. , Kolb , C. , Worsnop , D. , Barney , W. and Cass , G. 2002 . Kinetics of Submicron Oleic Acid Aerosols with Ozone—A Novel Aerosol Mass Spectrometric Technique . Geophysical Research Letters , 29 : 71 – 71 .
- Offenberg , J. H. , Lewis , C. W. , Lewandowski , N. , Jaoui , M. , Kleindienst , T. E. and Edney , E. O. 2007 . Contributions of Toluene and α -Pinene to SOA Formed in an Irradiated Tolene/α -Pinene/NOx/Air Mixture: Comparison of Results Using 14C Content and SOA Organic Tracer Methods . Environ. Sci. Technol. , 41 : 3972 – 3976 .
- Pankow , J. F. 1994 . An Absorption Model of Gas/Particle Partitioning of Organic Compounds in the Atmosphere . Atmos. Environ. , 28 : 185 – 188 .
- Pathak , R. K. , Stanier , C. O. , Donahue , N. M. and Pandis , S. N. 2007 . Ozonolysis of α –Pinene at Atmospherically Relevant Concentrations: Temperature Dependence of Aerosol Mass Fractions (Yields) . J. Geophys. Res. , 112 : D03201
- Perraud , V. , Yu , Y. , Bruns , E. A. , Ezell , M. J. , Johnson , S. N. , Alexander , M. L. , Zelenyuk , A. , Imre , D. and Finlayson-Pitts , B. J. 2010a . Characterization and Chemical Composition of the Secondary Organic Aerosols Formed in the NO3 Radical-Initiated Oxidation of α -Pinene In press
- Perraud , V. , Yu , Y. , Bruns , E. A. , Ezell , M. J. , Johnson , S. N. , Alexander , M. L. , Zelenyuk , A. , Imre , D. and Finlayson-Pitts , B. J. 2010b . Influence of the NO2/O3 Ratio in the NO3 Radical-Initiated Oxidation of α -Pinene In press
- Pope , C. A. , Burnett , R. T. , Thun , M. J. , Calle , E. E. , Krewski , D. , Ito , K. and Thurston , G. D. 2002 . Lung Cancer, Cardiopulmonary Mortality and Long-Term Exposure to Fine Particulate Air Pollution . J. Am. Med. Assoc. , 287 : 1132 – 1141 .
- Pope , C. A. and Dockery , D. W. 2006 . Health Effects of Fine Particulate Air Pollution: Lines that Connect . J. Air Waste Manag. Assoc. , 56 : 709 – 742 .
- Robinson , R. , Snyder , P. and Oldham , M. 2007 . Comparison of Particle Tracking Algorithms in Commercial CFD Packages: Sedimentation and Diffusion. . Inhalation Toxicology. , 19 : 517 – 531 .
- Rudich , Y. 2003 . Laboratory Perspectives on the Chemical Transformations of Organic Matter in Atmospheric Particles . Chem. Rev. , 103 : 5097 – 5124 .
- Seinfeld , J. H. , Kleindienst , T. E. , Edney , E. O. and Cohen , J. B. 2003 . Aerosol Growth in a Steady-State, Continuous Flow Chamber: Application to Studies of Secondary Aerosol Formation . Aerosol Sci. Technol. , 37 : 728 – 734 .
- Seinfeld , J. H. and Pandis , S. N. 1998 . Atmospheric Chemistry and Physics: From Air Pollution to Climate Change. , New York : John Wiley & Sons .
- Shilling , J. E. , Chen , Q. , King , S. M. , Rosenoern , T. , Kroll , J. H. , Worsnop , D. R. , DeCarlo , P. F. , Aiken , A. C. , Sueper , D. , Jimenez , J. L. and Martin , S. T. 2009 . Loading-Dependent Elemental Composition of α -Pinene SOA Particles . Atmos. Chem. Phys. , 9 : 771 – 782 .
- Shilling , J. E. , Chen , Q. , King , S. M. , Rosenoern , T. , Kroll , J. H. , Worsnop , D. R. , McKinney , K. A. and Martin , S. T. 2008 . Particle Mass Yield in Secondary Organic Aerosol Formed by the Dark Ozonolysis of α -Pinene . Atmos. Chem. Phys. , 8 : 2073 – 2088 .
- Smith , G. D. , Woods , E. , DeForest , C. L. , Baer , T. and Miller , R. E. 2002 . Reactive Uptake of Ozone by Oleic Acid Aerosol Particles: Application of Single-Particle Mass Spectrometry to Heterogeneous Reaction Kinetics . J. Phys. Chem. A , 106 : 8085 – 8095 .
- Solomon , S. , Qin , D. , Manning , M. , Alley , R. B. , Berntsen , T. , Bindoff , N. L. , Chen , Z. , Chidthaisong , A. , Gregory , J. M. , Hegerl , G. C. , Heimann , M. B. H. , Hoskins , B. J. , Joos , F. , Jouzel , J. , Kattsov , V. , Lohmann , U. , Matsuno , T. , Molina , M. , Nicholls , N. , Overpeck , J. G. R. , Ramaswamy , V. , Ren , J. , Rusticucci , M. , Somerville , R. , Stocker , T. F. , Whetton , P. , Wood , R. A. and Wratt , D. 2007 . “ IPCC Technical Summary ” . In Climate Change 2007: The Physical Science Basis. Contribution of Working Group I to the Fourth Assessment Report of the Intergovernmental Panel on Climate Change , Edited by: Solomon , D. Q. , Manning , S. M. , Chen , Z. , Marquis , M. , Averyt , K. B. , Tignor , M. and Miller , H. L. Cambridge, UK and New York : Cambridge University Press .
- Ström , L. 1972 . Transmission Efficiency of Aerosol Sampling Lines . Atmos. Environ. , 6 : 133 – 142 .
- Tolocka , M. P. , Heaton , K. J. , Dreyfus , M. A. , Wang , S. , Zordan , C. A. , Saul , T. D. and Johnston , M. V. 2006 . Chemistry of Particle Inception and Growth During α -Pinene Ozonolysis . Environ. Sci. Technol. , 40 : 1843 – 1848 .
- VanReken , T. M. , Greenberg , J. P. , Harley , P. C. , Guenther , A. B. and Smith , J. N. 2006 . Direct Measurement of Particle Formation and Growth from the Oxidation of Biogenic Emissions . Atmos. Chem. Phys. , 6 : 4403 – 4413 .
- Venkatachari , P. and Hopke , P. K. 2008 . Characterization of Products Formed in the Reaction of Ozone with α -Pinene: Case for Organic Peroxides . J. Environ. Monit. , 10 : 966 – 974 .
- Vlasenko , A. , Sjogren , S. , Weingartner , E. , Stemmler , K. , Gäggeler , H. and Ammann , M. 2006 . Effect of Humidity on Nitric Acid Uptake to Mineral Dust Aerosol Particles . Atmos. Chem. Phys. , 6 : 2147 – 2160 .
- Wells , A. C. and Chamberlain , A. C. 1967 . Transport of Small Particles to Vertical Surfaces . Br. J. Appl. Phys. , 18 : 1793 – 1799 .
- Yu , Y. , Ezell , M. J. , Zelenyuk , A. , Imre , D. , Alexander , L. , Ortega , J. , D'Anna , B. , Harmon , C. W. , Johnson , S. N. and Finlayson-Pitts , B. J. 2008 . Photooxidation of α -Pinene at High Relative Humidity in the Presence of Increasing Concentrations of NO x . Atmos. Environ. , 42 : 5044 – 5060 .
- Zelenyuk , A. , Ezell , M. J. , Perraud , V. , Johnson , S. N. , Bruns , E. A. , Yu , Y. , Imre , D. , Alexander , M. L. and Finlayson-Pitts , B. J. 2010 . Characterization of Organic Coatings on Hygroscopic Salt Particles and Their Atmospheric Impacts . Atmos. Environ. , 44 : 1209 – 1218 .