Abstract
We report results from computer simulation of aggregation in a system where during the aggregation process particles at first coalesce to spherical particles and then subsequently the coalescence stops and the particles continue to aggregate to form ramified, fractal aggregates. In the model systems studied in our paper, the regime of coalescence and the regime of fractal aggregation are separated in time scales. Such a two-step aggregation process has recently been observed in the explosive generation of silica nanoparticles in a chamber. Our simple model captures the essential features of the experimental work and presents a non-material specific scaling description. We study growth kinetics, cluster morphology, and cluster size distributions as a consequence of both the coalescence and aggregation stages.
I. INTRODUCTION
A method has been discovered in our laboratory to create ultralow density, porous, high specific surface area materials via gelation of nanoparticles in the aerosol phase (Dhaubadel et al. 2006, 2007, 2009). We have named these materials aerosol gels. The aerosol gels we have made so far are composed of either carbon or silica. Carbonaceous soot aerosols were created by exploding a mixture of acetylene (C2H2) and oxygen in a closed, cylindrical combustion chamber while silica aerosol gels have been created in a similar manner with silane, SiH4.
Experiments show that the primary particle size of the SiO2 aerosol particles could be changed by changing the mass of the inert background gas (Dhaubadel 2008). With no background gas present, a thin, white “paint” of silica was found on the inner walls of the explosion chamber. This indicates that after their creation in the explosive reaction of silane and oxygen the hot silica molecules moved ballistically in the absence of an inert background gas and “splashed” on the chamber walls. When nitrogen was used as a background gas, particles formed that subsequently formed ramified aggregates leading to the formation of an aerosol gel. Helium as a background gas yielded larger particles, mean diameter of 100 nm compared to 16 nm for N2 as a background gas. The particles with He as background gas were found to be more spherical than those for N2 but the distribution of particle size was more polydisperse than for N2. These particles also subsequently aggregate and form an aerosol gel. It is reasonable to conclude that aerosol gel formation is the result of a two-step process. First aggregation to complete coalescence occurs during the brief, ca. 30 msec, high temperature, ca. 5000 K, explosion phase. This is followed by a second phase with no coalescence or sintering to form ramified, fractal aggregates which eventually gel (ca. 100 s). For the first stage it appears that the role of the inert background gas is to remove the large kinetic energy of the hot silica molecules and particles. These observations indicate that the hot, spherical particles of silica stay hot longer in the He than in the N2 and thus coalesce upon collision for a longer time to form larger spherical particles.
These experimental results engender the following question: What happens when during the aggregation process particles coalesce at first and then subsequently these coalesced clusters form ramified aggregates?
Particle sintering, incomplete coalescence, was first described by CitationUlrich and Subramanian (1977). Studies by CitationKoch and Friedlander (1990) considered the relative time scales of sintering and aggregation but did not account for the possible ramified nature of the aggregates. Pratsinis and coworkers (CitationKruis et al. 1993; CitationJohannessen et al. 2001; CitationMuhlenweg et al. 2002; CitationTsantilis and Pratsinis 2004; CitationHeine and Pratsinis 2007) have used both experimental and computational studies to describe the kinetics and resulting morphologies of the aggregates when both aggregation and sintering are at work during flame synthesis of particles. In more recent work, Schmidt et al. (2006) and CitationSander et al. (2009) have studied detailed models of sintering of agglomerates by solving population balance equations. In these model calculations, sintering takes place over a long period of time.
Although these models are well developed for studying sintering and aggregation in flame synthesis, they do not apply to our explosive aerosol generation process described above. In flame aggregation the system is at temperatures ranging from 1000 to 2500 K. In this temperature regime sintering occurs during aggregation. In our explosive generation method, on the other hand, the system starts with a gaseous precursor in the presence of an inert background gas. Then the precursor is ignited and explodes. Temperatures jumps to about 5000 K for a short time and then rapidly cools. At such high temperatures it is assumed that sintering happens completely, coalescence, and instantaneously. A short time later, on the order of 30 msec, the system goes through rapid cooling and sintering stops and aggregation proceeds to form ramified aggregates. The main parameter in determining how long the system stays in the high temperature regime is the background gas.
In this article our method is large scale, Monte Carlo computer simulation in an effort to capture the essential features of our explosion followed by aerosol gelation process with various different background gases. We estimate that the temperature of the silica nanoparticles radiatively cools down to below 1000 K (when sintering practically stops) in times scales of the order of milliseconds. Thus a simulation model where the regime of coalescence and the regime of fractal aggregation separated in time scales is relevant for the experimental study mentioned in the article. We separate the time scales of sintering and aggregation by allowing first aggregation with complete sintering, i.e., coalescence to spherical particles, followed by aggregation with no sintering to yield ramified, fractal aggregates. We find that both the coalescence and ramified aggregation stages exhibit characteristic kinetics, morphologies, and size distributions that can be explained with mean field aggregation theory, and the end result is hybrid aggregates reflecting these stages. This model is the first attempt at modeling aggregates made from an explosive process. Though it is relatively simple compared to simulations used for flame aggregates, our model presents a non-material specific scaling description while capturing the essential features of aerosol gelation in the presence of different background gases.
II. MODEL AND SIMULATION PROCEDURES
Simulations reported in this paper were carried out by using off-lattice Monte Carlo algorithms. There were two distinct stages of the simulations. First was the coalescence stage. In the coalescence stage when monomers collided they merged into a coalesced spherical cluster with a volume equal to sum of the parent particle volumes. The second stage was canonical diffusion limited cluster aggregation (DLCA) (CitationMeakin 1983; CitationKolb et al. 1983; CitationJullien and Botet 1987). In the DLCA stage, clusters ceased to coalesce and instead irreversibly stuck together with point contacts when they touched to form ramified, fractal aggregates.
Initially, monomers of diameter (σ) unity were place randomly in a three dimensional box. The length of the box L (in units of σ) was determined so that a desired monomer volume fraction was reached with a set number of monomers. The maximum number of particles used in the simulation is five million. To remove any edge effects periodic boundary conditions were used. With a large number of particles it becomes too costly to calculate the position of a particle relative to all the other particles in the system. A link-cell method (CitationAllen and Tildesley 1987) was used to run the simulations efficiently.
A. Coalescence Stage
In the coalescence stage, particles are hot and molten and are expected to move either ballistically (CitationMeakin 1984; CitationMulholland et al. 1988) or diffusively depending on the pressure of the background gas (CitationPierce et al. 2006). We model these movements in the following ways:
-
Ballistic Coalescence: At a time t, we choose a coalesced cluster of size N randomly from the available number of clusters N c (t). The probability of movement (p) of that cluster is then calculated based on the thermal velocity of the cluster and one can write p ∼ N − 1/2. This probability of movement is then compared to a random number between 0 and 1. If the random number is smaller than the probability of movement, the cluster is moved a distance of one monomer diameter σ. Whether the cluster moves or not, time is incremented by N c − 1(t) (CitationJullien and Botet 1987). If the cluster happens to move it does so on a straight line in a random direction. This direction of movement stays constant till a collision occurs and at that point another direction is randomly chosen for the newly formed coalesced cluster to move also on a straight line.
-
Diffusive Coalescence: The probability of cluster movement (p) for the diffusive case is defined as a cluster's relative diffusion constant p ∼ D n /D 0 where D n is the diffusion constant of the cluster and D 0 is the diffusion constant of a monomer. In the continuum limit, this probability of movement can be written as p ∼ 1/R g where R g is the radius of gyration of the cluster.
-
Coalescence phase continues until a predetermined time t D is reached. Beyond this point, the simulation moves over to the aggregation phase.
B. DLCA Stage
Simulation in the DLCA stage starts from the polydisperse system of coalesced clusters obtained at t D . The motion is solely diffusive. A time step consists of randomly picking a ramified cluster of size N from the available N c (t) clusters. The probability of cluster movement (p) is based on the cluster's radius of gyration as p ∝ 1/R g and as before, whether the cluster is moved or not time is incremented by N c − 1(t). If the cluster does move, it moves in a random direction for a distance of one monomer diameter σ.
III. SCALING ANALYSIS
A. Scaling Analysis of the Aggregation Kernel
Kinetics of aggregation in dilute systems is described by the mean-field Smoluchowski equation (SE) (CitationFriedlander 2000), expressing the rate of change of cluster concentration, n k (t), containing k monomers per cluster as
The kernel K(i, j) expresses the rate of aggregation or coalescence between clusters of size i with clusters of size j.
If K is a homogeneous function of cluster size, i.e., K(ai, aj) = a λ K(i,j), where λ is the degree of homogeneity, the solutions to the SE are self-preserving scaling solutions for n k . If one further assumes that the cluster size distribution is approximately monodisperse, one can write the appropriate collision kernel as:
The kinetic exponent z, which characterizes the power-law growth with time of the average cluster size, is related to the homogeneity λ by:
Simple scaling arguments can be invoked (CitationFry et al. 2002; CitationPierce et al. 2006) to pinpoint limiting cases of the functional form of the kernel, and hence determine the homogeneity. The rate at which two clusters collide, K, is proportional to their relative collision cross-sectional area A and relative velocity, v, yielding K ∼ Av, consistent with the units of [L 3 t]. One typically writes this as A ∼ R g 2 where R g is the radius of gyration of a cluster with number of particles N. For a fractal cluster, R g ∼ N 1/D f where D f is the fractal dimension of the cluster while for a compact, spherical cluster (appropriate in the coalescence stage) R g ∼ N 1/3. In addition, since N c · N = constant (= the number of monomers), one easily finds that R(t) ∼ N v where v = z/D f for fractal clusters and v = z/3 for compact clusters.
In the ballistic regime, v ∼ N − 1/2 via the equipartition of energy. Since R g ∼ N 1/3 here, one finds that K ∼ N 2/3 − 1/2∼ N 1/6 or λ = 1/6 and z = 1.2 (Coalescence with a ballistic motion)
One also obtains ν = z/3 = 0.4 (Coalescence with a ballistic motion)
In the diffusive case, one can still use the dimensionally correct form K ∼ Av but now v becomes a characteristic velocity relevant for diffusion. This velocity must scale as
B. Scaling Analysis of Cluster Size Distribution
As aggregation proceeds in a system, the cluster size distribution develops a scaling form given by (van Dongen and Ernst 1985): n(k,t) = M 1 s −2ϕ(x) where n(k,t) is the number of clusters of size k at time t, M1(t) is the 1st moment of the distribution and s is the average size. The scaling variable x = k/s is the size of a cluster scaled by the average size and the scaled distribution has this functional form ϕ (x) = Ax− λe- α x for large sizes (x > 1) with α = 1 – λ and A = α2 − λ/Γ (2-λ) (CitationOh and Sorensen 1997a).
IV. SIMULATION RESULTS
A. Coalescence Stage
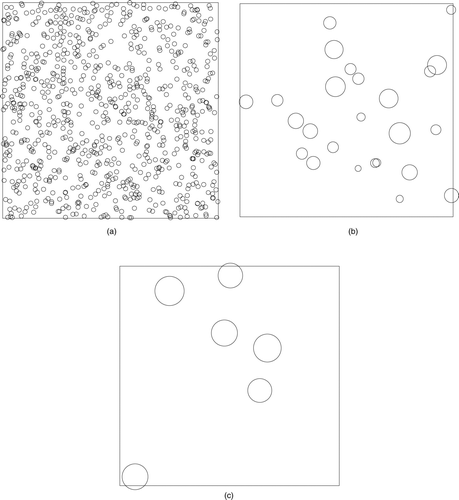
The coalescence stage was studied using two different growth models; ballistic and diffusive. Both were studied with monomer volume fraction of f = 0.001. In we show 2d projection snapshots of part of the system at 0, 5000, and 40,000 time steps, respectively. Here, monomers moved ballistically which yields an average diameter of 7σ at 40,000 time steps.
FIG. 1 Snapshots of the system during the ballistic coalescence phase. The volume fraction if f v = 0.001. 2D projections of part of the system are shown at Monte Carlo time steps 0, 5000, 40,000, respectively. The apparent overlap is due to projection of the 3d volume onto a 2d surface; all clusters are spherical.
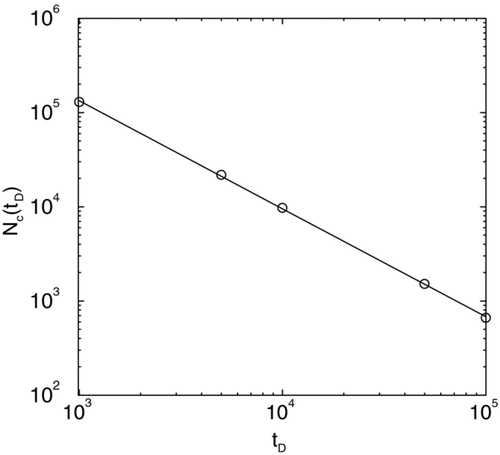
In we plot the number of coalesced clusters N c (t D ) versus time t D in a log-log graph during coalescence with a ballistic movement of the particles. The slope of the straight line yields the kinetic exponent z = 1.2 in excellent agreement with a scaling analysis presented before. We also note that the average size of the coalesced clusters < R(t D ) > when plotted versus t D in a log-log graph yields an exponent of v = 0.4 in excellent agreement with scaling results.
FIG. 2 Number of particles N c (t D ) versus time t D shown in a log-log plot during coalescence with a ballistic movement of the particles. The slope of the straight line yields the kinetic exponent z = 1.2.
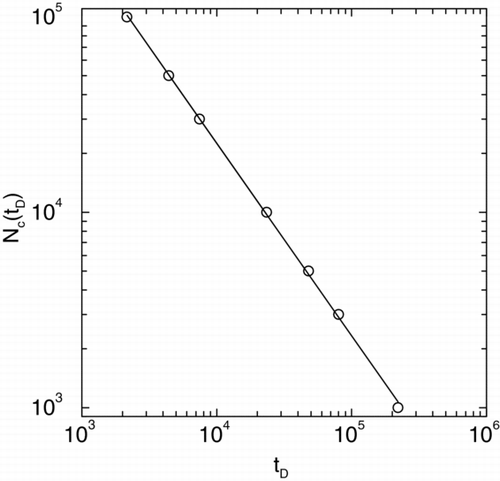
In contrast, for coalescence with a diffusive motion of clusters we obtain z = 1 () in agreement with scaling results. Scaling would predict v = 1/3 in this case. Such a value of v = 1/3 is also seen in the simulations.
FIG. 3 Number of particles N c (t D ) versus time t D shown in a log-log plot during coalescence with a diffusive movement of the particles. The slope of the straight line yields the kinetic exponent z = 1.
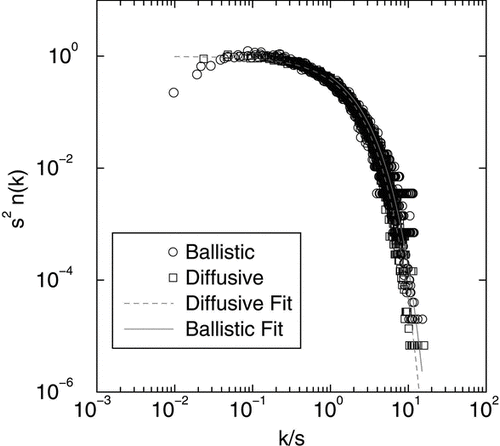
In we have plotted the scaled size distributions for both ballistic and diffusive coalescence at t D for a number of different values of t D . For the range x > 1, excellent agreement with the scaling prediction is found as shown in .
FIG. 4 Scaled form of ballistic and diffusive particle size distributions at t D for various values of t D . The scaled distribution has the functional form ϕ (x) = Ax− λe- α x for large sizes (x > 1) with α = 1 – λ with ≈ (ballistic coalescence) = 1/6 and λ (diffusive coalescence) = 0.
B. DLCA Stage
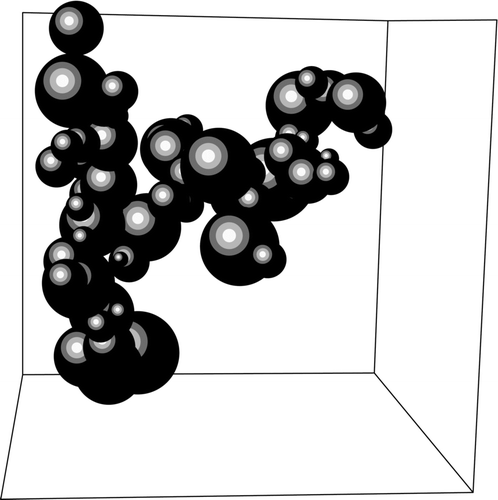
After the coalescence phase, there are 10,000 polydisperse monomers present in the simulation box at t D . Diffusive limited cluster-cluster aggregation to fractal aggregates occurred beyond time t D . The initial monomer size distribution in DLCA is thus a set of poly-disperse coalesced clusters obtained from either ballistic or diffusive aggregation with coalescence. shows an example of a ramified cluster formed with polydisperse coalesced clusters from ballistic coalescence as monomers.
FIG. 5 A typical cluster formed from DLCA with ballistic monomer mass distribution. This snapshot was taken at 2,000,000 time steps.
Since the number of monomers at this DLCA stage is much smaller than in the coalescence phase, we compute inverse cluster count N c − 1(t) − N c − 1(t = 0) instead of just the cluster number N c (t). In we show N c − 1(t) − N c − 1(t = 0) versus time t in a log-log plot () for mono-disperse DLCA and DLCA with polydisperse distributions originating from both ballistic and diffusive coalescence as discussed before. Slope for each of these curves yields z = 1 in agreement with diffusive scaling. The slight increase in slope seen for the pure DLCA case at late times originates from cluster crowding (CitationFry et al. 2002).
FIG. 6 Log-log plot of inverse cluster count N c − 1(t) − N c − 1(t = 0) versus time t for mono-disperse DLCA and DLCA with poly-disperse distributions originating from both ballistic and diffusive coalescence as discussed before. Slope for each of these curves yields z = 1 in agreement with diffusive scaling. Since the number of monomers at this DLCA stage is much smaller than in the coalescence phase, we compute inverse cluster count N c − 1(t) − N c − 1(t = 0) instead of just the cluster number N c (t). At final times (t D = 100,000 for diffusive coalescence and t D = 40,000 for ballistic coalescence) both diffusive and ballistic coalescence yield an average particle diameter of 7σ.
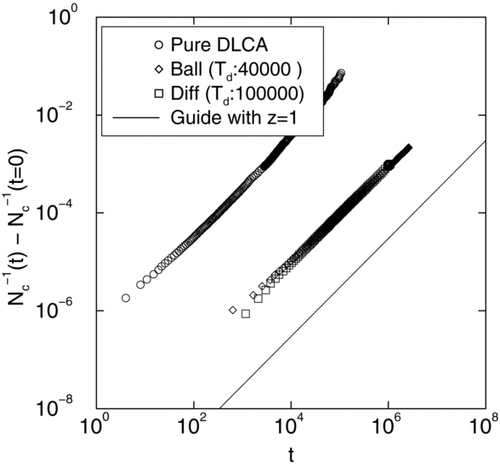
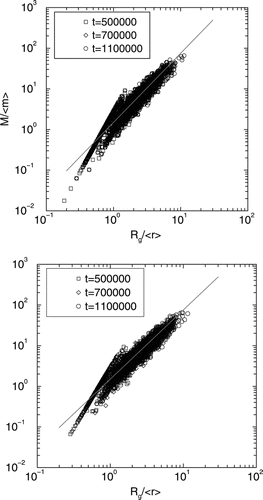
FIG. 8 (a) Log-log graph of mass of the clusters M rescaled by the average particle mass < m > versus the radius of gyration of the clusters rescaled by the average particle radius < r > for ballistic coalescence initial particle distributions. There are two distinct zones in this graph. Below Rg/〈 r 〉 = 1 the clusters are compact (dimers, trimers, and other small non-fractal clusters) and yield an exponent of D f = 3. Above this value of Rg/〈 r〉, the straight line fit to the data yields D f = 1.7± 0.1. (b) Same as in 8 (a) except for diffusive coalescence initial particle distributions. As before, there are two distinct zones in this graph. Below Rg/〈 r〉 = 1 the clusters are compact (dimers, trimers, and other small non-fractal clusters) and yield an exponent of D f = 3. Beyond this value of Rg/〈 r〉, the straight line fit to the data yields D f = 1.7± 0.1.
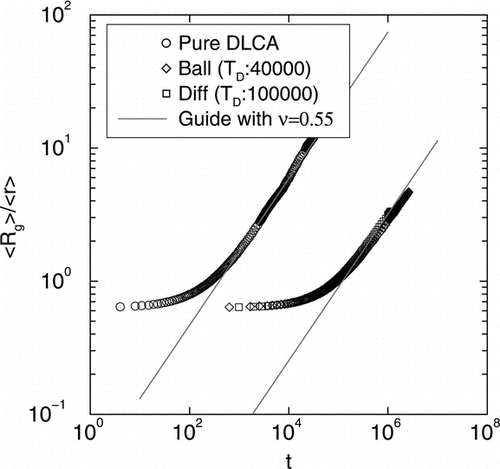
shows log-log plots of average radius of gyration of clusters 〈Rg〉 versus time t in for mono-disperse DLCA and DLCA with poly-disperse distributions originating from both ballistic and diffusive coalescence. The straight line part for all three curves yield an exponent of ν = 0.55. Note that the radius of gyration of the clusters are smaller when DLCA process starts with a poly-disperse distribution.
FIG. 7 Log-log plots of average radius of gyration of clusters < R g > versus time t for mono-disperse DLCA and DLCA with poly-disperse distributions originating from both ballistic and diffusive coalescence. The straight line part for all three curves yield an exponent of υ = 0.55.
Next we study the fractal dimension of the clusters formed in the DLCA process. In and , we show log-log graph of mass of the clusters M at various times rescaled by the average particle mass versus the radius of gyration of the clusters (R g ) rescaled by the average particle radius for both ballistic and diffusive coalescence initial particle distributions, respectively. There are two distinct zones in this graph. Below R g /< r > = 1 the clusters are compact (dimers, trimers, and other small non-fractal clusters) and yield an exponent of D f = 3. For R g /< r > > 1, the straight line fit to the data yields D f = 1.7± 0.1 in each case. The prefactor k 0 obtained from this study (k 0 = 1.5± 0.1) is consistent with previous simulation studies (CitationSorensen and Roberts 1997; CitationOh and Sorensen 1997b; CitationPierce et al. 2006) of DLCA aggregation in both lattice and off-lattice geometries.
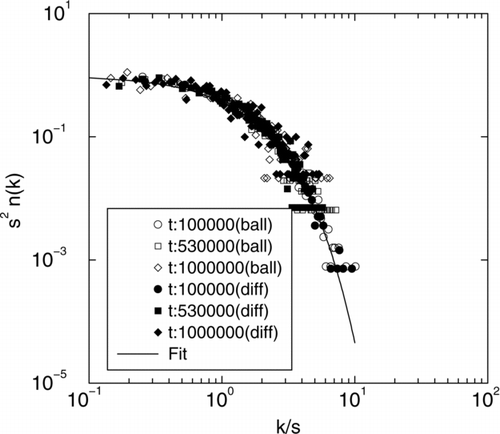
The scaling form for both DLCA with ballistic and diffusive coalescence is shown in . The scaling function ϕ (x) = x − λ e − α x with α = 1 − λ and for DLCA a homogeneity of λ = 0 was plotted with the mass distribution data and shows excellent agreement.
FIG. 9 Scaling of DLCA with ballistic and diffusive monomer mass distributions. Scaling function is ϕ (x) = x − λ e − α x with λ = 0 agrees well with the data.
V. SUMMARY AND CONCLUSIONS
In summary, we have carried out computer simulation of aggregation in a system where during the aggregation process, particles coalesce at first and then subsequently these coalesced clusters stop coalescing and form ramified, fractal aggregates. In the coalescence stage, particles move either ballistically or diffusively up to a certain time t D . Next these coalesced clusters move diffusively and aggregate to form ramified aggregates.
We have found the kinetic exponent z in the coalescence stage depends on the type of cluster motion (ballistic or diffusive). Results for z in each case are in agreement with a scaling description developed by us. However, once the system moves over to the DLCA stage, one recovers pure DLCA results for both the kinetic exponent and the fractal dimension of the ramified clusters. Thus the coalescence induced polydispersity of the primary particles for the DLCA stage does not affect the DLCA stage outcomes.
The polydispersity of the coalesced clusters is determined by the mean field aggregation kinetics. Thus both the primary particle kinetics of growth and size distribution in a fractal aggregate could be used as indicator of a previous regime of particle-particle aggregation with coalescence and thereby distinguished from other mechanisms of primary particle formation such as nucleation and surface growth.
This work is supported by a Targeted Excellence grant from Kansas State University.
Related Research Data
REFERENCES
- Allen , M. P. and Tildesley , D. J. 1987 . Computer Simulation of Liquids , Oxford : Oxford University Press .
- Dhaubhadel , R. , Pierce , F. , Chakrabarti , A. and Sorensen , C. M. 2006 . Hybrid Superaggregate Morphology as a Result of Aggregation in a Cluster-Dense Aerosol . Phys. Rev. E , 73 : 011404 – 4 .
- Dhaubhadel , R. , Gerving , C. , Chakrabarti , A. and Sorensen , C. M. 2007 . Aerosol Gelation: Synthesis of a Novel Lightweight, High Specific Surface Area-Material . Aerosol Sci. Tech. , 41 : 804 – 810 .
- Dhaubhadel , R. , Chakrabarti , A. and Sorensen , C. M. 2010 . Light Scattering Study of Aggregation Kinetics in Dense, Gelling Aerosols . Aerosol Sci. Tech. , 43 : 1053 – 1063 .
- Dhaubhadel , R. 2008 . An Experimental Study of Dense Aerosol Aggregations , Ph.D. thesis Kansas State University .
- Friedlander , S. K. 2000 . Smoke, Dust and Haze , New York : Oxford University Press .
- Fry , D. , Sintes , T. , Chakrabarti , A. and Sorensen , C. M. 2002 . Enhanced Kinetics and Free-Volume Universality in Dense Aggregating Systems . Phys. Rev. Lett , 89 : 148301 – 4 .
- Heine , M. C. and Pratsinis , S. E. 2007 . Polydispersity of Primary Particles in Agglomerates Made by Coagulation and Sintering . Aerosol Sci , 38 : 17 – 38 .
- Johannessen , T. , Pransinis , S. E. and Livbjerg , H. 2001 . Computational Analysis of Coagulation and Coalesnce in the Flame Synthesis of Titania Particles . Powder Technol. , 118 : 242 – 250 .
- Jullien , R. and Botet , R. 1987 . Aggregation and Fractal Aggregates , Hackensack, NJ : World Scientific .
- Koch , W. and Friedlander , S. K. 1990 . The Effect of Particle Coalescence on the Surface-Area of a Coagulating Aerosol . J. Coll. Interf. Sci , 140 : 419 – 427 .
- Kolb , M. , Botet , R. and Jullien , R. 1983 . Scaling of Kinetically Growing Clusters . Phys. Rev. Lett. , 51 : 1123 – 1126 .
- Kruis , F. E. , Kusters , K. A. , Pratsinis , S. E. and Scarlet , B. 1993 . A Simple Model for the Evolution of the Characteristics of Aggregate Particles Undergoing Coagulation and Sintering . Aerosol Sci. Technol , 19 : 514 – 526 .
- Meakin , P. 1983 . Formation of Fractal Clusters and Networks by Irreversible Diffusion-Limited Aggregation . Phys. Rev. Lett. , 51 : 1119 – 1122 .
- Meakin , P. 1984 . Computer-Simulation of Cluster-Cluster Aggregation Using Linear Trajectories—Results from 3-Dimensional Simulations and a Comparison with Aggregates Formed Using Brownian Trajectories. . J. Coll. Interf. Sci. , 102 : 505 – 512 .
- Muhlenweg , H. , Gutsch , A. , Schild , A. and Pratsinis , S. E. 2002 . Process Simulation of Gas-to-Particle-Synthesis via Population Balances: Investigation of Three Models . Chem. Eng. Sci. , 57 : 2305 – 2322 .
- Mulholland , G. W. , Samson , R. J. , Mountain , R. D. and Ernst , M. H. 1988 . Cluster Size Distribution for Free Molecular Agglomeration . Energy and Fuels , 2 : 481 – 486 .
- Oh , C. and Sorensen , C. M. 1997a . Light Scattering Study of Fractal Cluster Aggregation Near the Free Molecular Regime . J. Aerosol Sci , 28 : 937 – 957 .
- Oh , C. and Sorensen , C. M. 1997b . The Effect of Overlap Between Monomers on the Determination of Fractal Cluster Morphology . J. Coll. Inter. Sci , 193 : 17 – 25 .
- Pierce , F. , Sorensen , C. M. and Chakrabarti , A. 2006 . Computer Simulation of Diffusion-Limited Cluster-Cluster Aggregation with an Epstein Drag Force . Phys. Rev. E , 74 : 021411 – 8 .
- Sander , M. , West , R. H. , Celnik , M. S. and Kraft , M. 2009 . A Detailed Model for the Sintering of Polydispersed Nanoparticle Agglomerates . Aerosol Sci. Technol. , 43 : 978 – 989 .
- Schmid , H. J. , Al-Zaitone , B. , Artelt , C. and Peukert , W. 2006 . Evolution of the Fractal Dimension for Simultaneous Coagulation and Sintering . Chem. Eng. Sci. , 61 : 293 – 305 .
- Sorensen , C. M. and Roberts , G. C. 1997 . The Prefactor of Fractal Aggregates . J. Coll. Interf. Sci. , 186 : 447 – 452 .
- Tsantilis , S. and Pratsinis , S. E. 2004 . Soft-and Hard-Agglomerate Aerosols Made at High Temperatures . Langmuir , 20 : 5933 – 5939 .
- Ulrich , G. D. and Subramanian , N. S. 1977 . Coalescence as a Rate-Controlling Process. . Combust. Sci. Techol. , 17 : 119 – 126 .
- van Dongen , P. G. J. and Ernst , M. H. 1985 . Dynamic Scaling in the Kinetics of Clustering. . Phys. Rev. Lett. , 54 : 1396 – 1399 .