Abstract
Measurements of particle number concentration (N), black carbon (BC), and PM 10 , PM 2.5 , and PM 1 levels and speciation were carried out at an urban background monitoring site in Barcelona. Daily variability of all aerosol monitoring parameters was highly influenced by road traffic emissions and meteorology. The levels of N, BC, PM X , CO, NO, and NO 2 increased during traffic rush hours, reflecting exhaust, and non-exhaust traffic emissions and then decreased by the effect of breezes and the reduction of traffic intensity. PM 2.5–10 levels did not decrease during the day as a result of dust resuspension by traffic and wind. N showed a second peak, registered in the afternoon and parallel to O 3 levels and solar radiation intensity, that may be attributed to photochemical nucleation of precursor gases. An increasing trend was observed for PM 1 levels from 1999 to 2006, related to the increase in the traffic flow and the diesel fleet in Barcelona. PM composition was highly influenced by road traffic emissions, with exhaust emissions being an important source of PM 1 and dust resuspension processes of PM 2.5–10 , respectively.
1. INTRODUCTION
Air quality at urban background sites is strongly influenced by road traffic emissions, being the most important emission source concerning its contribution to ambient PM levels. The daily evolution of aerosol levels is in general very influenced by road traffic emissions and this influence may be observed in the evolution of levels of all the aerosol grain size ranges (ultrafine, fine, or coarse aerosols) and all the monitoring parameters, such as number concentration (N), black carbon concentration (BC), or mass concentrations (PM10, PM2.5, and PM1, Harrison et al. 2000; Rodriguez et al. 2008).
Vehicles produce exhaust and non-exhaust emissions. Aerosol exhaust emissions can be emitted directly as particles (soot, carbonaceous aggregates formed during fuel combustion in the engine, CitationFraser et al. 2003; CitationBrandenbergera et al. 2005) or formed during the emission, dilution, mixing and cooling of the vehicle exhaust gases in ambient air (nucleation of H2O-H2SO4 and some semi-volatile organic compounds, Rodriguez et al. 2007; Casati et al. 2007; Jamriska et al. 2008; Robinson et al. 2007). Both type of exhaust particles are mainly accumulated in the size range < 100 nm and are found in high concentrations near emission sources (CitationMorawska et al. 1998). Nanoparticle size distributions change rapidly with the distance to the emission sources as nucleation mode particles grow fast by coagulation and condensation processes (CitationCharron et al. 2003; CitationZhang and Wexler, 2004; CitationZhang et al. 2004). Diesel engines are the most important primary particle exhaust emitters (CitationMaricq 2007). Non-combustion traffic-related PM sources are the result of the resuspension of road dust originating from the mechanical wear and degradation of tires, brakes, and pavement abrasion (CitationWåhlin et al. 2006; CitationKupiainen, 2007; CitationAmato et al. 2009a).
Air quality at urban backgrounds depends on the local emissions but also on the regional emissions and the geographic and meteorological characteristics of the area. Different meteorological situations give rise to characteristic air pollution episodes. For example, long-range transport (African dust outbreaks or transport from Europe) carry exotic pollutants (CitationEscudero et al. 2005), whereas episodes of atmospheric stability favor the accumulation of local pollutants, and Atlantic advections clean the atmosphere. Consequently, formation, transport, and dispersion of pollutants in urban areas should be studied locally.
The current development of aerosol monitoring technologies makes the real-time continuous measurements of aerosol concentrations with different metrics possible, as well as the characterization and quantification of the different aerosol components. However, available data on long-term monitoring of PM1, N, or BC concentration levels is very scarce in Mediterranean countries.
Air quality monitoring directives require the measurement of PM10 and PM2.5 concentration levels. However, at urban environments monitoring of fine (< 1 μm) and ultrafine (< 0.1 μ m) particles becomes very important, as the finer fractions are closely related to road traffic emissions and to important health effects (CitationPope and Dockery 2006). The monitoring of N, BC, PM1, and PM10, and the chemical characterization of major PM components are very important for the establishment of pollution abatement strategies in urban areas.
2. OBJECTIVES
The influence of road traffic emissions on the different aerosol concentration metrics (PM10, PM2.5, PM1, BC, and N) at an urban background site in the Western Mediterranean is studied in this article as daily, seasonal and inter-annual evolution. Moreover, the influence of traffic exhaust or non-exhaust emissions on major PM X components (carbonaceous compounds (OM + EC), secondary inorganic aerosols (SIA), mineral matter, and trace elements) is also evaluated.
3. METHODOLOGY
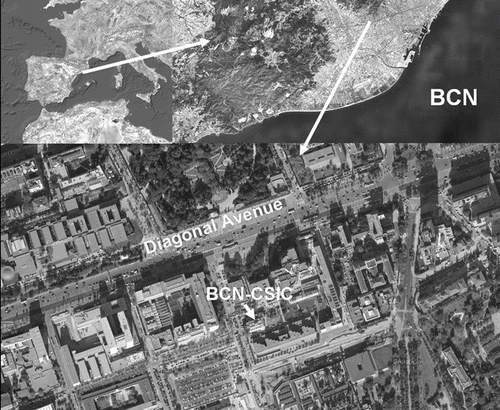
PM10, PM2.5, and PM1 levels and speciation and particle number concentrations (N) have been monitored since November 2003 at BCN-CSIC urban background site (North-Eastern Iberian Peninsula, 41°23′N; 2°07′E; 68 m.a.s.l.). It is located on the terrace of a two storey building at 150 m of one of the main Avenues of the city (Diagonal Avenue, traffic density 120,000 vehicles day−1, > 40% diesel in vehicle fleet, ). Black carbon levels (BC) measured as absorption coefficients were continuously monitored at the same site from July to November 2007. In addition, PM monitoring data from 1999 from other urban sites with similar characteristics in Barcelona was used to support interpretations.
FIG. 1 Location of BCN-CSIC urban background monitoring site.
The main local source of atmospheric particulate matter in the Barcelona urban area is road traffic. However, other anthropogenic (port emissions, small industry, domestic emissions, demolition, and construction activities) and natural (African dust outbreaks, marine, and biogenic aerosols) sources contribute to increase the levels of PM (CitationAmato et al. 2009b).
BC levels were monitored by using a Multi-Angle Absorption Photometer (MAAP, Thermo ESM Andersen Instruments). Particle number concentration (N) was continuously monitored (5 min basis) by means of condensation particle counters (CPC) water-based condensation particle counter (WCPC TSI 3785; 5–1000 nm) from July 2005. Simultaneously, PM10, PM2.5, and PM1 levels were continuously monitored (hourly basis) using optical particle counters GRIMM 1107 and 1108. PM data were corrected with simultaneous 24 h gravimetric samples using high volume samplers (MCV) with DIGITEL PM10, PM2.5, and PM1 inlets (standard measurements). Chemical analyses were performed following the methodology detailed in CitationQuerol et al. (2001).
Levels of gaseous pollutants were supplied by the Department of Environment of the Government of Catalonia from a nearby (1 km) air quality monitoring site (L'Hospitalet-Gornal). Meteorological variables (atmospheric pressure, wind components, solar radiation, temperature and relative humidity) from a nearby meteorological station (100 m distant from our measurement site) were provided by the Faculty of Physics from Barcelona University. Boundary layer heights were calculated using the meteorological model of NOAA Air Resources Laboratory (ARL, www.arl.noaa.gov/readyamet.html). Traffic data were supplied by the Council of Barcelona (Serveis de Mobilitat) and Dirección General de Tráfico (DGT).
Additionally, 120 h back-trajectories ending in Barcelona calculated with the Hysplit model (CitationDraxler and Rolph 2003), aerosol and surface dust concentration maps (BSC-DREAM, NAAPS and SKIRON) and satellite images (SEAWIFS and NASA) were used for the interpretation of the daily meteorological scenarios.
Temporal trends were analyzed by means of the nonparametric Mann–Kendall test for the trend and the nonparametric Sen's method for the magnitude of the trend. To this end, the MAKESENS template application (CitationSalmi et al. 2002) was employed.
4. RESULTS AND DISCUSSION
Mean annual PM levels measured at BCN-CSIC urban site during the year 2007 (calculated from daily means ± standard deviations) were 38 ± 15, 25 ± 10, and 17 ± 8 μ g m−3 for PM10, PM2.5, and PM1, respectively, and simultaneous mean annual N levels were 24790 ± 8160 cm−3. Mean daily BC levels for the measurement period available (July–November 2007) were 3.6 ± 1.8 μ g m−3. Mean, maximum, and minimum hourly levels and the standard deviation for all parameters measured at BCN-CSIC, gaseous pollutants, and some meteorological variables are shown in . PM, N, and BC data obtained are comparable to levels reported in other European urban background sites (CitationVan Dingenen et al. 2004; CitationPutaud et al. 2004; CitationQuerol et al. 2004; CitationPuustinen et al. 2007) but exceedances of the PM10 daily limit value fixed by the European Air quality directive 2008/50/CE are frequently recorded (66 exceedances of the 50 μg PM10m−3 daily limit were recorded during 2007).
TABLE 1 Mean, minimum, and maximum hourly levels and % standard deviation for PM10, PM2.5, PM1, N, BC, SO2, NO, NO2, O3, CO, T, RH, Wind speed, boundary layer depth and traffic intensity measured in Barcelona during July–November 2007
Daily Cycles
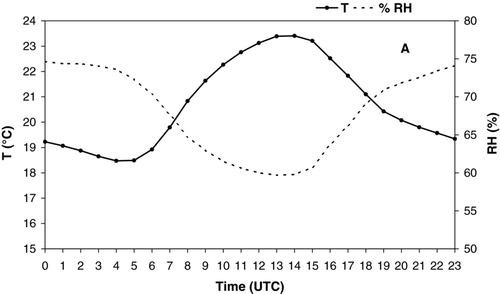
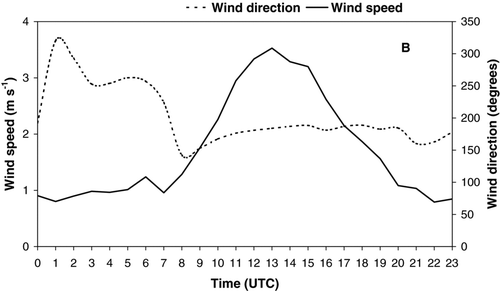
Variability of all aerosol parameters monitored at BCN-CSIC site (N, BC, PM10, PM2.5, and PM1 levels and composition) was clearly influenced by road traffic emissions and meteorology (mainly breeze circulations). The daily evolution of breezes in Barcelona is characterized by a change in direction from Northwestern to South at around 8 h UTC and an increase in wind speed starting around the same time to reach the maximum value at 13 h UTC and then decreasing gradually until reaching its minimum in the evening (). The evolution of the aerosol parameters measured was studied in relation to the ratio traffic intensity/wind speed, as both variables affect significantly the variability of atmospheric pollutants (Rodriguez et al. 2008).
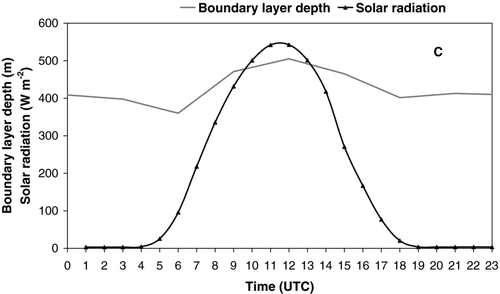
FIG. 2 Mean daily variation of temperature and relative humidity (a), wind speed and wind direction, (b) and solar radiation and boundary layer depth (c) calculated from hourly means for the period July–November 2007.
The increase in aerosol levels during morning rush hours as a result of direct road traffic emissions is observed for all the parameters considered but this increase is more marked in the cases of N and BC (reflecting mostly direct exhaust emissions, ) and PM2.5−10 (reflecting road dust resuspension, ). Daily cycles of some atmospheric gaseous pollutants emitted mostly by traffic exhausts (NO, NO2, CO) are also marked by road traffic evolution ().
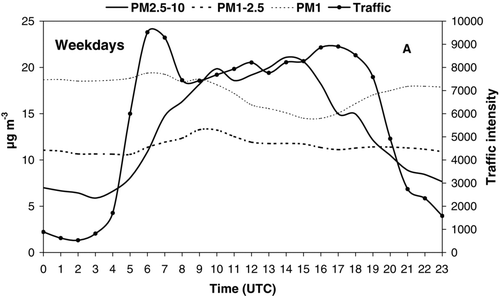
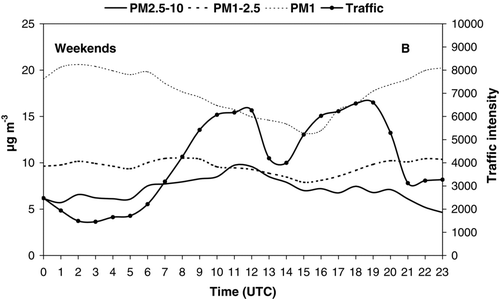
FIG. 3 Mean daily evolution of black carbon concentration (BC) and particle number concentration (N) at BCN-CSIC site and road traffic intensity/wind speed ratio evolution at Barcelona Diagonal Avenue on weekdays (a) and weekends (b) measured simultaneously during the period July–November 2007.
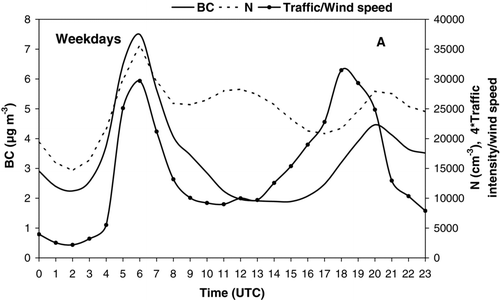
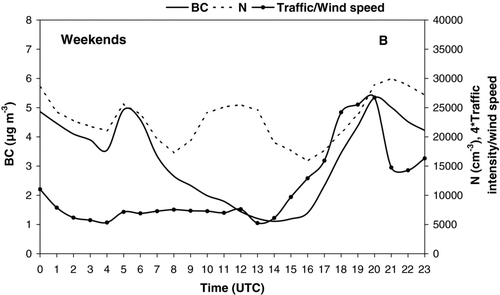
Number concentration increases with road traffic intensity in the morning owing to ultrafine particle vehicle emissions and formation of new particles during dilution and cooling of the vehicle exhaust (Mariq et al. 2007; ). This peak is favored by the increase in traffic emissions and the lower wind speed registered in the morning (CitationCasati et al. 2007), decreasing as the traffic/wind speed ratio decreases (reduction of emissions and increase in wind speed). N shows a second peak at noon-afternoon that may be attributed to new particle formation by photochemically induced nucleation by the higher solar radiation intensity, and by dilution of aerosols due to the growth of the mixing layer (CitationRodríguez et al. 2007, ), but also to maximal pollutants transport from the central urban area. The evening traffic peak is also observed. During the night N decreases owing to the decrease of the traffic flow and probably to the thinning of the boundary layer depth () that favors condensation and coagulation processes reducing ultrafine particle number (CitationMinoura and Takekawa 2005). N peaks were lower during weekends except for the N afternoon increase that was more enhanced (). This could be a consequence of the lower concentrations of atmospheric pollutants registered during weekends, that favor nucleation processes instead of condensation on the surface of particles (CitationHämeri et al. 1996; CitationPey et al. 2008).
The levels of BC follow the same evolution as N levels in the morning (), but conversely to N levels, BC levels decrease sharply during the central hours of the day, following the traffic intensity/wind speed ratio. This behavior may be attributed to (a) the increase in wind speed and to the change of wind direction during the day (at around 8 h) from North-West to South, where road traffic is less intense; (b) the growth of the mixing layer, and (c) the decrease of the traffic flow. In the evening rush hour, BC levels start to increase again showing a second maximum at 20 h. Levels decrease during the night, owing to the reduction of vehicle emissions. Reduced traffic emissions on weekends result in a lower BC morning peak. Conversely, a higher evening peak is observed as a consequence of night life activities around the monitoring site and traffic from the return of the weekend holidays on Sundays.
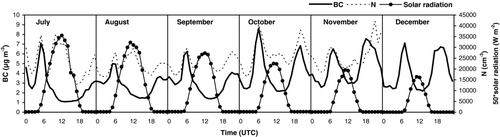
The relationship between N and BC levels was studied by representing the daily evolution of N/BC ratio (). A clear increase in N/BC is observed during the central hours of the day, coincident with maximum solar radiation intensity. This peak in N levels is probably caused by photochemical nucleation processes that increase the N levels while the BC levels are reduced by wind speed and direction changes. During the night there is no significant variation of the N/BC ratio. The weekend N/BC peak was higher, explaining the favored photochemical nucleation processes that are observed when atmospheric pollutant levels are lower (CitationHämeri et al. 1996; CitationPey et al. 2008). The photochemical nucleation processes affecting the N noon peak are confirmed by studying the influence of the solar radiation intensity on the seasonal variation of the N peak. The difference between N levels and BC levels in the afternoon is reduced as the solar radiation intensity decreases from July to November (). However the difference between N and BC peaks at traffic rush hours do not show a significant variation.
FIG. 4 Mean daily evolution of the N/BC ratio (106/μg) calculated from hourly means for the period July–November 2007.
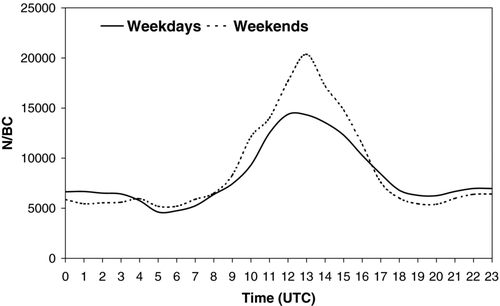
FIG. 5 Seasonal evolution of the daily variation of N and BC levels measured at BCN-CSIC site and the solar radiation evolution measured simultaneously during the period July–November 2007.
The hourly evolution of PM levels is not as clear as observed for N or BC levels (especially the finer fractions). During the week PM2.5 − 10 starts to increase in the morning when traffic flow starts () owing to the direct dust resuspension by road traffic. Conversely to BC evolution, PM2.5 − 10 levels do not decrease during the day with the ratio traffic/wind speed, probably because PM2.5 − 10 levels daily cycle (coinciding with the temperature and wind speed evolution and inverse to humidity) is also very affected by wind resuspension that arises not only from road traffic but from construction/demolition activities occurring frequently in the area during the sampling period. Coarse particle emissions decrease visibly at night as a consequence of the reduction in the traffic flow and wind speed. PM1 − 2.5 and PM1 levels increase slightly in the morning after the traffic rush hour (the finer fractions mass is mainly due to secondary particle formation, CitationZhang et al. 2004) and then decrease gradually during the day probably as a consequence of the increase of the boundary layer height and the increase of wind speed that produces the dispersion and dilution of fine atmospheric pollutants (). Conversely to the other parameters, PM1 − 2.5 and PM1 levels do not decrease at night. This may be a result of the decrease of the boundary layer height and the lower temperatures and higher relative humidity occurring during the night, which favor condensation and coagulation processes between particles and precursor gases and contribute to the formation of particles in the accumulation mode (CitationJamriska et al. 2008). PM levels during the weekends were reduced as a consequence of the lower road traffic intensity, especially the coarse fraction.
FIG. 6 Mean daily evolution of PM 2.5 − 10, PM1 − 2.5, and PM1 levels at BCN-CSIC site and road traffic intensity at Barcelona Diagonal Avenue on weekdays (a) and weekends (b) measured simultaneously during the period July–November 2007.
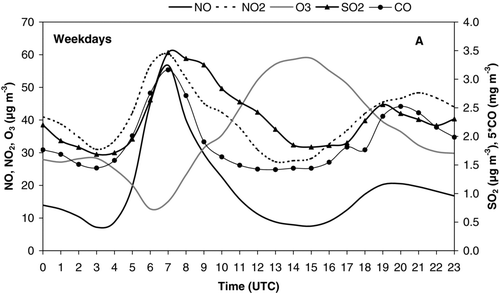
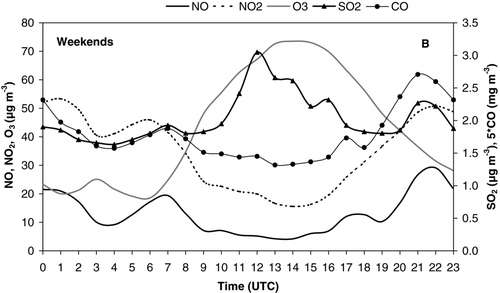
During the week, the levels of atmospheric gaseous pollutants related to vehicle exhaust emissions (CO, NO, and NO2) also follow the traffic intensity/wind speed ratio evolution, with maxima during the morning rush hour, decreasing during the day because of dilution processes and increasing in the evening again (). Levels remain high during the night as a consequence of the reduction of the boundary layer height and lower wind speeds that prevent the dispersion of pollutants. The reduction of road traffic flow intensity during the weekends, results in lower morning and evening peaks and a different evolution of CO, NO, and NO2 levels. During the week, SO2 levels increase in the morning together with CO, NO, and NO2, revealing that traffic is partially a source to this pollutant, although its decrease is slower than for the rest of the gases. Conversely, SO2 maximum peak during the weekends is observed at noon, coinciding with the maximum wind speed and southern wind direction. As a result, SO2 evolution may be related to shipping emissions from the port (to the south of the BCN-CSIC site) and thus the daily cycle of this pollutant may be driven by its transport by the wind. O3 levels increase in the afternoon both during weekdays and weekends, following the N noon peak and the solar radiation intensity, as its formation depends on photochemistry. However, during the weekends, the peak is higher. This observation may be related to the effect of the lower general pollution levels observed during the weekends reducing the interaction of O3 with other species as NO X or carbonaceous compounds.
FIG. 7 Mean daily evolution of the levels of NO, NO2, O3, SO2, and CO measured at L'Hospitalet-Gornal site in weekdays (a) and weekends (b) during the period July–November 2007.
The contribution of road traffic to the levels of all parameters was estimated for rush hours during weekdays as the increment from mean hourly background levels when traffic intensity was minimum (from 0–4 h UTC) and mean hourly levels during the rush hours, when direct emissions can be measured (from 5–10 h and 18–21 h UTC). Thus, N hourly mean levels increased from 17600 cm− 3 during the background hours to 27500 cm−3 during rush hours and consequently 36% of the N levels measured during rush hours may be attributed to direct traffic emissions. Similarly, BC mean hourly levels increased from 2.8 to 4.2 μ g m− 3, with 33% being attributed to recent traffic emissions. The mean hourly increment of the PM2.5 − 10 fraction when considering traffic rush hours was of 52%. However, the contributions of traffic emissions to PM1 or PM1 − 2.5 have not been estimated, as finer particles are formed by condensation and coagulation processes and direct emissions affect the variability of these fractions to a lower extent. Although this is just a simplified estimation, as background levels are also affected by traffic emissions and these increments may be only attributed to rush hour direct emissions, these estimations show the important impact that traffic emissions have on urban air quality.
Chemical Speciation and Road Traffic Tracers
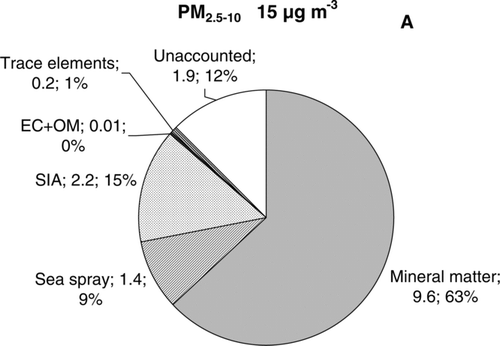
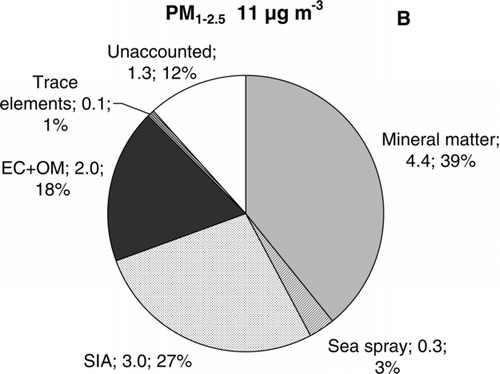
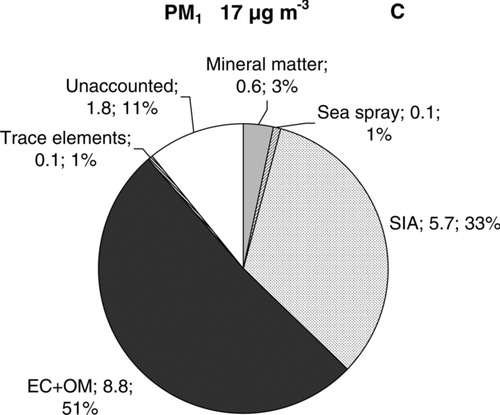
The influence of road traffic emissions on aerosol composition is clearly noticed in the results from PM speciation. shows the main composition of PM2.5 − 10, PM1 − 2.5, and PM1 fractions measured simultaneously at BCN-CSIC site during the year 2007. PM1 is mainly composed of carbonaceous compounds (organic matter + elemental carbon, OM + EC) and secondary inorganic aerosols (SIA), probably reflecting soot emissions and condensation of exhaust gaseous precursors on particle surfaces. PM2.5 − 10 is mainly composed of mineral dust, SIA, and sea spray, reflecting mineral matter emissions from road traffic and other anthropogenic activities, but also long range transport of mineral dust from Northern Africa (CitationEscudero et al. 2005). PM1 − 2.5 results in a mixture of mineral matter, OM + EC and SIA. However, owing to the differentiated sources affecting PM1 and PM2.5 − 10, these parameters become important measurements to carry out in order to monitor combustion sources or exhaust traffic emissions and coarse mineral matter or road dust emissions separately.
FIG. 8 Mean annual levels of the major components (in μ g m−3) measured in PM2.5 − 10 (a), PM1 − 2.5 (b), and PM1 (c) at BCN-CSIC (from 100 daily samples of each PM10, PM2.5, and PM1 fractions measured simultaneously during the year 2007).
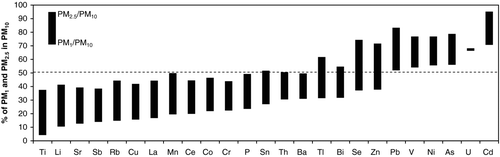
The trace elements analyzed showed a clear partitioning trend between the PM1 − 10 and the PM1 fraction, probably reflecting the origin of some of these elements. shows the ratios PM1/PM10 (bottom of the bar) and PM2.5/PM10 (top of the bar) for the elements analyzed. Elements associated with fossil fuel combustion (V, Ni) or industrial processes (As, Cd, Pb, and U) occur in very fine particles (50 to 70% in the PM1 fraction). Other elements usually associated with mineral matter emitted by road dust, construction and/or demolition, such as Ti, Li, Sr, Rb, La, Ce, and P, or with road traffic abrasion products (mainly from tires and brakes) such as Sb, Cu, Mn, Cr, Co, Sn, Tl, Ba, Bi, Se, and Zn (CitationWåhlin et al. 2006; CitationSchauer et al. 2006) tend to accumulate in the coarse mode (62 to 96% in the fraction PM1 − 10).
FIG. 9 PM2.5/PM10 (%, top of the bar) and PM1/PM10 (%, bottom of the bar) ratios calculated from mean annual levels of trace elements measured at BCN-CSIC (from 100 daily samples of each PM10, PM2.5, and PM1 fractions measured simultaneously during the year 2007).
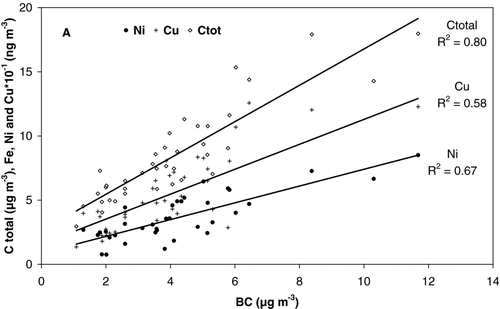
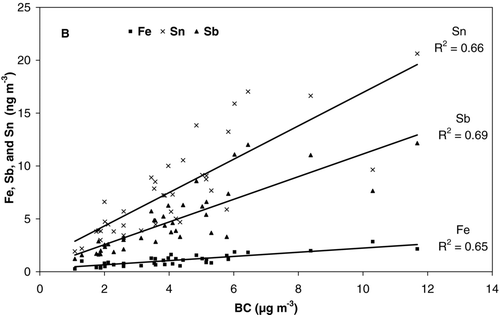
Some tracers associated to traffic emissions analyzed in PM10 showed a good correlation with BC daily levels, such as total carbon, Sn, Cu, Sb, Ni, and Fe (), indicating traffic related sources. Fe is usually associated with dust resuspension, Fe, Sb, Cu, Ni, and Sn can be attributed to vehicle wear (brakes, tires, and other components) and carbonaceous compounds (total C) are associated with direct vehicle exhaust emissions.
FIG. 10 Correlation of mean BC daily levels with the simultaneous total carbon (Ctotal), Ni, and Cu (a) and Fe, Sn, and Sb (b) daily levels measured in PM10 at BCN-CSIC during the period July–November 2007.
Annual Trends
PM levels at urban sites are very influenced by road traffic emissions but also by meteorology. shows the evolution of PM1 − 10, and PM1 levels measured in Barcelona from 1999. PM1 mean annual levels showed an increasing trend from 1999 to 2006, almost parallel to the progressive rise in road traffic flow and to the growth of the diesel fleet. The year 2007 was characterized by a higher rainfall rate and a lower frequency of anticyclonic urban pollution episodes than the rest of the years and thus PM levels registered were lower. The first impression is that PM1 − 10 does not show a clear trend. This is probably because the variation of annual levels of the coarser particles is more marked by meteorology and the frequency and intensity of African dust outbreaks.
FIG. 11 Evolution of mean annual levels of PM1 − 10 and PM1 at BCN urban sites, vehicle fleet in Barcelona city and % diesel in Barcelona province from 1999 to 2007.
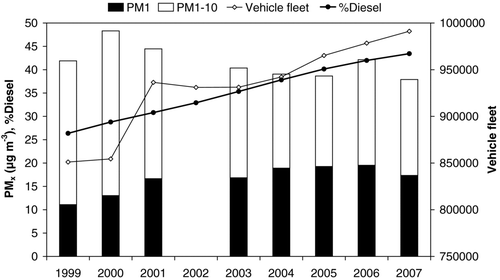
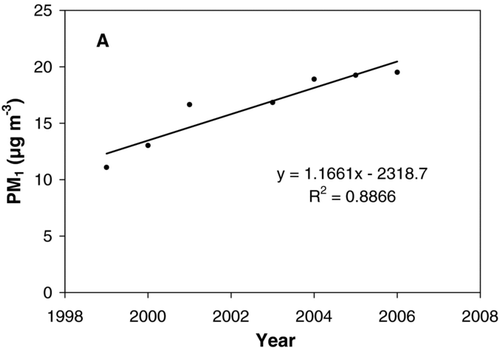
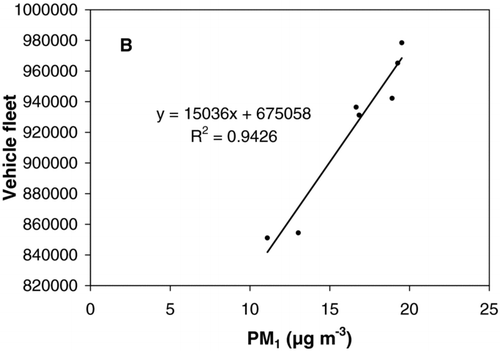
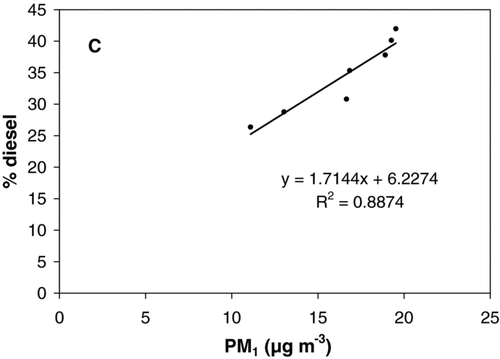
The Mann–Kendall test is applicable to the detection of a monotonic trend of a time series with no seasonal or other cycles (CitationSalmi et al. 2002), and therefore this test was applied to mean annual concentrations of the different PM size fractions. A significant increasing trend was detected for annual mean concentrations of PM1 (increase of 71% from 1999 to 2006) at α = 0.001 significance level. In absolute terms, this increase is equivalent to 8 μ g PM1/m−3 between 2002 and 2006 and this trend may be considered as significant. Conversely, PM1 − 10 presented a decrease of 46% at α = 0.05 significance level from 1999 to 2006 (14 μg PM1−10 m−3), probably related to meteorological factors. In addition, mean annual PM1 levels showed significant correlations (r2 > 0.88 in all cases) and positive slopes with the year of measurement, vehicle fleet and the % of diesel (), indicating the existence of this trend and its relationship with the increase in the vehicle fleet and the proportion of diesel vehicles.
FIG. 12 Correlation between mean annual PM1 levels and year of measurement (a), mean annual vehicle fleet (b) and % diesel in the fleet (c) in Barcelona from 1999 to 2006.
5. CONCLUSIONS
The variability of all aerosol metrics (N, BC, and PMx) at BCN-CSIC urban background site is very influenced by road traffic emissions and meteorology (especially the evolution of breezes).
N, BC, CO, NOx, and SO2 levels are at maximum levels during traffic rush hours, reflecting ultrafine direct exhaust emissions. All parameters decrease with the reduction in traffic emissions and the changes in wind direction and speed. PMx levels are also influenced by traffic. PM2.5 − 10 increases during the day due to non-exhaust emissions from road dust resuspension processes, but also has contributions from other sources (dust resuspension by wind). PM1 − 2.5 and PM1 levels increase during rush hours and then at night, when the decrease of the boundary layer depth favors condensation and coagulation processes, and consequently N levels decrease and levels of the fine PM fractions increase.
N levels show a second peak, registered in the afternoon and parallel to O3 levels and solar radiation intensity, that may be attributed to photochemical nucleation of precursor gases.
The quantification of the increase in ultrafine particles, soot and coarse PM during rush hours shows that 36% of N, 33% of BC, and 52% of PM2.5 − 10 levels may be attributed to direct traffic emissions. The variability of finer PM fractions is less affected by direct traffic emissions. Although this is a simplified estimation it shows the important impact that road traffic emissions have on urban air quality.
PM2.5 − 10 is mainly composed of mineral dust, and to a lesser extent, of secondary aerosols and sea spray, and reflects resuspension emissions from road traffic and wind, as well as other sources. PM1 is mainly composed of OM + EC and SIA (soot and condensation/reaction of exhaust gaseous precursors on particle surfaces), reflecting vehicle exhaust emissions. Some traffic tracers showed a good correlation with BC levels, indicating the same traffic sources.
The influence of road traffic emissions on the levels of fine particulate matter is reflected in PM1 mean annual levels, which show a significant increasing trend, and a good correlation with the progressive rise in road traffic flow and the growth of the diesel fleet in Barcelona from 1999 to 2006. However, the coarser fraction (PM1 − 10) showed a decreasing trend, attributed to meteorology and the frequency and intensity of African dust episodes.
Although road traffic emissions clearly control the variability of atmospheric pollutants in the urban area of Barcelona, the influence of other sources is also evident. That is the case of metallurgical processes on the concentration of some trace elements, fuel oil combustion on V and Ni levels, and sporadically the influence of natural episodes such as African dust episodes on PM10 and mineral matter. Photochemical nucleation processes appear to be important in summer at midday when looking at the variability of number concentration.
The amount of different sources and factors affecting the variability of atmospheric pollutants make the simultaneous measurement of several parameters very interesting. Ultrafine particle measurements (N) is an adequate indicator to monitor the variability of primary traffic emissions and other atmospheric processes such as photochemical nucleation. BC measurements detect the direct exhaust emissions of road traffic (soot) and other combustion processes. In addition, the monitoring of PM levels is necessary to study other important PM sources in the area as dust resuspension or African dust outbreaks. Moreover, speciation measurements of fine and coarse PM fractions provide very important information on PM composition, allowing the evaluation and quantification of PM sources. Thus, a combination of these measurements provides more complete information, in order to better understand atmospheric particulate matter emission sources and transformation or transport processes and to establish emission abatement techniques. The results also show that the monitoring of PM1 and PM10 at an urban background may be a better strategy than the combination of PM2.5 and PM10 measurements. The fraction PM1 − 2.5 presents a lower variability and provides less information than PM1 and PM1 − 10, which discriminate better between particles derived from combustion/exhaust sources and dust resuspension.
The interest of the results obtained in this work encouraged the continuous monitoring of these parameters in the following years, in order to obtain a larger dataset to be able to detect trends and to estimate the impact of the reduction emission plans that were established in Barcelona during the year 2008. Moreover, data presented in this study was partially used in an epidemiological study related to traffic and air pollution (CitationPérez et al. 2009).
Acknowledgments
This study was supported by the Ministry of Science and Innovation (CGL2005-03428- C04-03/CLI, CGL2007-62505/CLI, GRACCIE-CSD2007-00067). The authors would also like to acknowledge NASA/Goddard Space Flight Center, SeaWIFS-NASA Project, University of Athens, Navy Research Laboratory-USA and the Barcelona Super-Computing Centre for their contribution with TOMS maps, satellite images, SKIRON dust maps, NAAPs aerosol maps, and DREAM dust maps, respectively. The authors gratefully acknowledge the NOAA Air Resources Laboratory (ARL) for the provision of the HYSPLIT transport and dispersion model and/or READY website (http://www.arl.noaa.gov/ready.html) used in this publication.
Related Research Data
REFERENCES
- Amato , F. , Pandolfi , M. , Viana , M. , Querol , X. , Alastuey , A. and Moreno , T . 2009a . Spatial and Chemical Patterns of PM10 in Road Dust Deposited in Urban Environment . Atmos. Environ. , 43 : 1650 – 1659 .
- Amato , F. , Pandolfi , M. , Escrig , A. , Querol , X. , Alastuey , A. , Pey , J. , Perez , N. and Hopke , P. K. 2009b . Quantifying Road Dust Resuspension in Urban Environment by Multilinear Engine: A Comparison with PMF2 . Atmos. Environ. , 43 : 2770 – 2780 .
- Brandenbergera , S. , Mohra , M. , Grobb , K. and Neukomb , H. P. 2005 . Contribution of Unburned Lubricating Oil and Diesel Fuel to Particulate Emission from Passenger Cars . Atmos. Environ. , 39 : 6985 – 6994 .
- Casati , R. , Scheer , V. , Vogt , R. and Benter , T. 2007 . Measurement of Nucleation and Soot Mode Particle Emission from a Diesel Passenger Car in Real World and Laboratory In-Situ Dilution . Atmos. Environ. , 41 : 2125 – 2135 .
- Charron , A. and Harrison , R. M. 2003 . Primary Particle Formation from Vehicle Emissions During Exhaust Dilution in the Roadside Atmosphere . Atmos. Environ. , 37 : 4109 – 4119 .
- Draxler , R. R. and Rolph , G. D. 2003 . HYSPLIT (HYbrid Single-Particle Lagrangian Integrated Trajectory) , Silver Spring, MD : NOAA Air Resources Laboratory . http://www.arl.noaa.gov/HYSPLIT.php NOAA ARL READY Website
- Escudero , M. , Castillo , S. , Querol , X. , Avila , A. , Alarcón , M. , Viana , M. M. , Alastuey , A. , Cuevas , E. and Rodríguez , S. 2005 . Wet and Dry African Dust Episodes Over Eastern Spain . J. Geophys. Res. , 110 : 202 – 224 .
- Fraser , M. P. , Buzcu , B. , Yue , Z. W. , McGaughey , G. R. , Desai , N. R. , Allen , D. T. , Seila , R. L. , Lonneman , W. A. and Harley , R. A. 2003 . Separation of Fine Particulate Matter Emitted from Gasoline and Diesel Vehicles Using Chemical Mass Balancing Techniques . Environ. Sci. Technol. , 37 : 3904 – 3909 .
- Hämeri , K. , Kulmala , M. , Aalto , P. , Leszczynski , K. , Visuri , R. and Hämekoski , K. 1996 . The Investigations of Aerosol Particle Formation in Urban Background Area of Helsinki . Atmos. Res. , 41 : 281 – 298 .
- Harrison , R. M. , Shi , J. P. , Xi , S. , Khan , A. , Mark , D. , Kinnersley , R. and Yin , J. 2000 . “ Measurement of Number, Mass and Size Distribution of Particles in the Atmosphere ” . In Philosophical Transactions: Mathematical, Physical and Engineering Sciences , 2567 – 2580 . The Royal Society . Vol. 358, No. 1775, Ultrafine Particles in the Atmosphere
- Jamriska , M. , Morawska , L. and Mergersen , K. 2008 . The Effect of Temperature and Humidity on Size Segregated Traffic Exhaust Particle Emissions . Atmos. Environ. , 42 : 2369 – 2382 .
- Kupiainen , K. 2007 . Road dust from pavement wear and traction sanding Monographs of the Boreal Environment Research, 26. Finnish Environment Institute, Finland. 50 p. Doctoral Dissertation
- Maricq , M. M. 2007 . Chemical Characterization of Particulate Emissions from Diesel Engines: A Review . Aerosol Sci. , 38 : 1079 – 1118 .
- Minoura , H. and Takekawa , H. 2005 . Observation of Number Concentrations of Atmospheric Aerosols and Analysis of Nanoparticle Behavior at an Urban Background Area in Japan . Atmos. Environ. , 39 : 5806 – 5816 .
- Morawska , L. , Thomas , S. , Bofinger , N. , Wainwright , D. and Neale , D. 1998 . Comprehensive Characterization of Aerosols in a Subtropical Urban Atmosphere: Particle Size Distribution and Correlation with Gaseous Pollutants . Atmos. Environ. , 32 : 2467 – 2478 .
- Pérez , L. , Medina-Ramón , M. , Kuenzli , N. , Alastuey , A. , Pey , J. , Pérez , N. , Tobias , A. , Querol , X. and Sunyer , J. 2009 . Size Fractionate Particulate Matter, Vehicular Traffic, and Case-Specific Daily Mortality in Barcelona (Spain) . Environ. Sci. Technol. , 43 : 4707 – 4714 .
- Pey , J. , Rodríguez , S. , Querol , X. , Alastuey , A. , Moreno , T. , Putaud , J. P. and Van Dingenen , R. 2008 . Variations of Urban Aerosols in the Western Mediterranean . Atmos. Environ. , 42 : 9052 – 9062 .
- Pope , C. and Dockery , W. 2006 . Health Effects of Fine Particulate Air Pollution: Lines that Connect . J. Air & Waste Manag. Assoc. , 56 : 709 – 742 .
- Putaud , J. P. , Raes , F. , van Dingenen , R. , Baltensperger , U. , Bruggemann , E. , Facchini , M. C. , Decesari , S. , Fuzzi , S. , Gehrig , R. , Hansson , H. C. , Huglin , Ch. , Laj , P. , Lorbeer , G. , Maenhaut , W. , Mihalopoulos , N. , Muller , K. , Querol , X. , Rodriguez , S. , Schneider , J. , Spindler , G. , ten Brink , H. , Tørseth , K. , Wehner , B. and Wiedensohler , A. 2004 . European Aerosol Phenomenology II: Chemical Characteristics of Particulate Matter at Kerbside, Urban, Rural and Background Sites in Europe . Atmos. Environ. , 38 : 2579 – 2595 .
- Puustinen , A. , Hämeri , K. , Pekkanen , J. , Kulmala , M. , de Hartog , J. , Meliefste , K. , ten Brink , H. , Kos , G. , Katsouyanni , K. , Karakatsani , A. , Kotronarou , A. , Kavouras , I. , Meddings , C. , Thomas , S. , Harrison , R. , Ayres , J. G. , van der Zee , S. and Hoek , G. 2007 . Spatial Variation of Particle Number and Mass Over Four European Cities . Atmos. Environ. , 41 : 6622 – 6636 .
- Querol , X. , Alastuey , A. , Rodríguez , S. , Plana , F. , Ruiz , C. R. , Cots , N. , Massagué , G. and Puig , O. 2001 . PM10 and PM2.5 Source Apportionment in the Barcelona Metropolitan Area, Catalonia, Spain . Atmos. Environ. , 35/36 : 6407 – 6419 .
- Querol , X. , Alastuey , A. , Ruiz , C. R. , Artiñano , B. , Hanssonc , H. C. , Harrison , R. M. , Buringh , E. , ten Brink , H. M. , Lutz , M. , Bruckmannh , P. , Straehl , P. and Schneider , J. 2004 . Speciation and Origin of PM10 and PM2.5 in Selected European Cities . Atmos. Environ. , 38 : 6547 – 6555 .
- Robinson , A. L. , Donahue , N. M. , Shrivastava , M. K. , Weitkamp , E. A. , Sag , A. M. , Grieshop , A. P. , Lane , T. E. , Pierce , J. R. and Pandis , S. N. 2007 . Rethinking Organic Aerosols: Semivolatile Emissions and Photochemical Aging . Science , 315 : 1259 – 1262 .
- Rodríguez , S. and Cuevas , E. 2007 . The Contributions of “Minimum Primary Emissions” and “New Particle Formation Enhancements” to the Particle Number Concentration in Urban Air . Aerosol Sci. , 38 : 1207 – 1219 .
- Rodríguez , S. , Cuevas , E. , González , Y. , Ramos , R. , Romero , P. M. , Pérez , N. , Querol , X. and Alastuey , A. 2008 . Influence of Sea Breeze Circulation and Road Traffic Emissions on the Relationship Between Particle Number, Black Carbon, PM1, PM2.5 and PM2.5–10 Concentrations in a Coastal City . Atmos. Environ. , 42 : 6523 – 6534 .
- Salmi , T. , Määttä , A. , Anttila , P. , Ruoho-Airola , T. and Amnell , T. 2002 . “ Detecting Trends of Annual Values of Atmospheric Pollutants by the Mann–Kendall Test and Sen's Slope Estimates—The Excel Template Application MAKESENS ” . In Publications on Air Quality , 35 Helsinki, Finland : Finnish Meteorological Institute . No. 31, Finnish Meteorological Institute, ed.
- Schauer , J. J. , Lough , G. C. , Shafer , M. M. , Christensen , W. F. , Arndt , M. F. , DeMinter , J. T. and Park , J. S. 2006 . Characterization of Metals Emitted from Motor Vehicles Health Effects Institute Research report No. 133
- Van Dingenen , R. , Raes , F. , Putaud , J.-P. , Baltensperger , U. , Charron , A. , Facchini , M.-C. , Decesari , S. , Fuzzi , S. , Gehrig , R. , Hansson , H.-C. , Harrison , R. M. , Hüglin , C. , Jones , A. M. , Laj , P. , Lorbeer , G. , Maenhaut , W. , Palmgren , F. , Querol , X. , Rodriguez , S. , Schneider , J. , ten Brink , H. , Tunved , P. , Tørseth , K. , Wehner , B. , Weingartner , E. , Wiedensohler , A. and Wåhlin , P. 2004 . A European Aerosol Phenomenology—1: Physical Characteristics of Particulate Matter at Kerbside, Urban, Rural and Background Sites in Europe . Atmos. Environ. , 38 : 2561 – 2577 .
- Wåhlin , P. , Berkowicz , R. and Palmgren , F. 2006 . Characterisation of Traffic-Generated Particulate Matter in Copenhagen . Atmos. Environ. , 40 : 2151 – 2159 .
- Zhang , K. M. and Wexler , A. S. 2004 . Evolution of Particle Number Distribution Near Roadways. Part I: Analysis of Aerosol Dynamics and its Implications for Engine Emission Measurement . Atmos. Environ. , 38 : 6643 – 6653 .
- Zhang , K. M. , Wexler , A. S. , Zhu , Y. F. , Hinds , W. C. and Sioutas , C. 2004 . Evolution of Particle Number Distribution Near Roadways. Part II: The “Road-to-Ambient” Process . Atmos. Environ. , 38 : 6655 – 6665 .