Abstract
Size distributions for As, Cd, Bi, Br, Fe, Mn, S, Sb, Tl, K, V, Rb, elemental carbon (EC), organic carbon (OC), sulfate (SO 2− 4 ), chloride (Cl−), and nitrate (NO− 3 ) were measured at Bakersfield and Modesto CA between 12/15/2000–01/07/2001. S and V size distributions were highly correlated with little diurnal variation suggesting that, during stagnant winter conditions, inhalation exposure and epidemiological studies can choose exposure/analysis times of several days during which population exposure will be relatively uniform. In contrast, the size distribution and temporal patterns of Fe are highly variable requiring more frequent measurements and shorter health analysis periods to adequately characterize exposure concentrations. K and Rb (tracers for wood smoke) exhibited nearly identical diurnal size distribution shifts (R 2 > 0.99) with smaller particles emitted at night and larger aged particles evident during the day. This pattern suggests that the health effects of fresh wood smoke could be studied through nighttime inhalation exposure experiments and aged wood smoke could be evaluated through daytime experiments. All of the components’ size distributions were consistent with production by combustion sources and/or secondary chemistry. Future inhalation exposure studies should use a combustion source to generate these particles. Lung deposition calculations predict that 32 ± 11% of PM deposition occurs in the pulmonary region, 61 ± 23% occurs in the respiratory region, and 6 ± 2% occurs in the tracheo-bronchial region for all components. Deposition patterns were highly correlated with PM 1.8 concentrations suggesting that exposure estimates can be developed with bulk filter samples during the current episode.
INTRODUCTION
Epidemiological studies have identified exposure to airborne particulate matter with diameters smaller than 2.5 μm (PM 2.5) as a public health risk (CitationLaden et al. 2000; CitationOstro et al. 2006). The mechanisms of injury associated with airborne particles are still poorly understood but several leading hypotheses focus on the size distribution of airborne particles and/or their chemical composition. For example, the CALFINE epidemiological study examined the association between PM2.5 concentrations and increased rates of morbidity and mortality in several California counties (CitationOstro et al. 2006). Each 10 μg m–3 increase in ambient PM2.5 concentrations in the CALFINE study was associated with a 0.06% increase in all-cause mortality. These results were consistent with CitationSchwartz et al. (1996) finding in their reanalysis of the Six Cities study. In the cooler months, a number of major PM species (OC, EC, NO– 3, SO2– 4) and trace PM species (Fe, K, S, V) were more strongly correlated than PM2.5 mass with excess all-cause mortality (CitationOstro et al. 2007) suggesting that some PM2.5 components may have disproportionately large health effects during the winter months.
Airborne particle size is relevant to health considerations because aerodynamic diameters determine where each particle is likely to deposit in the human respiratory system (CitationRaabe et al. 1986). A particle with a diameter of 2.5 μm has a deposition efficiency of 19% in the pulmonary region of the human lung while a particle with a diameter of 0.5 μm will have a pulmonary deposition efficiency of only 7%. Despite the critical role of particle size and composition, many epidemiological and toxicology studies are carried out with very limited size-resolved characterization.
The California Regional Particulate Air Quality Study (CRPAQS) was designed to characterize the concentrations and sources of PM10/PM2.5 in central California during the winter months when concentrations are highest (CitationChow et al. 2006). The findings from CRPAQS have identified trends for PM2.5 concentrations (CitationChow et al. 2006), the impact of biomass emissions on PM2.5 concentrations (CitationQin and Prather 2006; CitationChen et al. 2007; CitationChow et al. 2007), processes affecting secondary aerosol formation (CitationHerner et al. 2006), processes affecting the size distribution of airborne particles (CitationHerner et al. 2006; CitationHering et al. 2007), and regional contributions to airborne particle concentrations (CitationYing et al. 2008). A few studies have examined the size distributions of the major PM species during CRPAQS (CitationHerner et al. 2006; CitationChow et al. 2008) but very little information has been reported to date on the size distribution of health-relevant trace elements contained in PM size fractions smaller than 2.5 μm.
The current study reports the size distribution of major and trace species contained in airborne particulate matter in central California during the severe winter stagnation conditions that existed during CRPAQS with a particular focus on health-relevance. Twelve trace elements that passed quality control checks (As, Cd, Bi, Br, Fe, Mn, S, Sb, Tl, K, V, Rb), elemental carbon (EC), organic carbon (OC), sulfate (SO4), chloride (Cl), and nitrate (NO3) were selected as the focus for the current study because of their potential to directly cause human health effects, their potential to act as tracers for important sources, or their direct contribution to primary particle mass (CitationChow et al. 2006). summarizes some of the known adverse health effects and sources of the components analyzed in this study to further aid in the link to the health studies. Additional elements such as nickel (Ni) and copper (Cu) are also known to cause adverse health effects but did not pass strict measurement quality control criteria and so they will not be discussed in the present study. Insights gained from this analysis will be relevant for ongoing health effects studies in central California including CALFINE.
TABLE 1 Potential health effects and sources of particulate matter components measured during CRPAQS
METHODS
Detailed information regarding airborne particle sample collection, analytical methods, and quality control measures employed during CRPAQS have been reported previously (CitationHerner et al. 2005) and so only a brief summary is presented here. Airborne particulate matter samples were collected at multiple sites throughout central California during two atmospheric stagnation events during the winter of 2000–2001. Size-resolved airborne particulate matter samples were collected during four Intensive Operating Periods (IOP's) over a total of 15 days between December 2000 and February 2001. IOP1 took place during December 15–18, IOP2 during December 26–28, IOP3 during January 4–7, and IOP4 during January 31–February 3 (CitationHerner et al. 2006). Daytime samples (10–18 PST) and nighttime samples (20–8 PST) were collected separately to characterize the diurnal changes to particle size and composition. This study focuses on the results obtained for Modesto (pop. ∼200,000) in the northern portion of California's San Joaquin Valley (SJV) and Bakersfield (pop. ∼300,000) in the southern portion of the SJV. These sampling sites were selected for analysis because they produced the most extensive size-resolved speciation data set created during CRPAQS. The distance between Modesto and Bakersfield is approximately 320 km. Previous studies have shown that the PM at Modesto and Bakersfield is generally associated with sources that are located in sub-regions of the SJV around the monitoring sites during this period (CitationYing and Kleeman 2009). Some minor intra-regional transport events did occur but they generally did not transport PM between the two sampling sites.
PM samples were collected with Micro-Orifice Uniform Deposit Impactors (MOUDI Model 110, MSP Corp.) and filter-based samplers (RAAS2.5-400 Andersen Instruments). Both the MOUDI and RAAS samplers employed an upstream Air and Industrial Hygiene Laboratory (AIHL)-cyclone separator (CitationJohn and Reischl 1980) to remove particles with aerodynamic diameter larger than 1.8 μm. MOUDI samples were divided into 6 size fractions smaller than 1.8 μm with 50% aerodynamic collection diameters of 0.056, 0.1, 0.18, 0.32, 0.56, and 1.0 μm. Samples designated for ICP-MS analysis of trace elements were collected on Teflon (R2PJ047, Pall Corp.) filters, while samples designated for carbonaceous analysis were collected on aluminum foil substrates and quartz fiber filters that had been pre-baked at 550°C for 48 h to reduce background carbon levels.
PM mass measurements were obtained for Teflon filters and aluminum foil substrates using a Cahn-33 microbalance. Quartz filters and aluminum foil substrate were analyzed for OC and EC using a thermal optical transmittance method (Sunset Laboratory EC/OC Analyzer) following NIOSH 5040 temperature protocol. Half of each Teflon filter was extracted in a mixture of 75% acetone (Fisher Optima grade) and 25% 1N nitric acid (Fisher Trace Metal Grade diluted with MilliQ ultra-pure water) and analyzed for trace elements with Inductively Coupled Plasma Mass Spectrometry (ICP-MS) (Agilent 7500i) (CitationHerner et al. 2006). A recent comparison of this analysis procedure vs. traditional ICP-MS analysis methods and XRF analysis for trace elements yielded accurate measurements for trace-element size distributions contained in airborne particles (CitationHerner et al. 2006).
RESULTS
Time Trends for PM1.8 and PM0.1 Trace Concentrations
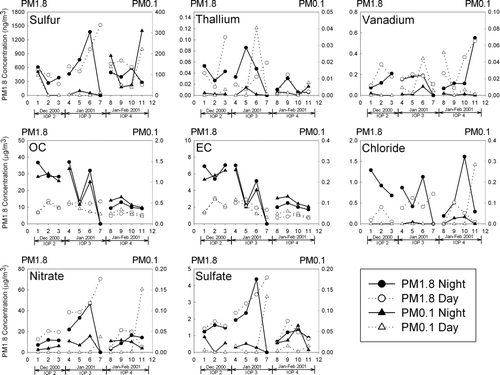
shows the PM1.8 and PM0.1 component concentrations measured at Modesto between December 2000 and February 2001. Sulfur (S) was the most abundant trace element found in the PM1.8 size fraction at Modesto with an average daily concentration of 600 ng m–3 during the study period. Particulate sulfur also experienced the greatest increase in average ambient concentration in both PM1.8 and PM0.1. Daily PM1.8 sulfur concentrations increased nearly 5 fold from 316 to 1520 ng m–3 during the study. A comparison to Ion Chromatography measurements indicates that sulfur exists almost exclusively as sulfate produced by the oxidation of gas-phase SO2 over time. SO2 emissions are generally low in California but several sources are present in the SJV that combust fuel with high sulfur content (CitationYing et al. 2009).
FIG. 1 Time history of PM1.8 and PM0.1 concentrations at Modesto during the study period. (Continued)
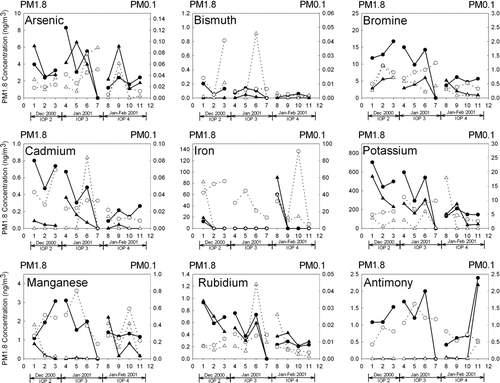
Potassium (K) was the second most abundant PM trace element found in airborne particulate matter during the study period, with daily average concentrations of 224 ng m–3. Daytime K concentrations at Modesto increased at a more gradual rate than S, rising from 205 to 295 ng m–3 during the study. Potassium is abundant in primary wood smoke particles (CitationKleeman et al. 1999) and wood smoke is known to be a dominant source of PM during winter stagnation events in the SJV (CitationQin and Prather 2006; CitationChen et al. 2007; CitationChow et al. 2007; CitationYing et al. 2008). The buildup of daytime K concentrations during the current study reflects the accumulation of wood smoke trapped below the upper atmospheric inversion layer.
Iron (Fe) was the third most abundant trace element at Modesto during the study period with an average daily PM1.8 concentration of 63 ng m–3. Daytime PM1.8 Fe concentrations decreased from 83 ng m–3 to 19 ng m–3 during IOP2 and IOP3, whereas nighttime concentrations remained constant. PM0.1 concentrations displayed similar trends to PM1.8.
Daytime concentrations measured when atmospheric mixing depths are <700 m reflect the steady buildup of pollution over the extended 3 week stagnation event while nighttime measurements made during low-level (30–50 m) nocturnal inversions reflect the influence of fresh emissions from sources close to the sampling location (CitationHeld et al. 2004). In most cases, PM1.8 and PM0.1 concentrations exhibit similar time trends, with PM0.1 experiencing somewhat larger oscillations about the mean value relative to PM1.8. Seven trace elements (As, Br, Cd, K, Rb, Sb, Tl) measured in PM1.8 and PM0.1 size fractions at Modesto during IOP2 and IOP3 had strong diurnal variations with nighttime concentrations greater than daytime concentrations in almost all samples. This diurnal pattern matches PM0.1 OC and EC trends, suggesting that these elements are emitted directly from sources in the particle phase (CitationHerner et al. 2006). Conversely, Bi, Fe, S, and V did not show significant diurnal variations, suggesting that the sources of these elements were not located close to Modesto and/or that these elements are transferred to the particle phase during atmospheric chemical reactions (CitationHerner et al. 2006).
In addition to the diurnal patterns discussed above, also illustrates longer time trends. IOP2 and IOP3 took place within a single large-scale stagnation event that spanned more than 3 weeks. Daytime concentration trends across IOP2 and IOP3 reflect the balance between production and loss mechanisms for trace elements in airborne particles trapped below the upper inversion layer. illustrates that As, Br, K, Rb, Sb, S, and V increase in daytime concentration in the PM1.8 size fraction during IOP2 and IOP3 at Modesto. These elements in the PM1.8 size fraction are more likely to be associated with aged particles that may be more oxidized than fresh emissions. Daytime concentrations of OC and EC also increase during IOP2 and IOP3, reflecting the buildup of primary emissions during the large scale stagnation event (CitationHerner et al. 2006).
shows the PM1.8 and PM0.1 component concentrations measured at Bakersfield using the same format as . Sulfur (average daily concentration = 1.0 μg m–3) was once again the most abundant trace element measured at Bakersfield followed by Fe (average daily concentration = 2.9 ng m–3), and K (average daily concentration = 2.0 μg m–3).
FIG. 2 Time history of PM1.8 and PM0.1 concentrations at Bakersfield during the study period. (Continued)
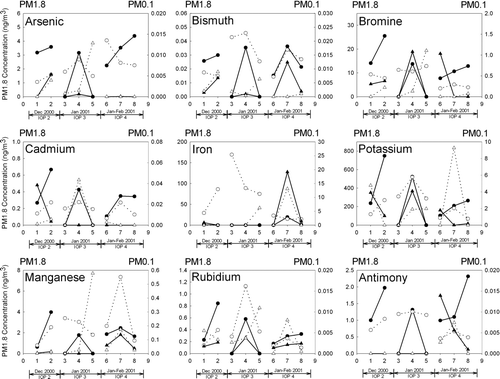
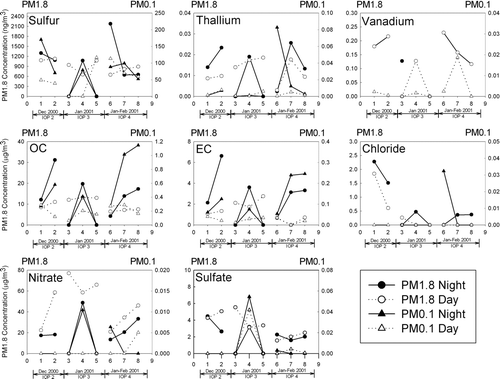
There are several common trends in trace element concentrations measured at Modesto and Bakersfield. As, Br, Cd, K, Rb, Sb, and Tl all have higher nighttime concentrations than daytime concentrations in the PM1.8 size fraction. As, Bi, Br, Fe, K, Rb, Sb, and Tl measured in the PM1.8 size fraction at Bakersfield demonstrated an increase in daytime concentrations during IOP2 and IOP3. These trends result from the same processes that were active at Modesto.
A comparison between and reveals some notable differences between trends at Bakersfield and Modesto. Nighttime concentrations of PM1.8 S were slightly greater than daytime concentrations at Bakersfield, suggesting that some nighttime production mechanism or primary source of particulate S dominates concentrations in the southern SJV. Daytime PM1.8 concentrations of S and V at Bakersfield decreased during IOP2 and IOP3, possibly because deposition processes for these elements outweighed emissions and secondary production mechanisms. PM0.1 trace element concentrations are not well correlated with PM1.8 concentrations at Bakersfield, possibly because the high concentrations of accumulation mode particles scavenge smaller particles through coagulation (CitationHerner et al. 2006). This lack of correlation between the fine and ultrafine size fractions calls into question epidemiological results based exclusively on fine particle measurements. Br, K, Rb, and S were the only elements with enhanced nighttime PM0.1 concentrations relative to daytime concentrations.
Trace Element Size Distributions
and show the average daytime and nighttime particle size distributions of particulate OC, EC, NO– 3, SO2– 4, Cl–, and twelve health relevant trace elements found at Modesto and Bakersfield, respectively. The carbonaceous aerosol size distribution peaks in the 0.32–0.56 μm range during both the daytime and nighttime sampling periods. The nighttime measurements exhibit slightly increased concentrations in the 0.18–0.32 μm range because direct emissions from combustion sources peak in this size range (CitationKleeman et al. 1999, Citation2000; CitationRobert et al. 2007; CitationRobert et al. 2007; CitationKleeman et al. 2008) and fresh emissions dominate during the evening hours when a low-level stagnation layer forms due to radiative cooling of the earth's surface.
FIG. 3 Average nighttime (shaded bars) and daytime (dashed line) trace component size distributions at Modesto. (Continued)
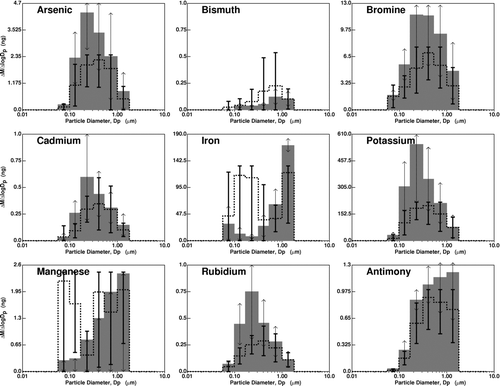
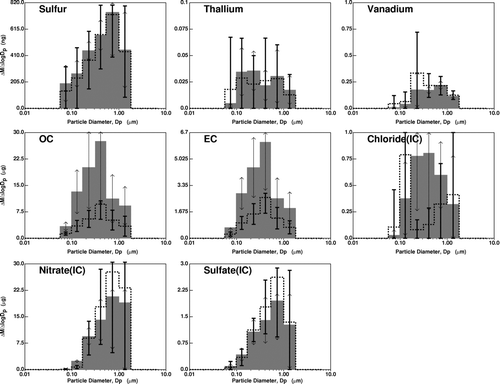
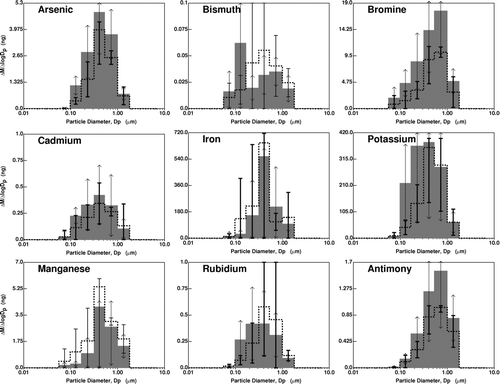
FIG. 4 Average nighttime (shaded bars) and daytime (dashed lines) trace component size distributions at Bakersfield. (Continued)
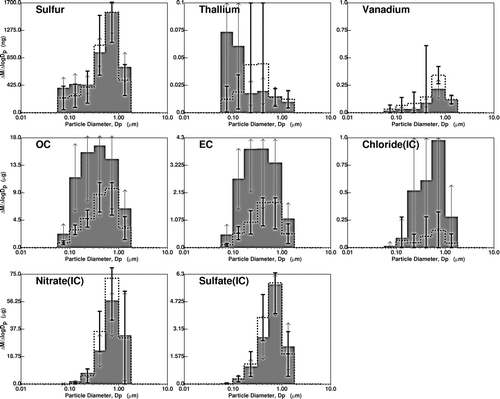
Sulfur (S) size distributions generally exhibited a peak between 0.56 and 1.0 μm for day and night measurements with little change during the sampling campaign. This accumulation mode reflects the formation of sulfate in the aqueous phase. The geometric standard deviation of the sulfate size distribution is slightly larger at Modesto than at Bakersfield, possibly reflecting the enhanced formation rates at Modesto versus the approximately constant concentrations at Bakersfield (see and ). Vanadium (V) is the only other particle-phase element that consistently peaks in this size fraction at both sampling sites. Vanadium is commonly associated with heavy fuel oil combustion during source apportionment studies. These same sources would be expected to release sulfur that would eventually be oxidized to form particulate sulfate.
The measured size distribution of iron (Fe) is highly variable at Modesto and Bakersfield as demonstrated by the large uncertainty bars in and . When averaged across all sampling periods, the daytime and nighttime Fe size distributions at Bakersfield have a single mode between 0.32 and 0.56 μm particle diameter. The daytime and nighttime Fe size distributions at Modesto are bimodal with the smaller mode between 0.1 and 0.32 μm (daytime) or <0.1 μm (nighttime) particle diameter and the larger mode >1.0 μm particle diameter (daytime and nighttime). The bimodal nature of the Fe size distribution indicates that PM containing Fe are derived from both crustal and combustion sources. This has strong implications for inhalation exposure studies as its size distribution affects its respiratory deposition pattern which may, in turn, affect the types of health effects induced.
The shape of the particulate K and Rb size distributions are similar at Bakersfield and Modesto during all time periods. K and Rb exhibit a distinct diurnal pattern with nighttime peaks occurring between 0.18 and 0.32 μm particle diameter and daytime peaks that occur between 0.32 and 0.56 μm particle diameter. This size distribution shift follows the same trend as carbonaceous particles at Bakersfield and Modesto. The similarity between the size distribution shape and temporal pattern for K and Rb suggests that these elements originate from the same source—likely wood smoke (CitationKleeman et al. 1999; CitationQin and Prather 2006; CitationYing et al. 2008).
Particulate size distributions of As/Br/Cd (Modesto) and Bi/Tl (Bakersfield) exhibited diurnal patterns similar to K and Rb with nighttime peaks occurring in size fractions smaller than 0.32 μm particle diameter and daytime peaks occurring in larger size fractions. The diurnal pattern for these elements once again reflects the presence of emission sources close to the sampling location that dominate concentrations during the night. The fact that this diurnal trend is not observed at every location for every element reflects the fact that the corresponding emissions sources are not in the nighttime zone of influence for each site. Inhalation exposure studies should recognize these zones of influence during the meteorological conditions when exposure occurs.
Sb at Modesto was the only element detected in the current study that displayed a diurnal pattern where the average nighttime particle size distribution peaked at larger diameters (1.0–1.8 μm) than the average daytime particle size distribution (0.32–0.56 μm). The reason for this trend is unknown, but one possible explanation is that the dominant sources of antimony during the daytime and nighttime are different.
Correlation Coefficient Analysis
and tabulate the correlation coefficients for each combination of PM size distributions illustrated in and . Each correlation value reflects the similarity between the shapes of two size distributions across 6 size bins. Perfect agreement yields R2= 1.0 while no agreement yields R2= 0.0.
TABLE 2 Correlation coefficients (R2) for particulate matter component size distributions measured at Modesto during the day (above the diagonal) and at night (below the diagonal)
TABLE 3 Correlation coefficients (R2) for particulate matter component size distributions measured at Bakersfield. during the day (above the diagonal) and at night (below the diagonal)
illustrates that K and Rb are strongly correlated at Modesto (R2> 0.99) suggesting that these elements exist in the same particles (likely wood smoke). As, Cd, and Br size distributions were also highly correlated with K and Rb. All five of these species exhibited similar diurnal time trends (see ) supporting the conclusion that they exist within the same group of PM. OC and EC size distributions correlated reasonably well with K and Rb (R2∼0.98 day and ∼0.96 night) suggesting that wood smoke is a major but not exclusive source of OC and EC at Bakersfield. Daytime S size distributions correlate strongly with Bi and nighttime S distributions correlate with V. All three of these species have been associated with the smelting of alloys and heavy fuel combustion used by industrial sources and shipping. Ying et al. demonstrated that there was no significant transport of off-shore ship emissions into the SJV during the study period (CitationYing and Kleeman 2009). Therefore, the correlation between S, Bi, and V may demonstrate the influence of industrial sources on PM size and composition in Modesto. Bi, S, and V did not exhibit diurnal variation as shown in supporting the notion that these species were not directly emitted in Modesto but rather were transported to Modesto after some aging time in the atmosphere.
Size distribution correlations at Bakersfield exhibit similar trends relative to those at Modesto. A “wood smoke grouping” appears in the daytime and nighttime correlations, with As, Cd, Br, K, and Rb all inter-correlated (R2> 0.95). illustrates that these species also exhibit similar diurnal patterns further suggesting that they originate from the same source. OC and EC once again appear to be highly (but not exclusively) correlated with these wood smoke tracers. Size distributions of S exhibit a stronger correlation to V in Bakersfield than in Modesto, which may indicate that Bakersfield has a stronger industrial source utilizing heavy fuel oil.
Deposition Patterns
The deposition pattern for the airborne particle trace elements measured in the current study within different portions of the human respiratory system was estimated using the size distributions illustrated in and along with deposition curves calculated by the Multiple Path Particle Dosimetry model (MPPD2) (MPPD). This model estimates the regional lung deposition patterns of a polydisperse aerosol over several orders of aerodynamic diameters and contains calculations derived from multiple published sources (CitationKuempel et al. 2006). The model assumes a breathing rate of 12 breaths/minute and a tidal volume of 625 mL. MOUDI size distribution data were combined with the MPPD model results to obtain size resolved chemical deposition fractions and summed to give integrated chemical deposition fractions. These MOUDI-derived integrated chemical deposition fractions were compared to bulk PM1.8 filter measurements to determine if size-resolved chemical speciation data were necessary to estimate regional lung deposition patterns. The analysis indicates that all trace elements have very similar respiratory deposition patterns. Averaged across all PM species, sites, and times, 32 ± 11% of the PM1.8 component mass deposition occurs in the pulmonary region, 61 ± 23% occurs in the respiratory region, and 6 ± 2% occurs in the tracheo-bronchial region. The consistency of these results suggest that if different PM1.8 chemical components illicit specific health effects, it is likely due to the direct influence of the chemical species, rather than substantially different deposition patterns in the respiratory system.
The deposition totals in each region of the lung calculated for different sampling locations and time periods were correlated against the corresponding PM1.8 filter measurements. As expected, the slope of the regression line was different for each chemical component in each region of the respiratory system. More importantly for epidemiological studies, the correlation between lung deposition vs. PM1.8 measurements was very high (R2>0.99) for each component. This finding suggests that the information provided by bulk PM1.8 filter measurements would be adequate to represent exposure for epidemiological calculations within the short three-week episode considered in the present study. Most epidemiological studies are carried out over far longer time periods, and so further measurements are needed to confirm that trace component concentrations measured on PM1.8 filters are highly correlated with deposition patterns in each region of the respiratory system over longer time periods.
DISCUSSION
The patterns apparent in the measured trace component PM size distributions have several implications for the design of toxicological and epidemiological studies related to airborne particulate matter in central California.
S and V size distributions are highly correlated with little diurnal variation suggesting that inhalation exposure and epidemiological studies can choose exposure/analysis times of several days during which population exposure will be relatively uniform when stagnant winter conditions exist. In contrast, the size distribution and temporal patterns of Fe are highly variable at both Modesto and Bakersfield possibly due to changing meteorological conditions such as wind speed and soil disturbance. This suggests that Fe must be measured with higher time resolution in order to provide accurate exposure estimates during health effects studies. This is especially important for the PM0.1 size fraction because particles in the ultrafine range are more likely to induce oxidative stress than fine or coarse particles (CitationLi et al. 2003). Inhalation exposure and epidemiological experiments must account for the possibility that average concentrations over consecutive multi-day periods may be similar but short term concentration peaks can occur during exposure/analysis periods which may lead to different health outcomes.
K and Rb exhibit a distinct diurnal pattern with greater concentrations and smaller sizes at night which is a trend consistent with fresh wood smoke emissions during the evening hours. This general pattern applies for all combustion sources during stagnant winter conditions in central California. Inhalation exposure or epidemiological studies using nighttime exposure/analysis periods will therefore be able to consider the health effects of fresh combustion aerosol while studies carried out during daytime hours will be able to consider the health effects of aged combustion aerosol. The different chemical composition of these particles could yield different health effects which is a feature that could be explored in future studies.
Many other elements have concentration patterns that reflect changing zones of influence as meteorological conditions vary at each sampling location. Periodic emissions from local smelter operations may play a role in trace metal concentrations as evidenced by the variable emissions of As, Bi, Cd, Mn, and Tl. All of these metals are common alloy constituents and cause adverse health effects when inhaled. Modesto is home to a large aluminum secondary smelter (∼5 miles away from the sample site) as well as tire and waste incinerators (<10 miles away). Bakersfield is home to a ferrous metal salvage and smelting facility (∼6 miles away from the sampling site). Diurnal particle size distributions and representative time traces must be measured to characterize exposure to the elements released from these facilities.
All of the trace elements examined in the current study occur naturally in the earth's crust leading to background dust size distributions that should increase with airborne particle aerodynamic diameter (mechanical abrasion processes typically produce larger particles). Anthropogenic combustion sources enhance trace element concentrations in the size range below 1 μm that will penetrate more deeply into the human respiratory system. The dominance of size distributions that peak below 1 μm in the current study strongly suggests that the majority of the PM trace elements originate from anthropogenic sources during severe winter stagnation events. Inhalation toxicology experiments that employ the trace elements identified in the current study should generate the particles with an appropriate flame combustion system.
This research was funded by the San Joaquin Valleywide Air Pollution Study Agency under grant # 2000-05PM and the United States Environmental Protection Agency under contract R832414-010. We thank Professor Tom Young for ICP-MS availability.
REFERENCES
- Beton , D. C. , Andrews , G. S. , Davies , H. J. , Howells , L. and Smith , G. F. 1966 . Acute Cadmium Fume Poisoning—5 Cases with One Death from Renal Necrosis . Brit. J. Indust. Med. , 23 ( 4 ) : 292
- Bingham , E. , Cohrssen , B. and Powell , C. H. 2001 . Patty's Toxicology , New York : John Wiley .
- Brewer , P. 1997 . Vehicles as a Source of Heavy Metal Contamination in the Environment (Unpublished) , Berkshire, , UK : University of Reading . MSc
- Chen , L. W. A. , Watson , J. G. , Chow , J. C. and Magliano , K. L. 2007 . Quantifying PM2.5 Source Contributions for the San Joaquin Valley with Multivariate Receptor Models . Environ. Sci. Technol. , 41 ( 8 ) : 2818 – 2826 .
- Chow , J. C. , Chen , L. W. A. , Watson , J. G. , Lowenthal , D. H. , Magliano , K. A. , Turkiewicz , K. and Lehrman , D. E. 2006 . PM2.5 Chemical Composition and Spatiotemporal Variability During the California Regional PM10/PM2.5 Air Quality Study (CRPAQS) . J. Geophys. Res.—Atmospheres , 111 ( D10 )
- Chow , J. C. , Watson , J. G. , Lowenthal , D. H. , Chen , L. W. A. , Zielinska , B. , Mazzoleni , L. R. and Magliano , K. L. 2007 . Evaluation of Organic Markers for Chemical Mass Balance Source Apportionment at the Fresno Supersite . Environ. Sci. Technol. , 7 ( 7 ) : 1741 – 1754 .
- Chow , J. C. , Watson , J. G. , Lowenthal , D. H. and Magliano , K. A. 2008 . Size-Resolved Aerosol Chemical Concentrations at Rural and Urban Sites in Central California, USA . Atmos. Res. , 90 : 243 – 252 .
- Clement Associates, United States. Agency for Toxic Substances and Disease Registry . 1992 . Toxicological Profile for Vanadium and Compounds , Atlanta, GA : Agency for Toxic Substances and Disease Registry U.S. Public Health Service .
- Held , T. , Ying , Q. , Kaduwela , A. and Kleeman , M. 2004 . Modeling Particulate Matter in the San Joaquin Valley with a Source-Oriented Externally Mixed Three-Dimensional Photochemical Grid Model . Atmos. Environ. , 38 ( 22 ) : 3689 – 3711 .
- Hering , S. V. , Kreisberg , N. M. , Stolzenburg , M. R. and Lewis , G. S. 2007 . Comparison of Particle Size Distributions at Urban and Agricultural Sites in California's San Joaquin Valley . Aerosol Sci. Technol. , 41 ( 1 ) : 86 – 96 .
- Herner , J. D. , Aw , J. , Gao , O. , Chang , D. P. and Kleeman , M. J. 2005 . Size and composition Distribution of Airborne Particulate Matter in Northern California:I—Particulate Mass, Carbon, and Water–Soluble Ions . J. Air & Waste Manage. Assoc. , 55 ( 1 ) : 30 – 51 .
- Herner , J. D. , Green , P. G. and Kleeman , M. J. 2006 . Measuring the Trace Elemental Composition of Size-Resolved Airborne Particles . Environ. Sci. Technol. , 40 ( 6 ) : 1925 – 1933 .
- Herner , J. D. , Ying , Q. , Aw , J. , Gao , O. , Chang , D. P. Y. and Kleemani , M. J. 2006 . Dominant Mechanisms that Shape the Airborne Particle Size and Composition Distribution in Central California . Aerosol Sci. Technol. , 40 ( 10 ) : 827 – 844 .
- International Labour Office, Parmeggiani L. 1971 . Encyclopaedia of Occupational Health and Safety , Geneva : International Labour Office .
- John , W. and Reischl , G. 1980 . A Cyclone for Size-Selective Sampling of Ambient Air . J. Air Poll. Control Assoc. , 30 ( 8 ) : 872 – 876 .
- Kiviluoto , M. 1980 . Observations on the Lungs of Vanadium Workers . British J. Indust. Med. , 37 ( 4 ) : 363 – 366 .
- Kiviluoto , M. , Rasanen , O. , Rinne , A. and Rissanen , M. 1979 . Effects of Vanadium on the Upper Respiratory-Tract of Workers in a Vanadium Factory—Macroscopic and Microscopic Study . Scand. J. Work Environ. Health , 5 ( 1 ) : 50 – 58 .
- Kleeman , M. J. , Robert , M. A. , Riddle , S. G. , Fine , P. M. , Hays , M. D. , Schauer , J. J. and Hannigan , M. P. 2008 . Size Distribution of Trace Organic Species Emitted from Biomass Combustion and Meat Charbroiling . Atmos. Environ. , 42 ( 13 ) : 3059 – 3075 .
- Kleeman , M. J. , Schauer , J. J. and Cass , G. R. 1999 . Size and Composition Distribution of fine Particulate Matter Emitted from Wood Burning, Meat Charbroiling, and Cigarettes . Environ. Sci. Technol. , 33 ( 20 ) : 3516 – 3523 .
- Kleeman , M. J. , Schauer , J. J. and Cass , G. R. 2000 . Size and Composition Distribution of fine Particulate Matter Emitted from Motor Vehicles . Environ. Sci. Technol. , 34 ( 7 ) : 1132 – 1142 .
- Knecht , E. A. , Moorman , W. J. , Clark , J. C. , Lynch , D. W. and Lewis , T. R. 1985 . Pulmonary Effects of Acute Vanadium Pentoxide Inhalation in Monkeys . Amer. Rev. Respir. Dis. , 132 ( 6 ) : 1181 – 1185 .
- Kuempel , E. D. , Tran , C. L. , Castranova , V. and Bailer , A. J. 2006 . Lung Dosimetry and risk Assessment of Nanoparticles: Evaluating and Extending Current Models in Rats and Humans . Inhal. Toxicol. , 18 ( 10 ) : 717 – 724 .
- Laden , F. , Neas , L. M. , Dockery , D. W. and Schwartz , J. 2000 . Association of Fine Particulate Matter from Different Sources with Daily Mortality in Six US Cities . Environ. Health Perspect. , 108 ( 10 ) : 941 – 947 .
- Lagerkvist , B. , Linderholm , H. and Nordberg , G. F. 1986 . Vasospastic Tendency and Raynaud Phenomenon in Smelter Workers Exposed to Arsenic . Environ. Res. , 39 ( 2 ) : 465 – 474 .
- Li , N. , Sioutas , C. , Cho , A. , Schmitz , D. , Misra , C. , Sempf , J. , Wang , M. Y. , Oberley , T. , Froines , J. and Nel , A. 2003 . Ultrafine Particulate Pollutants Induce Oxidative Stress and Mitochondrial Damage . Environ. Health Perspect. , 111 ( 4 ) : 455 – 460 .
- Life Systems Inc., Clement Associates, United States. Agency for Toxic Substances and Disease Registry . 1992 . Toxicological Profile for Thallium , Atlanta, GA : U.S. Dept. of Health and Human Services Public Health Service Agency for Toxic Substances and Disease Registry .
- Ludolph , A. , Sennhenn , R. , Elger , C. , Bertram , H. P. and Weischer , K. 1986 . Incidence of Clinical and Electrophysiological Signs of Polyneuropathies in Workers Exposed to Thallium . Electroencephal. and Clinical Neurophysiol , 63 ( 1 ) : P7 – P7 .
- Mano , S. and Andreae , M. O. 1994 . Emission of Methyl–Bromide from Biomass Burning . Science , 263 ( 5151 ) : 1255 – 1257 .
- Moreno , T. , Querol , X. , Alastuey , A. , Minguillon , M. C. , Pey , J. , Rodriguez , S. , Miro , J. V. , Felis , C. and Gibbons , W. 2007 . Recreational Atmospheric Pollution Episodes: Inhalable Metalliferous Particles from Firework Displays . Atmos. Environ. , 41 ( 5 ) : 913 – 922 .
- MPPD . 2002–2006 . MPPD V2.0. A Model for Human and Rat Airway Particle Dosimetry Developed by CIIT, USA, in Collaboration with RIVM, the Netherlands, and Department of Housing, Spatial Planning and Environment, the Netherlands
- Naeher , L. P. , Brauer , M. , Lipsett , M. , Zelikoff , J. T. , Simpson , C. D. , Koenig , J. Q. and Smith , K. R. 2007 . Woodsmoke Health Effects: A Review . Inhal. Toxicol. , 19 ( 1 ) : 67 – 106 .
- Ostro , B. , Broadwin , R. , Green , S. , Feng , W. Y. and Lipsett , M. 2006 . Fine Particulate Air Pollution and Mortality in Nine California Counties:Results from CALFINE . Environ. Health Perspect. , 114 ( 1 ) : 29 – 33 .
- Ostro , B. , Feng , W. Y. , Broadwin , R. , Green , S. and Lipsett , M. 2007 . The Effects of Components of Fine Particulate air Pollution on Mortality in California: Results from CALFINE . Environ. Health Perspect. , 115 ( 1 ) : 13 – 19 .
- Qin , X. Y. and Prather , K. A. 2006 . Impact of Biomass Emissions on Particle Chemistry During the California Regional Particulate Air Quality Study . Intl. J. Mass Spectrom. , 258 ( 1–3 ) : 142 – 150 .
- Raabe , O. G. , Howard , R. S. and Cross , C. E. 1986 . “ Aerosol Considerations in Asthma ” . In Bronchial Asthma , Edited by: Gershwin , M. E. 495 – 514 . Orlando, FL : Brune & Stratton, Inc. .
- Research Triangle Institute, United States. Agency for Toxic Substances and Disease Registry . 1999 . Toxicological Profile for Cadmium , Atlanta, Ga. : U.S. Dept. of Health and Human Services Public Health Service Agency for Toxic Substances and Disease Registry .
- Robert , M. A. , Kleeman , M. J. and Jakober , C. A. 2007 . Size and Composition Distributions of Particulate Matter Emissions:Part 2—Heavy-Duty Diesel Vehicles . J. Air & Waste Manage. Assoc. , 57 ( 12 ) : 1429 – 1438 .
- Robert , M. A. , VanBergen , S. , Kleeman , M. J. and Jakober , C. A. 2007 . Size and Composition Distributions of Particulate Matter Emissions: Part 1—Light-Duty Gasoline Vehicles . J. Air & Waste Manage. Assoc. , 57 ( 12 ) : 1414 – 1428 .
- Schwartz , J. , Dockery , D. W. and Neas , L. M. 1996 . Is Daily Mortality Associated Specifically with Fine Particles? . J. Air & Waste Manage. Assoc. , 46 ( 10 ) : 927 – 939 .
- Sutton , H. C. and Winterbourn , C. C. 1989 . On the Participation of Higher Oxidation-States of Iron and Copper in Fenton Reactions . Free Radical Biol. Med. , 6 ( 1 ) : 53 – 60 .
- Townshend , R. H. 1982 . Acute Cadmium Pneumonitis—a 17-Year Follow-Up . British J. Industrial Medicine , 39 ( 4 ) : 411 – 412 .
- United States Agency for Toxic Substances and Disease Registry . 1992 . Toxicological Profile for Antimony. Final Report , Atlanta, GA : U.S. Dept. of Health and Human Services Public Health Service Agency for Toxic Substances and Disease Registry .
- Weinberg , E. D. 1996 . The Role of Iron in Cancer . European J. Cancer Prevention , 5 ( 1 ) : 19 – 36 .
- Ying , Q. and Kleeman , M. 2009 . Regional Contributions to Airborne Particulate Matter in Central California During a Severe Pollution Episode . Atmos. Environ. , 43 ( 6 ) : 1218 – 1228 .
- Ying , Q. , Lu , J. , Kaduwela , A. and Kleeman , M. 2008 . Modeling Air Quality During the California Regional PM10/PM2.5 Air Quality Study (CPRAQS) Using the UCD/CIT Source Oriented Air Quality Model—Part II. Regional Source Apportionment of Primary Airborne Particulate Matter . Atmos. Environ. , 42 ( 39 ) : 8967 – 8978 .
- Ying , Q. , Lu , J. , Kaduwela , A. and Kleeman , M. 2009 . Modeling Air Quality During the California Regional PM10/PM2.5 Air Quality Study (CPRAQS) using the UCD/CIT Source Oriented Air Quality Model—Part III. Regional Source Apportionment of Secondary and Total Airborne PM2.5 and PM0.1 . Atmos. Environ. , 43 : 419 – 430 .