Abstract
We present here the development and first field deployment of a novel Aircraft-based Laser ABlation Aerosol MAss spectrometer (ALABAMA), which is capable of measuring the chemical composition and size of individual ambient aerosol particles in the size range between 150 and 900 nm. The instrument uses a continuous wave 532 nm laser to size and detect the particles, a pulsed 266 nm laser to ablate and ionize the particles, and a bipolar, Z-shaped time-of-flight mass spectrometer to detect positive and negative ions. The ALABAMA fits into a 19”-aircraft rack of 150 cm height and has a total weight of 140 kg, thus currently being one of the smallest and lightest-weight instruments of its type. We present a detailed characterization of ALABAMA with respect to particle beam width, detection and ablation efficiency, and example mass spectra of different particle types. The first aircraft-based field mission was performed within the MEGAPOLI summer campaign in July 2009 around Paris, France, onboard an ATR42 aircraft. During 11 research flights, corresponding to a total measuring time of approximately 44 hours, ALABAMA measured 6502 single particle mass spectra. The mass spectra were classified into eight particle classes using distinctive markers for each particle type. The most abundant particle types contained organic and secondary inorganic compounds. The results further show that differences in the abundance of observed particle types between different air masses are very pronounced when comparing air masses arriving from the greater Paris area with air masses arriving from other directions.
1. Introduction
Information on the chemical composition of individual aerosol particles is difficult to obtain, because the mass of one particle of 500 nm diameter is in the order of 10–13 g. However, many atmospheric processes involving aerosol particles are, although not exclusively, a function of the individual particle's chemical composition and the aerosol mixing state. For example, the scattering of radiation depends on the refractive index which in turn depends on the particle composition. Furthermore, the hygroscopic growth and the ability to act as a cloud condensation nucleus (CCN) or ice nucleus (IN) depend on the individual particle's composition. These aerosol involving processes do not only occur at the Earth's surface or the planetary boundary layer, but also at higher altitudes in the free troposphere where clouds actually form and where an important fraction of incoming solar radiation as well as outgoing terrestrial radiation is scattered and absorbed. It is therefore necessary to develop instruments that allow the determination of the composition of individual aerosol particles not only ground-based but also on airborne platforms.
In recent years, single particle mass spectrometry (SPMS) has proven to be a valuable tool for the analysis of individual particles, and several types of instruments were constructed, (Hinz et al. Citation1994; Prather et al. Citation1994; Johnston and Wexler Citation1995; Murphy and Thomson Citation1995; Zelenyuk and Imre Citation2005; Kamphus et al. Citation2008). A detailed overview on the different designs of SPMS instruments is given by Murphy (Citation2007). The common concept of these instruments is that the individual aerosol particles are evaporated and ionized by laser ablation, which is a different concept than that of thermal desorption followed by electron impact ionization that is used by the Aerodyne-type aerosol mass spectrometers (Jayne et al. Citation2000; Canagaratna et al. Citation2007). Single particle analysis using the thermal desorption technique is currently under development (Drewnick et al. Citation2005; Cross et al. 2007; Cross et al. Citation2009); however, this technique is not sensitive to refractory material (e.g., mineral dust, soot). One of the most challenging demands for aircraft-based instrumentation is that these instruments should be small, light-weight, robust, and alignment-preserving in order to be operated on airborne platforms. The first aircraft-based SPMS, the PALMS instrument, was operated onboard the WB-57F aircraft in 1998 (Murphy et al. Citation1998; Thomson et al. 2000). Other research groups followed, and the instruments developed rapidly towards miniaturization, improved particle detection rate (Zelenyuk et al. Citation2009a), and more detailed chemical information by using bipolar mass spectrometers (Pratt et al. Citation2009).
In order to perform state-of-the-art aerosol measurements onboard the new German research aircraft HALO (High Altitude and LOng range research aircraft), it is necessary to operate an SPMS together with other aerosol instruments. No aircraft-compatible SPMS is commercially available, thus it was necessary to develop a new instrument based on advanced technological developments in laser and mass spectrometric techniques. Our instrument, which was designed and built at the Max Planck Institute for Chemistry, Mainz, Germany (MPIC), is named ALABAMA (Aircraft-based Laser Ablation Aerosol Mass Spectrometer). Although the payload and space of HALO, a Gulfstream V aircraft, the same model as HIAPER (Laursen et al. Citation2006), is rather large, the need for best possible miniaturization was given to allow maximization of instrumentation during a HALO scientific mission. The newly developed ALABAMA is one of the smallest, lightest-weight aircraft-based bipolar SPMS and has measurement capabilities comparable to those of other novel aircraft-based SPMS, namely the A-ATOFMS (Pratt et al. Citation2009), and the SPLAT-II (Zelenyuk et al. Citation2009a). ALABAMA uses a Liu-type aerodynamic lens (Liu et al. Citation1995a; b) to focus particles into a narrow beam, a splitted cw 532 Nd:YVO4 laser (λ = 532 nm) for particle sizing, and a pulsed Nd:YAG laser (λ = 266 nm) for particle ablation and ionization. The ions are detected using a bipolar Z-shaped time-of-flight mass spectrometer of the same type as is used in the A-ATOFMS (Pratt et al. 2009).
The first field deployment of ALABAMA took place within the MEGAPOLI summer campaign around Paris, France, in July 2009. During this campaign, ALABAMA was used as a unipolar SPMS onboard the research aircraft ATR-42, operated by SAFIRE (Service des Avions Français Instrumentés pour la Recherche en Environnement). The aircraft was stationed at the airport of Pontoise (49.10°N, 2.04°E), 35 km North-West of Paris. Here we report on the design and technical specifications of ALABAMA, on laboratory characterizations of beam width, detection and ablation efficiency, and show the first aircraft-based field results obtained during the MEGAPOLI 2009 summer campaign.
2. Experimental
2.1. General Description of the ALABAMA Design
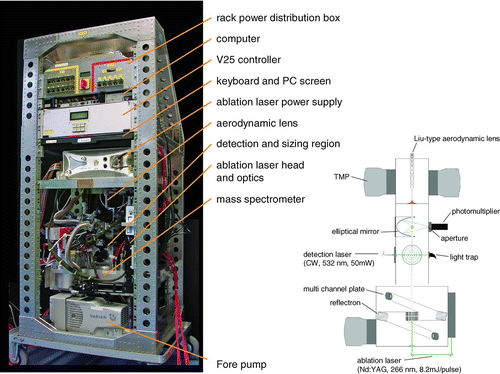
shows a photograph and a basic scheme of the ALABAMA instrument. Before entering the first pumping stage of the vacuum chamber, the particles are focused to a narrow beam by an aerodynamic lens. The first and the second pumping stages are separated by a skimmer. In the second pumping stage the particles pass through two orthogonal detection laser beams and produce two light scattering signals which are focused to photomultiplier tubes (PMT) by elliptical mirrors and allow to determine their velocity and thereby by calibration their “vacuum aerodynamic diameter” (dva ) (Jimenez et al. Citation2003; DeCarlo et al. Citation2004). After the sizing the particles enter the ionization region of a bipolar, Z-shaped time-of-flight mass spectrometer, where they are ablated by a triggered laser pulse, leading to partial or full evaporation of the particle and to ionization of the evolving vapor molecules. The ions are extracted into the flight tubes of the mass spectrometer, reflected by reflectrons and detected by multichannel plates (MCP), producing a bipolar mass spectrum for the individual particles.
2.2. Particle Inlet
The aerosol particles are sampled through an aerodynamic lens as designed by Liu et al. (Citation1995a) where they are accelerated dependent on their vacuum aerodynamic diameter. The particles are focused successively by passing through 6 apertures with decreasing diameter, the first one having a bore diameter of 5 mm, the last one having a bore diameter of 3 mm. A detailed description of the lens can be found in Liu et al. (Citation1995a; b). The lens needs to be operated at an inlet pressure in the range of 0.5–5 mbar. Under standard ambient pressure conditions, a 100 μm ID pinhole mounted upstream of the aerodynamic lens reduces the pressure to the desired value and critically limits the inlet flow into the instrument to ∼80 cm3min–1. As described by Liu et al. (Citation2007) the aerodynamic lens focuses particles in the aerodynamic diameter range between about 40 nm and 1 μm, with a transmission efficiency close to 100% for particles with diameters between ∼60 and ∼600 nm, rapidly decreasing for smaller and larger particles. Particles with a diameter of 1 μm are only transmitted with an efficiency of ∼25%. After being focused by the aerodynamic lens the particles enter the first pumping stage which is kept at a pressure of ∼2.5·10–2 mbar by two turbomolecular pumps (Adixen/Alcatel, ATH 31+, flow rate: 30 l/s each), mounted perpendicular to the lens axis. A scroll pump (Varian IDP-3, flow rate: 60 l/min) is used as forepump for all turbomolecular pumps in the system. On the inlet side the lens is supported by a circular plate which is pressed against a flat spring by two orthogonally attached screws with a fine thread, which allow for a precise adjustment in two dimensions. On the exit side the lens is embedded in a ball joint which is mounted inside of the first pumping stage. The ball joint is mounted on stilts, 25 mm above the tip of a skimmer with a 1 mm orifice, allowing for an accurate airflow between the lens exit and the turbomolecular pumps. The skimmer separates the first and the second pumping stage, the latter one comprising the detection system and the mass spectrometer.
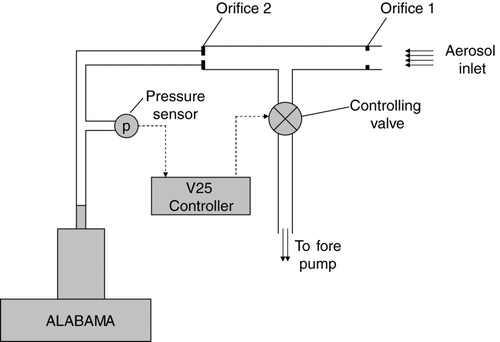
For aircraft operation, a pressure controlled inlet (PCI), designed after Bahreini et al. (Citation2008), can by mounted in front of the aerodynamic lens (). This PCI ensures that the upstream pressure in front of the lens and thereby also the pressure inside the lens are kept constant. The critical orifice sizes and the intermediate pressure between the two orifices depend on the maximum desired flight altitude: the intermediate pressure has to be lower by at least a factor of two than the minimal ambient pressure in order to keep the flow through the orifice critical. For example, if the ambient pressure at the maximum flight altitude of 11 km is 200 hPa, the intermediate pressure has to be <100 hPa. In order to keep the lens pressure in the allowed range (0.5–5 hPa), the diameter of the critical orifice in front of the lens (orifice 2 in ; 100 μm for ground based operation w/o the PCI) has to be increased by a factor of about three.
2.3. Particle Detection and Sizing
The second pumping stage comprises the sizing region and the mass spectrometer and is kept at a pressure of ∼4.0·10–6 mbar by another pair of turbomolecular pumps (Pfeiffer, HiPace 300, flow rate: 300 l/s each) which are attached to the top and bottom of the mass spectrometer. For detecting the particles a 150 mW diode pumped Nd:YAG continuous wave laser (Coherent, Compass 315M-150) with a wavelength of 532 nm is used. After being coupled into an optical fiber, the laser beam is split into two beams by a beam splitter (OZ-optics, Fused-12-532-3.5/125-50/50-3AF1A1A-3-0.5). After losses in the coupling and splitting processes, an effective power of about 50 mW is available at each of the two exits of the optical fiber.
Each of the fibers is mounted into a custom built adjustment table, which can be tilted by approximately 5° in each direction and is centered over a non-reflective window (25 mm diameter) in the vacuum chamber. This allows alignment of the laser beams across the particle beam and compensation of manufacturing inaccuracies. The laser beams are focused into the vacuum chamber by a grin lens with a focal distance of 85 mm to a diameter of ∼190 μm (1/e2). The laser beams are aligned orthogonal to each other and to the aerodynamic lens, which allows for a more precise adjustment of the particle beam with the instrument's rotational axis. The distance between the exit of the aerodynamic lens and the first detection laser is 90.5 mm, the distance between the first and the second detection laser is 70 mm.
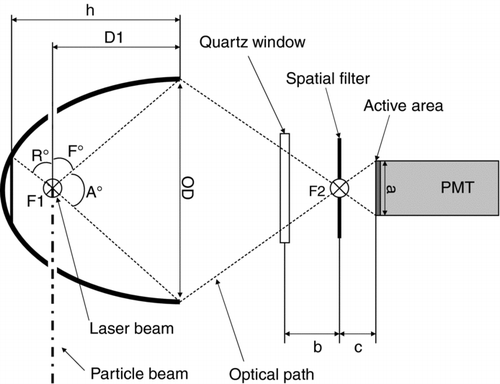
Inside of the vacuum chamber two elliptical mirrors (Optiforms Inc., custom design, P/N: E64NV-010213000) are mounted such that their first focal point F1 matches the focal point of the detection laser and is crossed by the axis of the particle beam, the axis of symmetry being perpendicular to the laser beam axis (). The mirrors have four orifices each, allowing the particle beam and the laser beam to pass in orthogonal directions. The light that is scattered into an angle of 3°–177° with respect to the laser beam axis and into the axis-symmetric range () between R°= –41.6° and F°= 56.8° with respect to the particle beam axis is reflected into the second focal point F2 of the mirror, which has a distance of 63.5 mm from the first focal point.
FIG. 3 Drawing of the detection system of the scattered light using an elliptical mirror. F1, F2: focal points, PMT: photomultiplier tube. The detection laser hits the particle in the first focal point. The light scattered into the range between –R° and +F° is detected by the PMT behind the second focal point. The angular range –R° and +F° is axis-symmetric with respect to the axis F1 – F2.
The second focal point is outside of the vacuum chamber, separated by another non-reflective window. Outside of each exit window an assembly consisting of a 100 μm pinhole centered 6.9 mm in front of a photomultiplier tube (Hamamatsu, R1463) is held by a xyz-microtable (Owis, MKT 40C XYZ), which enables the operator to align the pinhole with the second focal point with an accuracy of 1 μm. The distance between the pinhole and the photomultiplier is chosen such that the active area of the tube is fully utilized. In the beam direction of the detection laser another non-reflective window allows the laser beam to exit the sizing chamber into a custom built light trap, to reduce background light in the vacuum chamber.
The scattering signal is detected by the photomultipliers and amplified by a factor of ten by two pre-amplifiers, built in the electronic workshop of MPIC. The two photomultiplier signals are further processed (section 2.5. to determine the particle's time of flight and thereby its vacuum aerodynamic diameter by calibration measurements.
2.4. Particle Ionization by Laser Ablation and Ion Analysis
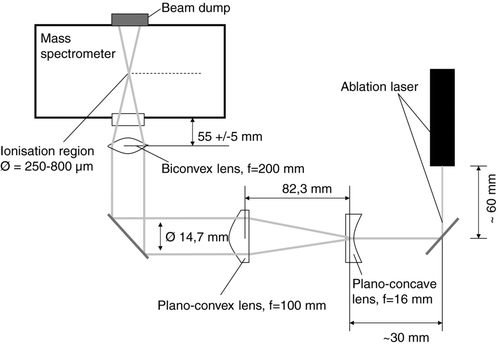
For ion analysis a Z-shaped bipolar time-of-flight mass spectrometer (TOFWERK AG, Switzerland), as used by Pratt et al. (Citation2009), is mounted to the sizing chamber. The distance between the exit of the aerodynamic lens and the ionization region of the mass spectrometer is 276 mm. To ionize the particles inside the ionization region, a 266 nm pulsed Nd:YAG laser with quadrupled frequency (Brilliant Ultra, Quantel Laser USA) is attached to the mass spectrometer and directed into the ionization region by a mirror/lens system (Linos photonics). The laser beam has a width of 2.2 mm at the exit of the laser head, a pulse length of 5.2 ns, an energy of 6.7 mJ per pulse, and a maximum repetition rate of 5 Hz. A schematic of the optical system is shown in . After being reflected by 90° by an adjustable mirror (quartz with oxide mirror layer, 99.5% reflection efficiency at λ= 266 nm, Linos Photonics) the beam is expanded by a plano-concave lens with a focal width of 16 mm. 82.3 mm further the laser is demodulated by a plano-convex lens at a beam diameter of 14.7 mm. After being reflected once more by another adjustable mirror the beam is focused by a biconvex lens with a focal length of 200 mm to a minimum spot size of 250 μm. The two mirrors can be adjusted, so that the focal point matches the center of the ToF MSs ionization region or of the particle beam, respectively. The focusing lens is mounted inside a thread and can be moved, so that the focal diameter at the level of the particle beam can be enlarged to approximately 800 μm, leading to a larger area of superposition of laser beam and particle beam at the expense of the energy density. The ions generated by the laser ablation process are extracted by grids, designed according to Wiley and McLaren (Citation1955) with opposite polarities into two V-shaped time-of-flight mass spectrometer tubes. To increase the mass resolution the ions are reflected once in a reflectron, leading to an effective free flight path of 610 mm. At the end of each flight tube a detector assembly, consisting of a multichannel/scintillator/photomultiplier combination, measures the time-dependent ion current, caused by the different flight times of the ions as a function of their mass-to-charge ratio (m/z). The two signals (positive and negative ion signals) are amplified by a factor of 12 by two external signal amplifiers (Becker & Hickl GmbH, ACA-2–13).
2.5. Instrument Control and Data Acquisition System
Most of the process control is bundled in a V25 Embedded Controller System (MME Müller Mikroelektronik). Besides an 8 MHz microcontroller, the V25 can host several customized functional cards that are mostly developed and assembled by the in-house electronic workshop of MPIC. The functions can be programmed with PASCAL code to match the desired tasks and the cards communicate via FPGA (Field Programmable Gate Array) with the microcontroller. The functions performed by the V25 include the following: Via RS485 interface the V25's microcontroller is actuating two miniboard controllers (Alcatel ACT201) that control the Alcatel turbomolecular pumps and request basic information (status, temperature, speed, power consumption) from the pumps. The Pfeiffer turbomolecular pumps are directly controlled and monitored via the RS485 interface of the V25. Six integrated high voltage cards (custom-built) each produce 4 high voltages that can be freely adjusted by the operator up to 6 kV to supply the mass spectrometer and the photomultipliers. A separate DC-card can supply several components with voltages up to 24 VDC at low currents (e.g., pre-amplifiers). A custom-built trigger card controls the entire detection and ablation process. The light scattering signals recorded by the PMTs are sent to the two input channels of the trigger card and are compared to a user-defined threshold value, allowing for a separation between actual signals and background noise. After the signal from the first PMT is recorded, the first channel is set to “blind” for a pre-selectable transit time (“blind-time”) between 10 and 1000 ms, such that no more signals are evaluated for that time. If a signal is detected on the second channel during the transit time the time difference between the two signals is determined with an accuracy of 50 ns (time resolution of the trigger card). With the known distances between the three laser beams, both the particle velocity and the arrival time of the particle inside the ionization region are calculated. Since the ablation laser's flash lamps have to be triggered 150 μs before the Q-switch is starting the laser pulse and have an internal delay of 500 μs, the trigger card sends the flash lamp trigger signal 650 μs before the calculated arrival time of the particle in the ionization region. Another trigger signal for the Q-switch is sent at the calculated particle arrival time, also with an accuracy of 50 ns. To account for the actual laser alignments, a timing factor for calculating the arrival time of the particle can be adjusted by the operator. The timing factor allows for compensating deviations in the laser alignment from the theoretical geometry and manufacturing inaccuracies.
After the calculated particle arrival time each polarity of the amplified mass spectrometer signal (positive/negative spectrum) is recorded on two channels with different dynamic range on a 4-channel 8-bit digitizer card (Agilent Acquiris DC270) with up to 1 ns time-resolution, which is installed in a rack PC. The data acquisition and storage is controlled by a LabVIEW (National Instruments Corporation) program that displays and saves the mass spectra and size information in an 8-bit text format (39 KB/bipolar spectrum). The computer is equipped with a solid state hard disk, to prevent hard disc failure under rough measurement conditions. The power supply of the entire instrument is integrated in a compact (48 × 19 × 16 cm3) power distribution box. The box needs to be supplied with either a 115 V/400 Hz and a 230 V/60 Hz or two 230 V/60 Hz lines, allowing for easy integration on most mobile platforms or field stations. The 230 V/60 Hz power is subdivided to supply the forepump, the PC and the ablation laser power supply. The normal operation power uptake on that circuit is 700 W. The 115 V/60 Hz supply (or the second of the 230 V/60 Hz lines, respectively) is used to generate 24 VDC by a switching power supply (ASTE, iMP4-2Q0-2Q0-20-A) and feeds all other components that had been chosen to run on 24 VDC. The normal operation power uptake by the 24 VDC components is 300 W, during spin-up of the pumps it is 600 W. All power circuits are secured by individual circuit breakers, configured to withstand the maximum load during the spin-up phase. All cables are lined with flame-resistant PTFE and meet aircraft safety standards.
3. Laboratory Performance and Instrumental Characterization
3.1. Experimental Setup
The performance of the ALABAMA instrument was characterized using particles of different compositions and sizes. For fundamental analysis and calibration polystyrene latex (PSL) particles (Duke Scientific, Inc.) with various diameters were used because they are easy to ionize, are spherical and have a well-defined diameter. Further sodium chloride (NaCl), ammonium nitrate (NH4NO3), and soot particles were investigated. PSL, NaCl, and ammonium nitrate were dissolved in distilled, de-ionized water and nebulized in an atomizer (TSI 3076, TSI Inc., St. Paul, Minnesota, USA) with particle-free air. Soot particles were produced in a commercial spark soot generator (GFG 1000, PALAS, Karlsruhe, Germany). After passing a diffusion dryer the particles were size selected with respect to mobility diameter (dmob ) by a differential mobility analyzer (TSI 3081, TSI Inc.). The size selected particles were transferred to the ALABAMA inlet and to a reference CPC (TSI 3010, TSI Inc.). All tubes in the experimental setup were made of stainless steel and the tube lengths have been kept short to reduce the particles’ residence time and particle losses in the system.
The detection efficiency of the ALABAMA is defined as the number of particles that are detected by both PMTs and thereby successfully sized within a defined time, divided by the number of particles that actually enter the instrument during this time interval. The number of entering particles is determined by the product of the particle concentration, measured with the reference CPC, the inlet flow rate, and the sampling time. The “blind time” of the detection was set to 70 ms, allowing a maximum detection rate of 14 Hz. The particle concentration was kept below 10 cm–3 (representing upper tropospheric conditions), so that less than 13 particles per second enter the instrument. This definition of detection efficiency accounts for all losses inside the ALABAMA inlet system.
The last mirror that reflects the ablation laser beam into the ionization region is mounted on a translation stage that allows moving the laser beam through the particle beam with an accuracy of 1 μm. Therefore the particle beam can be “scanned” with the ablation laser in order to determine the beam axis position.
The ablation efficiency (or hit rate) is defined as the number of particles that are successfully ablated and of which a mass spectrum is obtained in a defined time interval, divided by the number of particles that have been successfully sized in the same period.
3.2. Aerodynamic Sizing
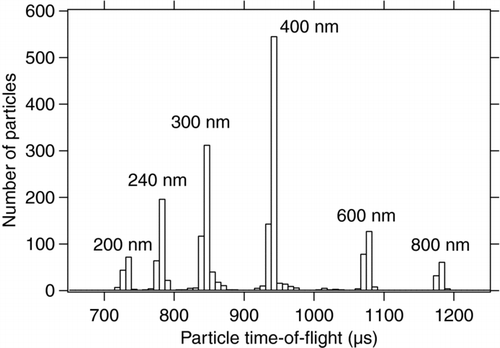
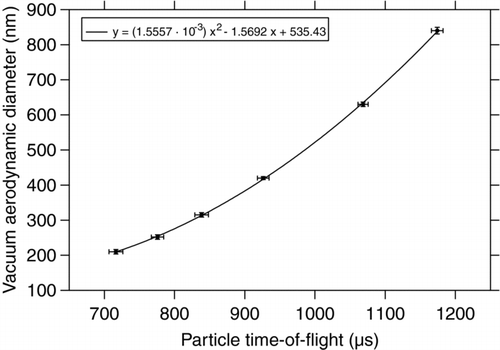
To determine the accuracy of the size measurement in the ALABAMA, PSL particles of various mobility diameters between 200 and 800 nm have been measured. The vacuum aerodynamic diameter slightly differs from the mobility diameter due to the density of 1.05 g cm–3 of the PSL particles (Jimenez et al. Citation2003; DeCarlo et al. Citation2004). shows the histogram of measured flight times between the two detection lasers. The different peaks clearly correspond to the known diameters of the sampled PSL particles. By fitting the peaks with a normal distribution, the average time-of-flight for each size was determined, including the standard deviation for each size. shows the vacuum aerodynamic diameter including the diameter accuracy as specified by the manufacturer versus the average measured time-of-flight between the two detection lasers. The fitted quadratic function shows good agreement with the measured values. The measurements show that the deviation between the nominal particle diameter and the fit curve is well inside the range of the manufacturer's certified particle size accuracy. The most probable error in size measurement is the uncertainty at which point of the laser focus a particle has created enough scattered light to be detected by the PMT (Zelenyuk et al. Citation2009b). Larger particles exceed this threshold before their center has crossed the laser axis, while for smaller particles this threshold often is not exceeded before the particle has almost entirely crossed the laser beam, resulting in a bias in time measurement.
3.3. Efficiency of Particle Detection
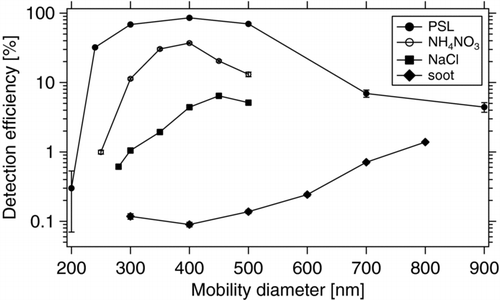
The particle detection efficiency of ALABAMA has been determined for several particle types, as described in section 3.1. PSL particles represent the benchmark for detection efficiency. Since PSL particles are spherical they are being well focused by the aerodynamic lens (Liu et al. Citation1995a; b), further experience shows that they are easy to detect with a 532 nm laser (Kamphus et al. Citation2008). Sodium chloride particles form a wider particle beam because of their aspherical shape (Schreiner et al. 1999). Broadening of the particle beam leads to decreasing detection efficiency because a fraction of the particles misses the detection lasers. Fresh soot particles are fractal-like (Schneider et al. Citation2006) and absorb a large fraction of the laser light at 532 nm wavelength (Schnaiter et al. Citation2003), making it a challenge to detect them using the light scattering setup. Therefore in this characterization soot particles represent the lower end of expected detection efficiencies. shows the detection efficiencies for PSL, soot, NaCl, and NH4NO3 particles as a function of particle size. As expected, PSL particles show the highest detection efficiencies, peaking at 400 nm particle diameter with a detection efficiency of 86%. For particles larger than 500 nm the detection efficiency decreases significantly due to the decreasing transmission efficiency of the aerodynamic lens for larger particles (section 2.2. Smaller particles are transmitted through the aerodynamic lens with high efficiency, but produce significantly less scattered light, leading to a marked decrease in detection efficiency: While PSL particles with 240 nm diameter are still detected with an efficiency >30%, 200 nm particles have a detection efficiency of only 0.3%. Besides the low amount of scattered light also the particle beam axis position can partly be responsible for these losses (section 3.4. The lower detection efficiencies measured for NaCl and NH4NO3 indicate that the particle beam at the position of the second detection laser is for such aspherical particles already broader than the laser beam. For soot particles, the low amount of scattered light adds up to effect of the aspherical shape, leading to the lowest detection efficiencies measured for the investigated particle types.
3.4. Particle Beam Properties
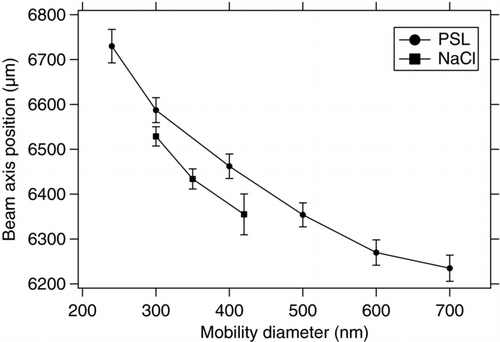
The particle beam properties are a crucial factor for detection and ablation efficiencies. Since the particle beam is divergent the beam width increases with the distance from the lens outlet (Huffman et al. Citation2005). In order to maximize detection and ablation efficiencies the laser focal diameters should be at least as large as the particle beam width; otherwise a fraction of the particles misses one or even both of the laser beams. Only particles that have been detected by both detection lasers can be ablated by the ablation laser, thus the maximum effective beam width in the ionization region is determined by the geometry of the detection system to about 800 μm. Particles outside this range cannot be ablated even with a very broad ablation laser focus, because these particles would not be detected by the send detection laser and thereby the ablation laser is not triggered. By moving the second mirror of the ablation laser beam control orthogonal to the particle beam, the ablation laser axis was moved stepwise across the particle beam, and the ablation efficiency was measured for each step. This measurement confirmed the maximum measurable beam width of 800 μm. To determine the position of the symmetry axis of the beam depending on the sampled particle diameter and particle type, particles of different composition (PSL and NaCl) have been size selected and were sampled with the ALABAMA. The point of the maximum ablation efficiency (respectively, the maximum of a gauss-fit) was considered as the location of the symmetry axis of the particle beam for the given particle diameter.
shows the results of the beam position measurement. The position on the ordinate displays the position of the translation stage that hosts the reflecting mirror. The measurements show that the particle beam axis is tilted significantly for different particle diameters, leading to a difference of about 500 μm in the beam axis position for particles between 240 and 700 nm. The effect seems to be independent of particles shape, because the effect is as distinctive for PSL particles as for NaCl particles. As particles of different diameters are clearly focused into different directions by the aerodynamic lens, this effect will cause a decrease of the ablation efficiency, since the magnitude of the beam shift is in the range of the ablation lasers focal spot diameter, which again causes many particles to miss the laser spot. This axis shift can most likely be attributed to inaccuracies in the manufacturing of the aerodynamic lens. At the current stage such inaccuracies have to be accepted and therefore these effects need to be quantified to estimate the loss mechanisms of the ablation efficiency. Future lens designs will try to avoid such inaccuracies.
3.5. Ablation Efficiency
The ablation efficiency is defined here as the number of particles that are successfully ionized by the ablation laser and create an ion signal (mass spectrum) divided by the number of particles having been sized before. As mentioned in section 3.4. the measurable particle beam in the ionization region of the mass spectrometer is about 800 μm wide. To obtain a maximum ablation efficiency, the focusing lens for the ablation laser has been displaced in a way that the actual focus is outside of the ionization region has approximately the same diameter as the maximum measurable particle beam (measured laser focus width: ∼700 μm). The output energy of the laser has been measured (Fieldmaster GS, Coherent Inc.) to be 6.7 mJ per pulse. Considering a pulse length of 5.2 ns, the average energy density in the ionization region is about 2.5 × 10⁸ W cm–2 for the defocused laser beam. With this setup the maximum ablation efficiency was 96% for 400 nm PSL particles and >90% in the entire size range between 240 and 500 nm (). For larger particles the efficiency decreases significantly. It has to be noted that in order to create a realistic measurement situation the ablation laser was not readjusted for maximum ablation efficiency for every particle size, but was kept at a fixed position for all measurements. This fact explains the decrease in ablation efficiency for larger particles, because the particle beam axis shifts (section 3.4. and particles miss the ablation laser spot.
FIG. 9 Ablation efficiency for PSL and NaCl at two different laser ablation focal diameters (280 and 700 μm).
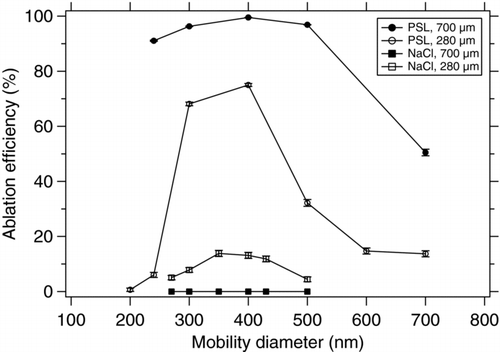
With the same setup (i.e., defocused ablation laser) it was not possible to acquire any NaCl mass spectra, indicating that the laser density in the 700 μm spot is not high enough to ionize NaCl particles. For a second experiment the focusing lens has been adjusted such that the focal point of the lens is right in the ionization region, leading to a 250 μm laser spot, corresponding to an energy density of ∼2.6 × 10⁹ W cm–2. As expected, the ablation efficiency for PSL decreases (max. 88%) and is not constant over a wider particle size range, because the particle beam is now much broader than the laser spot and the shift of the axis affects the ablation efficiency much stronger. On the other hand, with the higher energy density it was possible to ionize NaCl particles. A maximum ablation efficiency of 33% could be obtained for 350 nm (d mob). Again the ablation efficiency decreases markedly for particles with different sizes due to the divergence and shift of the particle beam with respect to the comparatively small laser focal spot.
3.6. Mass Spectrometer Resolution
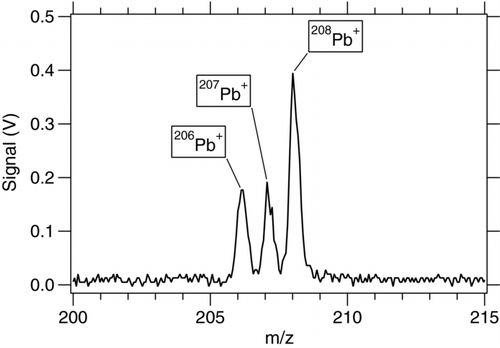
shows an excerpt of a mass spectrum of a single PSL particle, coated with lead acetate. The three isotopes of lead at m/z 206, 207, and 208 can clearly be separated. This spectrum shows a mass resolution m/Δm of about 400 at m/z 200. The average mass resolution of the Z-ToF mass spectrometer, measured with soot particles, ranges between 100 for low m/z values and 200 for larger positive ions and up to 600 for larger negative ions. The relatively low mass resolution is mainly caused by the laser ablation and ionization process, leading to a large variability in starting conditions for the ions produced from the single particles. Space charge effects can also reduce the mass resolution, and this is most likely the reason for the better mass resolution for the negative ions, since fewer negative ions than positive ions are produced by the ablation process (Pratt et al. Citation2009).
3.7. Exemplary Mass Spectra
shows examples of bipolar mass spectra for two organic compounds (1,4-Benzenediamine (=p-Phenylendiamin), C6H4(NH2)2; acetic acid, CH3COOH) and two inorganic compounds (ammonium nitrate, NH4NO3; ammonium sulfate, (NH4)2SO4). The advantage of the ablation laser wavelength of 266 nm is that the fragmentation is less than for shorter wavelengths, and therefore larger fragment ions, especially for the organic species, are formed. This allows for distinguishing between elemental carbon and organic particles, because organic fragment ions as C2H+ 3 (m/z 27), C2H– 2 (m/z 26), and even complete molecular ions as CH3COOH+ (m/z 60, acetic acid, ) can be detected. The positive mass spectra of soot particles () show only peaks of C+ n ions. In the negative mass spectra of ammonium nitrate, NO– 2 (m/z 46) and NO– 3 (m/z 62) are the most prominent peaks, the negative mass spectrum of ammonium sulfate is dominated by HSO– 4 (m/z 97) and SO– 3 (m/z 80). This shows that two of the most important components of secondary inorganic aerosol can be identified. In the positive mass spectra of ammonium nitrate and ammonium sulfate, the peak at m/z 18 (NH+ 4) can be used as an indicator for such secondary aerosol (Hinz et al. 2006) components, but the majority of the peaks is most likely due to contamination with organic material (m/z 27, 29, 43) with potassium (m/z 39, 41), or chloride (m/z 37).
FIG. 11 Example mass spectra for various organic and inorganic aerosol particles. Left: positive ions, right: negative ions. (a) 1,4-Benzenediamine (p-Phenylendiamine), (b) acetic acid, (c) ammonium nitrate, (d) ammonium sulfate.
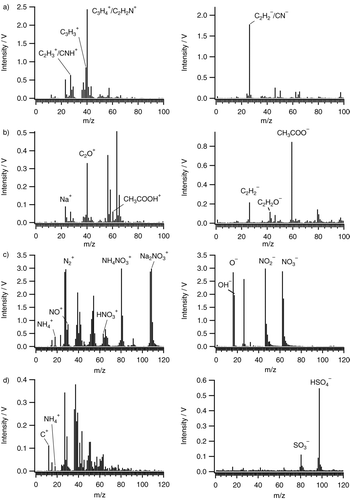
In principle, these mass spectra are comparable with other laser ablation instruments that use 266 nm, namely the ATOFMS (Prather et al. Citation1994) and the SPASS (Erdmann et al. Citation2005). ATOFMS and SPASS measurements of nitrate show a very similar pattern of negative ions for nitrate measurements with the major peaks being NO– 2 and NO– 3 (Gard et al. Citation1997; Erdmann et al. Citation2005; Dall’Osto et al. Citation2009), while positive ions appear to be rather different (Liu et al. Citation2000; Dall’Osto et al. Citation2009).
Parent ions protonated for positive ions and deprotonated for negative ions have been observed for numerous organic compounds in ATOFMS measurements (Silva and Prather Citation2000), similar to the ALABAMA mass spectrum of acetic acid in . However, we found from laboratory measurements that the degree of fragmentation is not only a function of the laser wavelength but also of the energy density at the ablation region. For example, defocusing the laser leads to lower energy density and to less fragmentation. It is therefore necessary to maintain the energy density in the ablation region constant in the course of a measurement in order to obtain comparable mass spectra.
4. Aircraft-based Deployment of ALABAMA during the MEGAPOLI 2009 Field Campaign
4.1. Aircraft Integration and Performance Test
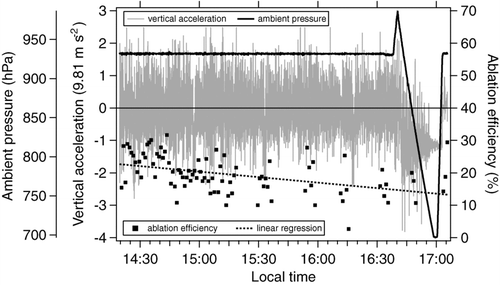
Operating a single particle laser mass spectrometer onboard of an aircraft requires special efforts in design and setup to meet safety requirements, fulfill weight and power limitations and at the same time guarantee high performance under rough conditions (e.g., shocks, vibrations, and high temperatures). From the beginning of the instrument design all components have been chosen to keep weight, volume and power consumption at a minimum. All components, including power supply and controls are mounted into one standard 19″ (0.293 m) aircraft compatible rack (approx. 1.40 m high). Using only one rack alleviates handling and operation on various mobile platforms. The center of gravity is in both dimensions less than 5 cm away from the racks symmetry axis and approximately 0.46 m above the bottom plane of the rack. All fitting accessories have been dimensioned in order to withstand a 9 g acceleration in aircraft forward direction, 4.5 g upwards, 7 g downwards, and 3 g sideways. To assure safety for all operators on board the detection laser as well as the ablation laser beam paths have been entirely enclosed with anodized aluminum. All cables are either lined with flame-retardant Teflon or with an extra layer of flame-retardant fabrics. Due to space restrictions the optical pathway of the ablation laser had to be shorter than during the laboratory characterization. Therefore it was not possible to realize a 700 μm focal spot in the ionization region, leading to lower ablation efficiencies than in the laboratory. The major concern was to assure a stable and constant alignment of the ablation laser, independent of shocks and vibrations. Therefore the unit consisting of particle flight chamber, mass spectrometer and ablation laser head (including optics) is mounted to the rack with four wire-rope shock-mounts (J536-10D2, Sebert Schwingungstechnik GmbH, Germany). shows a time series of the measured ablation efficiency of ALABAMA during a four hour flight on July 1, 2009. Flight segments with zero ablation efficiency counts are due to measurement pauses because of overheating of the ablation laser. The ablation efficiency is decreasing by about 40% over the entire flight, in spite of the strong vertical accelerations in a range of ±2.5 g that were measured by the aircraft sensors. These rough conditions were caused by turbulences due to strong convection at the flight altitude of about 600 m above sea level. As a comparison, the vertical acceleration at regular cruising altitudes can be seen around 17:00 local time, where a vertical profile up to 3000 m was flown. In this altitude, accelerations are in the range of only ±0.2 g. The offset of ∼–1 g is due to the spiraling of the aircraft. Overall the detection and ablation efficiencies were almost constant over the entire campaign without necessity for major calibrations.
4.2. MEGAPOLI 2009 Campaign Overview
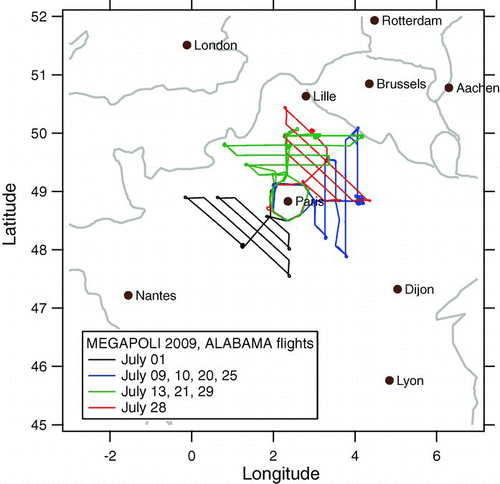
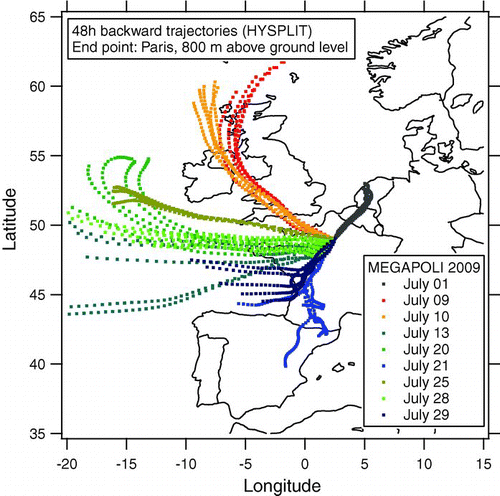
A first field deployment of the ALABAMA instrument on an aircraft took place during the 2009 MEGAPOLI (Megacities: Emissions, urban, regional and Global Atmospheric POLlution and climate effects, and Integrated tools for assessment and mitigation) campaign, focusing on emission plumes from densely populated urban areas. The campaign took place from July 1 to 31 in the greater Paris area. Besides three fixed measurement stations (center, upwind, and downwind of Paris), three van-based laboratories contributed mobile measurements. The aircraft-based measurements were performed on an ATR-42 aircraft, operated by the French Service des Avions Français Instrumentés pour la Recherche en Environnement (SAFIRE). The measurements onboard the ATR-42 included gas-phase measurements (ozone, CO, VOC, NO y ), and aerosol measurements: particle number/size distribution (CPC, SMPS, OPC), optical particle properties (PSAP, nephelometer), cloud condensation nuclei concentration (CCNC) and size resolved chemical composition (ALABAMA, AMS, filters). Due to air traffic restrictions only 6 pre-defined flight patterns, that had been submitted to air traffic control (ATC) prior to the campaign, could be flown. Each pattern included first a circle around the city center followed by a flight segment leading out of the city into a certain direction and allowing to cross the expected pollution plume multiple times. The specific flight pattern had to be submitted to ATC one day in advance and could not be changed thereafter. In order to cross the pollution plume during a flight, several tools were used to predict the evolution of the pollution plume. Besides meteorological data (wind speed, wind direction, precipitation), mostly PREV’AIR (Prévisions et observations de la qualité de l’air en France et en Europe) forecasts for CO, NO x and particulate matter (PM2.5) were used to predict the direction and magnitude of the plume evolution, based on which the flight pattern was selected. During the one month campaign 11 scientific flights of 4 hours each have been performed. The ALABAMA collected significant numbers of mass spectra during 9 flights. shows the flight patterns of these flights. Backward trajectories for these flight days were calculated using the HYSPLIT model (Draxler and Rolph 2010) (). Several independent instruments confirmed the successful sampling of the city's pollution plume (e.g., particle counter, nephelometer). For the flight of July 1, the wind came from north-easterly directions, so that the air masses have been transported across central Europe (Belgium, Netherlands) before sampling.
FIG. 14 48 h backward trajectories, calculated with HYSPLIT, end point Paris, 800 m above ground. End times: 6:00, 9:00, 12:00, 15:00, and 18:00 (UTC) for each flight day.
All flights have been performed during afternoon hours. Except for one vertical profile at the outermost turning point of the flight track from 60 m to 3000 m above sea level (asl) all flights took place entirely within the boundary layer at constant 600 m asl. For aircraft operation the ablation laser was optimized for a trigger frequency of 1 Hz, and therefore the blind time for the detection lasers has been set to 500 ms, allowing a maximum trigger frequency of 2 Hz. During the entire campaign ALABAMA acquired 6502 single particle mass spectra and a maximum of 1500 spectra within a single 4 h flight. The recorded mass spectra contain only positive ion signals due to technical problems with the high voltage supply for the other polarity.
4.3. Classification of the Measured Particle Spectra
For further investigations particle spectra were classified into clusters to gain insight into the composition and abundance of certain particle types. The particles were categorized into eight major classes defined by the abundance of specific peaks following the observed particle classes reported by Hinz et al. (2006) and Froyd et al. (Citation2009). This procedure did not use a hierarchical cluster algorithm as used for example by Murphy et al. (Citation2003) or Zelenyuk et al. (Citation2006). The eight classes are listed in including their characteristic ion signals. The spectra have been sorted into the categories given in by stepwise looking for specific peaks. The peaks that were used as criterion for each class are marked in and correspondingly the eight classes of are described as follows:
| 1. | The first class “lead ” is given by particles containing lead (206Pb+, 207Pb+, 208Pb+), which is mostly associated with anthropogenic sources (Murphy et al. Citation2007b) but is also found on sea salt or mineral dust particles and can play a role for ice cloud nucleation (Cziczo et al. Citation2009). FIG. 15 Typical single particle mass spectra for the eight major particle classes. Peaks used for the classification are marked. 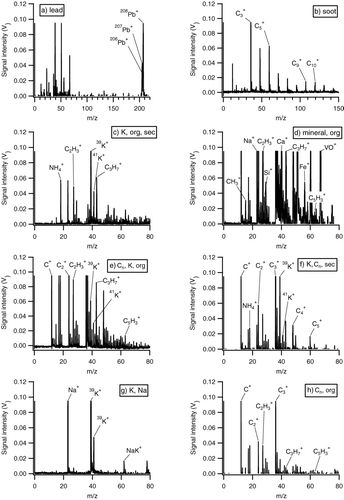 TABLE 1 Characteristic peaks for the eight identified particle classes | ||||
| 2. | The second class “EC/soot” is dominated by the typical peaks from elemental carbon clusters (C+ n), therefore particles in this class were identified as elemental carbon (soot) particles. Only spectra not containing potassium peaks were attributed to this class. | ||||
| 3. | The third class “potassium, organic, secondary” is characterized by particles containing signatures from potassium (39K+, 41K+) and various hydrocarbon CnH+ n compounds, especially m/z 27 (C2H+ 3), m/z 43 (C3H+ 7) and m/z 63 (C5H+ 3). Also frequently observed here are signals from ammonium at m/z 18 (NH+ 4) which was used as a tracer for secondary inorganic compounds such as ammonium nitrate and ammonium sulfate (Hinz et al. 2006). Particle spectra containing C+ n and Na+ signals were not added to this class. | ||||
| 4. | The fourth class “mineral, organic” consists of particle spectra containing additionally to the organic markers typical mineral markers, such as m/z 28 (Si+), m/z 40 (Ca+), m/z 51 (V+), and m/z 56 (Fe+) (Hinz et al. 2006). However, Ca+ and V+ might also be markers for ship exhaust or fuel oil combustion (Ault et al. Citation2010). | ||||
| 5. | The fifth class “Cn, potassium, organic” contains particle spectra with signals from potassium and organics but unlike spectra in class 3, the spectra also show signals from carbon clusters (C+ n). | ||||
| 6. | The sixth class “potassium, Cn, secondary” shows high signals of potassium, from carbon clusters (C+ n) but also ammonium as a marker for secondary particles. Only spectra without the Na+ peak were added to this class. | ||||
| 7. | The seventh class “potassium, sodium” of particles is dominated by sodium (Na+, m/z 23) and potassium signals. This class is mostly related to particles from biomass and biofuel burning, which could be confirmed during sampling within the plume of a smaller wood fire where mostly particle spectra of this type have been acquired. | ||||
| 8. | Most of the particles that were left over after sorting into these seven classes are comprehended into class eight “Cn, organic,” which contains particle spectra showing signals form carbon clusters and organic markers. | ||||
The classes 1, 2, and 7 can be attributed to anthropogenic emissions. The particles in the classes 3, 4, 5, and 8, all containing organic material, can be due to anthropogenic and natural emissions. Secondary inorganic compounds (class 3 and 6) may also have anthropogenic and natural sources. The elemental carbon (Cn)-containing classes 5, 6, and 8 indicate that a primary emitted component (soot) is internally mixed with other material which can be also of primary origin (classes 5 and 8) or of secondary origin (class 6). With this classification scheme about 90% of the single particle spectra could be allocated into one of the 8 classes of particles. After this there still were some unclassified spectra—mostly with very low ion signals—which then were categorized as “others.” shows one typical single particle mass spectrum for each of the 8 classes described above. The classification method described has been applied to all data acquired on days where the pollution plume has been successfully sampled and ALABAMA ablated more than 100 particles. For the subsequent analysis only spectra that have been sampled downwind of the city and within the boundary layer have been considered. This includes 7 flights and a total of 3868 single particle spectra. Closer inspection of the spectra within the eight pre-defined particle classes shows that numerous peaks are usually only present in a subset of the spectra of a class. This extent of variability in peak occurrence is not surprising considering a slightly different composition of the particles within one class and especially the non-uniform ablation process, resulting in different fragmentations, even for identical particles.
4.4. Results of the Aircraft-Based Measurements and Discussion
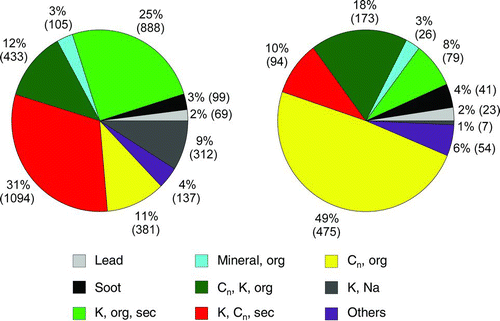
The 48 h backward trajectories displayed in show that one flight day is markedly different from the others: On July 1 (flight 1), the air masses arrived from the North-East, having crossed the industrialized regions of Belgium and the Netherlands, while on most of the other days, the air masses arrived from North-West, West, or South-West. These air masses have either traveled over the Atlantic or over the less densely populated South-Western parts of France. Thus it is to be expected that, except for the influence of the local Paris source, the particle properties between flight number 1 (July 1) and flights number 2 to number 11 are different.
shows the abundances of the particle classes for flight number 1 compared to all other flights. The two most abundant particle classes found during flights number 2 to11, the classes “K, org, sec” and “K, Cn, sec” are much less abundant in flight 1 when the air masses arrive from the opposite direction (i.e., from the North-East), and the most abundant particle type in flight 1 is “Cn, org.” The marker for “secondary” is, as described above, m/z 18 (NH+ 4), thus this marker is indicating inorganic secondary particle formation. Such particles appear to be less abundant in aged air masses originating from the industrialized regions in Belgium and the Netherlands, and particles of the class “Cn, org,” containing soot and organic compounds, dominate this air mass.
FIG. 16 Relative (and absolute) abundance of particle classes during all flights that sampled air from the Paris megacity area (left) and during the flight on July 1 when air masses arrived from North-East (right).
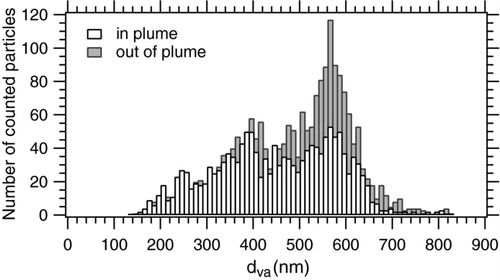
The data obtained during flights number 2 through 11 (i.e., those data where the Paris emission plume was embedded in relatively clean air masses, not strongly affected by continental pollution) were analyzed in more detail by subdividing the mass spectra by means of total particle number concentration (CPC) and particle absorption (PSAP) data into particles sampled inside and outside the city's pollution plume within the boundary layer. The size distributions of particles (absolute number of counted particles) that were by ALABAMA analyzed inside and outside the plume are shown in . A larger fraction of particles with vacuum aerodynamic diameters above 450 nm was measured outside the pollution plume, which suggests that a higher fraction of smaller, presumably freshly formed particles were present inside the plume.
To investigate the aerosol composition the spectra have been classified according to section 4.3. shows the composition of particles (in terms of particle classes) measured downwind of the city in the boundary layer, for all particles (left column), for particles measured inside (middle) and outside the plume (right column). Additionally, the particle composition is plotted separately for small (dva ⩽450 nm) and large (dva ⩾450 nm) particles, based on the bimodal structure of the size distribution displayed in . Except for minor differences, a higher fraction of particles containing potassium, Cn and secondary markers is observed outside the plume (41%, compared to 33% inside the plume), suggesting the major source for this particle class may be outside of the city. The particle classes dominated by Cn (“EC/soot,” “Cn, potassium, organic,” and “Cn, organics”) are more abundant inside the pollution plume (31%) than outside (22%) Thus, a general correlation between absorption and Cn containing particle is observed.
FIG. 18 Relative abundance of particle classes for flights sampling the Paris plume. Left: complete data set, middle: inside plume: right: outside plume. (a) all particle sizes, (b) d > 450 nm, (c) d < 450 nm.
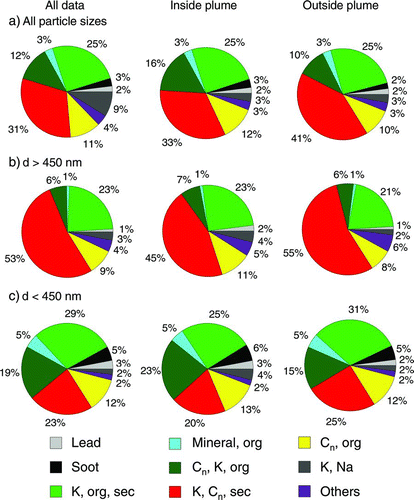
Stronger differences can be seen when comparing the composition of smaller particles to the composition of the larger particles. In the entire dataset, the fraction of particles containing potassium, Cn and secondary markers is much higher in the larger particles (52%) than in the smaller particles (23%). Particles containing Cn, potassium and organic markers are more frequent within the smaller particle fraction (19%) than amongst the larger particles (6%). Mineral and soot-containing particles are mostly (mineral) or only (soot) observed in the smaller particles. The characterization experiments presented in section 3 have shown that different particle types are detected and ablated with different efficiencies. These effects lead to significant uncertainties in relative abundances of the classified particles. For example, it was shown that NaCl particles have a very low ablation efficiency, and NaCl containing particles (that would have been an indication for sea salt) have not been observed, not even in the air masses that arrive across the Atlantic. On the other hand, this observation may also be due to the fact that sea salt particles are mainly found in the coarse mode. Reactions with HNO3 and H2SO4 that are known for sea salt particles could enhance the ablation efficiency for such particles, but this has to be investigated in more detail in laboratory measurements. Soot particle are detected with low efficiency, thus it is to expect that the ambient fraction of soot particles is higher than the detected fraction that is displayed in Figures and . However, the differences between different air masses that have been observed should not be affected by such particle composition dependent effects.
A more detailed analysis of this data set, including comparison to a ground-based single particle mass spectrometer, is beyond the scope of this work and will be presented in an upcoming publication.
5. Summary and Conclusions
We have presented the design, characterization, and first aircraft-borne field deployment of the laser ablation aerosol mass spectrometer named ALABAMA. It was shown that the instrument, one of the smallest and lightest of its type that currently exist, can be successfully operated under the challenging conditions of a research aircraft flight. These measurements are to our knowledge the first aircraft-based SPMS measurements in Europe. A comparison between the characteristic parameters of ALABAMA and those of other existing aircraft-based laser ablation aerosol mass spectrometers as PALMS (Thomson et al. Citation2000), A-ATOFMS (Pratt et al. Citation2009), and SPLAT-II (Zelenyuk et al. Citation2009a) is given in .
TABLE 2 Comparison between ALABAMA and other existing aircraft-based laser ablation aerosol mass spectrometers
The main advantages of ALABAMA are the small weight and size. Furthermore, ALABAMA offers the ability to detect bimodal mass spectra, a feature that among the other instruments is only provided by the A-ATOFMS. The weaknesses of ALABAMA are currently the relatively low particle ablation rate of 5 Hz (other instruments reach up to 50 Hz) and the limited particle size range of 150 to 900 nm. The ablation rate of the laser can easily be increased to 20 Hz by simple hardware reconfiguration. The lower size limit is given by the light scattering properties of the particles and can hardly be extended much further, while the upper size limit is given by the transmission function of the aerodynamic lens. Here an extension appears desirable, and there are lens designs available that transmit larger particles (Schreiner et al. Citation1998; Schreiner et al. 1999; Gaie-Levrel 2009). Such lens designs will be tested and if successful, implemented into the ALABAMA instrument.
The data evaluation procedures that have been used for the ALABAMA up to this point are fairly basic but sufficient for a first interpretation of the measurements of urban plumes. These are in the process of being refined, and comparisons to existing laser-ablation single particle instruments are planned. The results from the MEGAPOLI project have shown that the composition of the aerosol in terms of particle types in the Paris area is to a larger degree influenced by the air mass origin than by the measurement location in or out of the emission plume. The ALABAMA is now available for further aircraft deployments, especially for missions on the new research aircraft HALO, but is versatile enough for implementation on other platforms as well. Operation on fast aircraft as HALO will require a higher detection and ablation rate than during MEGAPOLI. Hardware reconfiguration of the ablation laser in order to allow 20 Hz repetition rate is intended, and higher detection rates can be achieved by lowering the blind time in the detection. In MEGAPOLI, the blind time was set to 500 ms, thereby allowing a maximum detection rate of 2 Hz. In the laboratory, detection rates of 14 Hz (blind time 70 ms) have been reached.
Acknowledgments
We thank the MEGAPOLI team, A. Schwarzenböck (Université Blaise Pascal, Aubière, France) for the CPC data, L. Gomes and T. Bourianne (Centre National de Recherches Meteorologiques, Toulouse, France) for the PSAP data, the SAFIRE team, W. Schneider (University Mainz), the electronic and mechanic workshops at MPIC (F. Helleis, J. Sody), and U. Rohner (TOFWERK AG, Thun, Switzerland). This work was supported by the Max Planck Society, the Earth System Science Research Centre “Geocycles,” the DFG SPP 1294 “HALO” (SCHN 1138/1-1), the junior research group AEROTROP, and the European Union's Seventh Framework Programme FP/2007–2011 under grant agreement no. 212520
REFERENCES
- Ault , A. P. , Gaston , C. J. , Wang , Y. , Dominguez , G. , Thiemens , M. H. and Prather , K. A. 2010 . Characterization of the Single Particle Mixing State of Individual Ship Plume Events Measured at the Port of Los Angeles . Environ. Sci. Technol. , 44 : 1954 – 1961 .
- Bahreini , R. , Dunlea , E. J. , Matthew , B. M. , Simons , C. , Docherty , K. S. , DeCarlo , P. F. , Jimenez , J. L. , Brock , C. A. and Middlebrook , A. M. 2008 . Design and Operation of a Pressure-Controlled Inlet for Airborne Sampling with an Aerodynamic Aerosol Lens . Aerosol Sci. Technol. , 42 : 465 – 471 .
- Canagaratna , M. R. , Jayne , J. T. , Jimenez , J. L. , Allan , J. D. , Alfarra , M. R. , Zhang , Q. , Onasch , T. B. , Drewnick , F. , Coe , H. , Middlebrook , A. , Delia , A. , Williams , L. R. , Trimborn , A. M. , Northway , M. J. , DeCarlo , P. F. , Kolb , C. E. , Davidovits , P. and Worsnop , D. R. 2007 . Chemical and Microphysical Characterization of Ambient Aerosols with the Aerodyne Aerosol Mass Spectrometer . Mass Spectrom. Rev. , 26 : 185 – 222 .
- Cross , E. S. , Onasch , T. B. , Canagaratna , M. , Jayne , J. T. , Kimmel , J. , Yu , X. Y. , Alexander , M. L. , Worsnop , D. R. and Davidovits , P. 2009 . Single Particle Characterization Using a Light Scattering Module Coupled To a Time-of-Flight Aerosol Mass Spectrometer . Atmospheric Chemistry and Physics , 9 : 7769 – 7793 .
- Cross , E. S. , Slowik , J. G. , Davidovits , P. , Allan , J. D. , Worsnop , D. R. , Jayne , J. T. , Lewis , D. K. , Canagaratna , M. and Onasch , T. B. 2007 . Laboratory and Ambient Particle Density Determinations Using Light Scattering in Conjunction with Aerosol Mass Spectrometry . Aerosol Sci. Technol. , 41 : 343 – 359 .
- Cziczo , D. J. , Stetzer , O. , Worringen , A. , Ebert , M. , Weinbruch , S. , Kamphus , M. , Gallavardin , S. J. , Curtius , J. , Borrmann , S. , Froyd , K. D. , Mertes , S. , Mohler , O. and Lohmann , U. 2009 . Inadvertent Climate Modification Due to Anthropogenic Lead . Nature Geoscience , 2 : 333 – 336 .
- Dall'Osto , M. , Harrison , R. M. , Coe , H. , Williams , P. I. and Allan , J. D. 2009 . Real Time Chemical Characterization of Local And Regional Nitrate Aerosols . Atmos. Chem. Phys. , 9 : 3709 – 3720 .
- DeCarlo , P. F. , Slowik , J. G. , Worsnop , D. R. , Davidovits , P. and Jimenez , J. L. 2004 . Particle Morphology and Density Characterization by Combined Mobility and Aerodynamic Diameter Measurements. Part 1: Theory . Aerosol Sci. Technol. , 38 : 1185 – 1205 .
- Draxler , R. R. and Rolph , G. D. 2010 . HYSPLIT (HYbrid Single-Particle Lagrangian Integrated Trajectory) Model Access via NOAA ARL READY , MD : NOAA Air Resources Laboratory, Silver Spring . Website (http://ready.arl.noaa.gov/HYSPLIT.php)
- Drewnick , F. , Hings , S. S. , DeCarlo , P. , Jayne , J. T. , Gonin , M. , Fuhrer , K. , Weimer , S. , Jimenez , J. L. , Demerjian , K. L. , Borrmann , S. and Worsnop , D. R. 2005 . A New Time–Of–Flight Aerosol Mass Spectrometer (Tof-Ams)—Instrument Description and First Field Deployment . Aerosol Sci. Technol. , 39 : 637 – 658 .
- Erdmann , N. , Dell'Acqua , A. , Cavalli , P. , Gruning , C. , Omenetto , N. , Putaud , J. P. , Raes , F. and Van Dingenen , R. 2005 . Instrument Characterization and First Application of the Single Particle Analysis and Sizing System (SPASS) for Atmospheric Aerosols . Aerosol Sci. Technol. , 39 : 377 – 393 .
- Froyd , K. D. , Murphy , D. M. , Sanford , T. J. , Thomson , D. S. , Wilson , J. C. , Pfister , L. and Lait , L. 2009 . Aerosol Composition of the Tropical Upper Troposphere . Atmospheric Chemistry and Physics , 9 : 4363 – 4385 .
- Gaie–Levrel , F. 2009 . Développement d'un Instrument d'Analyse Physico-Chimique en Temps réel pour l'étude de la Fraction Organique de l'Aérosol Atmosphérique: SPLAM—Single Particle Laser Ablation Mass Spectrometry, Ph.D. thesis (in French) , Paris : Université Paris Diderot .
- Gard , E. , Mayer , J. E. , Morrical , B. D. , Dienes , T. , Fergenson , D. P. and Prather , K. A. 1997 . Real-time Analysis of Individual Atmospheric Aerosol Particles: Design and Performance of a Portable ATOFMS . Anal. Chem. , 69 : 4083 – 4091 .
- Hinz , K. P. , Erdmann , N. , Gruning , C. and Spengler , B. 2006 . Comparative Parallel Characterization of Particle Populations with Two Mass Spectrometric Systems LAMPAS 2 and SPASS . Int. J. Mass Spectrom. , 258 : 151 – 166 .
- Hinz , K. P. , Kaufmann , R. and Spengler , B. 1994 . Laser-Induced Mass Analysis of Single Particles in the Airborne State . Anal. Chem. , 66 : 2071 – 2076 .
- Huffman , J. A. , Jayne , J. T. , Drewnick , F. , Aiken , A. C. , Onasch , T. , Worsnop , D. R. and Jimenez , J. L. 2005 . Design, Modeling, Optimization, and Experimental Tests of a Particle Beam Width Probe for the Aerodyne Aerosol Mass Spectrometer . Aerosol Sci. Technol. , 39 : 1143 – 1163 .
- Jayne , J. T. , Leard , D. C. , Zhang , X. F. , Davidovits , P. , Smith , K. A. , Kolb , C. E. and Worsnop , D. R. 2000 . Development of an Aerosol Mass Spectrometer for Size and Composition Analysis of Submicron Particles . Aerosol Sci. Technol. , 33 : 49 – 70 .
- Jimenez , J. L. , Bahreini , R. , Cocker , D. R. , Zhuang , H. , Varutbangkul , V. , Flagan , R. C. , Seinfeld , J. H. , O'Dowd , C. D. and Hoffmann , T. 2003 . New Particle Formation from Photooxidation of Diiodomethane (CH2I2) . J. Geophys. Res. , 108 : 4318
- Johnston , M. V. and Wexler , A. S. 1995 . MS of Individual Aerosol Particles . Anal. Chem. , 67 : A721 – A726 .
- Kamphus , M. , Ettner-Mahl , M. , Brands , M. , Curtius , J. , Drewnick , F. and Borrmann , S. 2008 . Comparison of Two Aerodynamic Lenses as an Inlet for a Single Particle Laser Ablation Mass Spectrometer . Aerosol Sci. Technol. , 42 : 970 – 980 .
- Laursen , K. K. , Jorgensen , D. P. , Brasseur , G. P. , Ustin , S. L. and Huning , J. R. 2006 . HIAPER: The Next Generation NSF/NCAR Research Aircraft . Bulletin of the American Meteorological Society , 87 : 896 – 909 .
- Liu , D. Y. , Prather , K. A. and Hering , S. V. 2000 . Variations in the Size And Chemical Composition of Nitrate-Containing Particles in Riverside, CA . Aerosol Sci. Technol. , 33 : 71 – 86 .
- Liu , P. , Ziemann , P. J. , Kittelson , D. B. and McMurry , P. H. 1995a . Generating Particle Beams of Controlled Dimensions And Divergence: 1. Theory of Particle Motion in Aerodynamic Lenses and Nozzle Expansions . Aerosol Sci. Technol. , 22 : 293 – 313 .
- Liu , P. , Ziemann , P. J. , Kittelson , D. B. and McMurry , P. H. 1995b . Generating Particle Beams of Controlled Dimensions And Divergence: 2. Experimental Evaluation of Particle Motion in Aerodynamic Lenses and Nozzle Expansions . Aerosol Sci. Technol. , 22 : 314 – 324 .
- Liu , P. S. K. , Deng , R. , Smith , K. A. , Williams , L. R. , Jayne , J. T. , Canagaratna , M. R. , Moore , K. , Onasch , T. B. , Worsnop , D. R. and Deshler , T. 2007 . Transmission Efficiency of an Aerodynamic Focusing Lens System: Comparison of Model Calculations and Laboratory Measurements for the Aerodyne Aerosol Mass Spectrometer . Aerosol Sci. Technol. , 41 : 721 – 733 .
- Murphy , D. M. 2007 . The Design of Single Particle Laser Mass Spectrometers . Mass Spectrom. Rev. , 26 : 150 – 165 .
- Murphy , D. M. , Cziczo , D. J. , Hudson , P. K. and Thomson , D. S. 2007a . Carbonaceous Material in Aerosol Particles in the Lower Stratosphere and Tropopause Region . J. Geophys. Res.—Atmos. , 112
- Murphy , D. M. , Hudson , P. K. , Cziczo , D. J. , Gallavardin , S. , Froyd , K. D. , Johnston , M. V. , Middlebrook , A. M. , Reinard , M. S. , Thomson , D. S. , Thornberry , T. and Wexler , A. S. 2007b . Distribution of Lead in Single Atmospheric Particles . Atmospheric Chemistry and Physics , 7 : 3195 – 3210 .
- Murphy , D. M. , Middlebrook , A. M. and Warshawsky , M. 2003 . Cluster Analysis of Data from the Particle Analysis by Laser Mass Spectrometry (PALMS) Instrument . Aerosol Sci. Technol. , 37 : 382 – 391 .
- Murphy , D. M. and Thomson , D. S. 1995 . Laser Ionization Mass–Spectroscopy of Single Aerosol-Particles . Aerosol Sci. Technol. , 22 : 237 – 249 .
- Murphy , D. M. , Thomson , D. S. and Mahoney , T. M. J. 1998 . In Situ Measurements of Organics, Meteoritic Material, Mercury, and Other Elements in Aerosols at 5 to 19 Kilometers . Science , 282 : 1664 – 1669 .
- Prather , K. A. , Nordmeyer , T. and Salt , K. 1994 . Real-Time Characterization of Individual Aerosol-Particles Using Time-of-Flight Mass-Spectrometry . Anal. Chem. , 66 : 1403 – 1407 .
- Pratt , K. A. , Mayer , J. E. , Holecek , J. C. , Moffet , R. C. , Sanchez , R. O. , Rebotier , T. P. , Furutani , H. , Gonin , M. , Fuhrer , K. , Su , Y. X. , Guazzotti , S. and Prather , K. A. 2009 . Development and Characterization of an Aircraft Aerosol Time-of-Flight Mass Spectrometer . Anal. Chem. , 81 : 1792 – 1800 .
- Schnaiter , M. , Horvath , H. , Mohler , O. , Naumann , K. H. , Saathoff , H. and Schock , O. W. 2003 . UV-VIS-NIR Spectral Optical Properties of Soot and Soot-Containing Aerosols . J. Aerosol. Sci. , 34 : 1421 – 1444 .
- Schneider , J. , Weimer , S. , Drewnick , F. , Borrmann , S. , Helas , G. , Gwaze , P. , Schmid , O. , Andreae , M. O. and Kirchner , U. 2006 . Mass Spectrometric Analysis and Aerodynamic Properties of Various Types of Combustion-Related Aerosol Particles . . Int. J. Mass Spectrom. , 258 : 37 – 49 .
- Schreiner , J. , Schild , U. , Voigt , C. and Mauersberger , K. 1999 . Focusing of Aerosols Into a Particle Beam at Pressures from 10 to 150 Torr . Aerosol Sci. Technol. , 31 : 373 – 382 .
- Schreiner , J. , Voigt , C. , Mauersberger , K. , McMurry , P. and Ziemann , P. 1998 . Aerodynamic Lens System for Producing Particle Beams at Stratospheric Pressures . Aerosol Sci. Technol. , 29 : 50 – 56 .
- Silva , P. J. and Prather , K. A. 2000 . Interpretation of Mass Spectra From Organic Compounds in Aerosol Time-of-Flight Mass Spectrometry . Anal. Chem. , 72 : 3553 – 3562 .
- Thomson , D. S. , Schein , M. E. and Murphy , D. M. 2000 . Particle Analysis by Laser Mass Spectrometry WB-57F Instrument Overview . Aerosol Sci. Technol. , 33 : 153 – 169 .
- Wiley , W. C. and McLaren , I. H. 1955 . Time-of-Flight Mass Spectrometer with Improved Resolution . Review of Scientific Instruments , 26 : 1150 – 1157 .
- Zelenyuk , A. and Imre , D. 2005 . Single Particle Laser Ablation Time-of-Flight Mass Spectrometer: An Introduction to SPLAT . Aerosol Sci. Technol. , 39 : 554 – 568 .
- Zelenyuk , A. , Imre , D. , Cai , Y. , Mueller , K. , Han , Y. P. and Imrich , P. 2006 . SpectraMiner, an Interactive Data Mining and Visualization Software for Single Particle Mass Spectroscopy: A Laboratory Test Case . Int. J. Mass Spectrom. , 258 : 58 – 73 .
- Zelenyuk , A. , Yang , J. , Choi , E. and Imre , D. 2009a . SPLAT II: An Aircraft Compatible, Ultra-Sensitive, High Precision Instrument for In-Situ Characterization of the Size and Composition of Fine and Ultrafine Particles . Aerosol Sci. Technol. , 43 : 411 – 424 .
- Zelenyuk , A. , Yang , J. , Imre , D. and Choi , E. 2009b . Achieving Size Independent Hit-Rate in Single Particle Mass Spectrometry . Aerosol Sci. Technol. , 43 : 305 – 310 .
