Abstract
Engineered nanoparticles possess unique properties that present potential health risks to the workers who manufacture them and to consumers who are directly or inadvertently exposed to them. Monitoring personal exposures to these materials is necessary to evaluate such potential risks. A thermal precipitator was designed to measure concentrations of airborne nanoparticles in the breathing zone of exposed individuals. Particle collection efficiency was evaluated at flow rates of 5 and 20 mL/min and for particle sizes ranging from 15 to 240 nm. Particle transmission efficiency (with the temperature gradient off) and uniformity of particle deposition across the collection surface were also evaluated. Particle collection efficiency ranged from 100% at 5 mL/min flow to approximately 50% at 20 mL/min. Particle collection was generally homogeneous near the center of the collection plate over a distance of approximately 2 mm. Particle collection was less uniform near the edges of the collection plate, with a tendency for increased deposition near the inlet and flow centerline.
[Supplementary materials are available for this article. Go to the publisher's online edition of Aerosol Science and Technology to view the free supplementary files.]
INTRODUCTION
As new nanotechnologies develop, there is a growing concern about the adverse health risks that engineered nanoparticles may pose to both humans and the environment (CitationMaynard et al. 2006; CitationWiesner et al. 2009). Engineered nanoparticles are materials designed on the molecular scale with at least one dimension measuring less than 100 nm. These particles often possess material properties that are enhanced due to their small size. Unfortunately, the same unique properties that make engineered nanoparticles so desirable also make them potentially dangerous (CitationMaynard et al. 2006; CitationThomas et al. 2006). Very little human exposure data exist for these particles, although they are known to enter the body through a number of routes (e.g., respiration, dermal penetrations, and ingestion). The health implications of inhaled nanoparticle exposures are a particularly important research area as the use of engineered nanoparticles is expected to increase dramatically (CitationGonzalez et al. 2005; CitationTsuji et al. 2006; CitationAzong-Wara et al. 2009), resulting in growing numbers of exposed individuals in both the manufacturing and consumer segments of the population. Nanoparticles may pose significant health concerns because their high surface to volume ratio makes them more reactive in biological systems (CitationTsuji et al. 2006). Once deposited in the respiratory tract, nanoparticles can also translocate between organ systems by virtue of their size (CitationNemmar et al. 2001; CitationOberdorster et al. 2002). For example, nanoparticles deposited in the nose have been shown to reach the brain directly via olfactory and trigeminal nerve axons (CitationOberdörster et al. 2004).
However, there is uncertainty surrounding the appropriate metric for characterizing inhaled nanoparticle exposures (i.e., whether particle size, surface area, or composition is the dominant factor in determining toxicity). Nanoparticles vary in size, shape, composition, charge, crystallinity, solubility, and impurities, with potential toxicities likely depending on a combination of factors (CitationSchulte et al. 2009). Engineered nanoparticles are typically generated monodisperse; however, human exposure can occur to both individual particles and their agglomerates. Current technologies for nanoparticle exposure assessment include methods to determine particle number concentration, particle size distribution (CitationLi et al. 2009), particle mass, particle surface area (CitationFissan et al. 2007), or a combination of these metrics (CitationBrouwer et al. 2004; CitationDemou et al. 2008; CitationPeters et al. 2009).
The issue of specificity (i.e., particle identification and source attribution) is critical for engineered nanoparticle exposure assessment, as both biogenic (i.e., naturally produced) and incidental (i.e., anthropogenic, nonengineered) nanoparticles, such as those from fossil-fuel combustion, are omnipresent in both indoor and outdoor air. Therefore, methods for engineered nanoparticle exposure assessment should also be capable of differentiating engineered nanoparticles from other aerosols that could potentially confound a measurement. Several studies have used scanning electron microscopy (SEM) and transmission electron microscopy (TEM) to image nanoparticles collected on a variety of substrates, allowing for characterization of various physiochemical particle characteristics (CitationGonzalez et al. 2005; CitationHandy et al. 2006; CitationHan et al. 2008; CitationPeters et al. 2009; CitationMiller et al. 2010). For example, CitationMiller et al. (2010) developed a handheld electrostatic precipitator to sample airborne nanoparticles onto an SEM substrate with 74%–94% efficiency. The advantage of electron microscopy is that it may be coupled to energy dispersive techniques (e.g., EELS, EDX) to identify particle composition, in addition to size, concentration, and shape.
The state-of-the-art for human exposure assessment to aerosol hazards calls for personal sampling, whereby measures are made within the breathing zone of an exposed individual (CitationVincent 1989). Personal sampling also accounts for spatial and temporal variation in an individual's exposure in ways that area monitoring cannot (CitationBrouwer et al. 2004). A personal sampler must be small, lightweight, and portable so that it may be mounted onto an individual without substantial hindrance. A personal sampler should also be sufficiently inexpensive to facilitate widespread use (CitationMaynard et al. 2006). With these considerations in mind, we developed a small thermal precipitator to deposit particles onto an electron microscopy grid, allowing for nanoparticle characterization and personal exposure assessment as a function of particle size, composition, and ultimately concentration.
EXPERIMENTAL METHODS
Prototype Design
Thermal precipitators use thermophoretic force generated from an applied temperature gradient (orthogonal to the aerosol flow) to separate particles from a moving airstream. The temperature gradient is typically created within a shallow flow channel, wherein one side is heated and the other side is cooled. Because of this gradient, gas molecules on one side of the particle have greater kinetic energy than those on the opposite side. Molecules on the hotter side transfer more net momentum per collision, resulting in a thermophoretic force on the particle in the direction of decreasing temperature gradient.
The thermophoretic velocity, Vth , for particles with diameters smaller than the gas mean free path (∼66 nm at room temperature and pressure) is independent of particle size and is estimated by
The prototype thermal precipitator measures 5.0 cm by 5.0 cm by 7.4 cm (L × W × H), weighs 222.4 g, and consumes approximately 7.2 W of power during normal operating conditions (). Power is supplied to the device using a rechargeable, 12-V lithium-ion battery and a custom, high-efficiency power circuit (Analog Devices, Inc., Fort Collins, CO). The battery (678 g) and controller (100 g) are connected to the device using a cat5e cable so that these heavier components can be worn on a belt (along with a personal sampling pump), while the sampler is mounted within the breathing zone ().
FIG. 1 Exploded diagram and photograph of the prototype thermophoretic aerosol sampler.
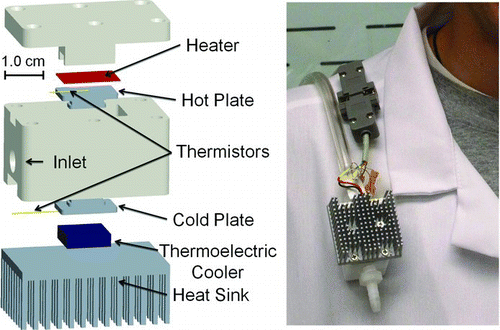
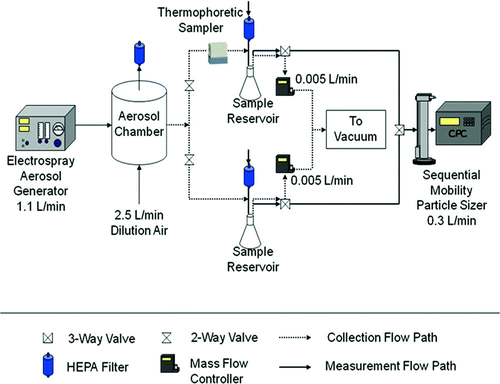
FIG. 2 Experimental setup for the collection efficiency tests.
The collection surface (i.e., the aluminum cold plate in , T = 12.2°C) measures 13 mm by 5 mm, and is cooled with a small, low-power thermoelectric cooler (TE Technology, Inc., Traverse City, MI). A hot plate (T = 122°C) of identical dimensions is located 1 mm above the cold plate and is heated with a 0.10 mm diameter Nichrome wire heater. This heater is insulated from other components with 0.0254 mm thick polyimide (Kapton) plastic adhesive sheets. The chamber inlet measures 5 mm wide by 1 mm high to match the plate width and separation distance, respectively. The 1-mm separation distance was chosen to maximize the temperature gradient while maintaining reasonable tolerances for machining and assembly of the components. The temperatures of the cold and hot plates are maintained via a programmable temperature controller (Analog Devices, Inc., Fort Collins, CO) in conjunction with two small thermistors. The hot plate temperature was constrained to 122°C for safety considerations. The cold plate temperature (12.2°C) was chosen to minimize condensation during a sampling event, while maximizing the temperature gradient (100°C/mm). A small heat sink dispersed heat generated by the thermoelectric cooler.
On the basis of Equation (1) and a flow rate of 5 mL/min, we estimated a path length of 8–10 mm required for a theoretical unit density particle entering the device at a height of 1 mm above the collection surface (the plate separation distance) to deposit (depending on the temperature used in Equation (1)) under a temperature gradient of 100°C/mm. Since the collection plate is 13 mm long, 100% collection efficiency was expected for the device at this flow rate. At a sample flow rate of 20 mL/min, the deposition distance will increase to 35–40 mm, resulting in a collection efficiency of around 35% (assuming a uniform particle concentration distribution across the inlet face). The Reynolds numbers (for both the particle and the flow) are laminar under these conditions. Nickel transmission electron microscope grids are held in place with an inlaid magnet on the cold plate.
Two other thermal precipitator designs have been reported in the literature for nanoparticle measurement. CitationAzong-Wara et al. (2009) developed and modeled a thermal precipitator that operated at 2 mL/min with a 15°C/mm temperature gradient at a spacing of 1 mm. Modeling results indicated that the deposition of particles should be uniform across the collection plate, reducing the number of images required to determine the ambient concentration. However, this design has yet to be evaluated in the laboratory to our knowledge. CitationLorenzo et al. (2007) developed and tested a device that operates at 2 L/min with a 400°C/mm temperature gradient at a plate spacing of 0.3 mm. These authors were able to reproduce the particle size distribution from TEM images with good agreement to existing size distribution measurement systems (i.e., electrical mobility sizing).
Collection Efficiency
To evaluate the performance of the thermal precipitator, a series of experiments were conducted to measure particle collection efficiency, particle transmission losses, and to determine the uniformity of particle deposition across the collection surface. The collection efficiency is defined as the percentage of particles entering the thermal precipitator that are collected while the temperature gradient is established. The transmission losses are defined as the percentage of particles entering the thermal precipitator that are collected while there is no temperature gradient (upper limit estimate of losses in the device due to particle diffusion and, to a lesser extent, settling). The particle deposition uniformity tests were conducted to determine the most representative location for electron microscopy analysis of collected particles. The setup used for these procedures is shown in .
Particle collection efficiency was calculated of the difference in particle concentration measured between two parallel sampling lines: one line containing the thermal precipitator and an identical line that served as a control. However, since typical reference instruments cannot operate at the low flow rate of the thermal precipitator (5 or 20 mL/min), a pair of 2 L delay reservoirs were placed immediately downstream of the parallel measurement lines (). These sample reservoirs were initially cleared of contaminating aerosol. Nanometer-sized, monodisperse test aerosols (dp < 100 nm) were created from a sucrose solution using an electrospray aerosol generator (TSI, Inc., Shoreview, MN). Larger test aerosols (dp > 100 nm) were generated using an atomized solution containing polystyrene latex (PSL) spheres (Duke Scientific Corp., Palo Alto, CA). Test aerosol was sent to a dilution chamber, mixed with dry air, and then directed into the two parallel sampling lines. These two lines were identical in length and kept as straight as possible to minimize particle losses. Initial tests without the thermal precipitator in line demonstrated that aerosol concentrations measured between the two parallel lines were within 10% of each other. The thermal precipitator was placed in line and immediately upstream of one reservoir, while the parallel line contained a second reservoir to act as a control. The precipitator was operated with the heated plate on top to minimize thermal convection; however, modeling studies of thermal precipitators have found that the orientation of the collection plates has minimal effect on instrument performance (CitationAzong-Wara et al. 2009). Aerosol flow to the sample reservoirs was applied with laboratory vacuum and regulated using mass flow controllers (Omega Engineering, Inc., Stanford, CT, USA). The variance in the measured flow rate was 20% at 5 mL/min and 1% at 20 mL/min. The reservoirs were filled for 3–5 h for PSL to generate sufficient concentrations for measurement. The electrospray generated very high concentrations of particles, so collection tests lasted as little as 20 min. After a sufficient sampling time, a sequential mobility particle sizer (SMPS, GRIMM Technology, Douglasville, GA, USA) was used to measure size-specific aerosol concentrations in each reservoir, with multiple measurements alternating between reservoirs. The collection efficiency of the thermal precipitator was calculated from the differential concentrations between the sample reservoirs. At least three replicate tests were conducted for each flow rate and particle size.
All statistical tests were conducted using Matlab software (The Mathworks, Inc., Natick, MA) with an assumed Type 1 error rate (alpha) of 0.05. Tukey's method for multiple comparisons among means was used to determine whether significant differences existed for particle collection efficiencies as a function of particle size. Confidence intervals for the difference in means for each pairwise comparison were calculated. Box-Cox tests were conducted on all data sets and data were log transformed, when necessary, to satisfy model assumptions of normality and homoscedasticity.
Transmission Efficiency
The collection efficiency test procedure was repeated with the device off to determine transmission losses within the thermal precipitator. These tests were conducted to establish a worst-case estimate for wall losses in the device due to particle diffusion (settling and inertial losses should be negligible at these sizes). For these tests, the mass flow controllers were replaced with critical flow orifices (Lenox Laser, Glen Arm, MD) that provided more precise control of the flow rate (10% variance). These orifices had a custom, laser cut diameter of 26 nm (actual values reported by the company were 27.20 and 26.92 nm), resulting in a measured flow rate of ∼6.7 mL/min. Since diffusional wall deposition would be reduced at higher flow rates, tests were not completed at 20 mL/min. Furthermore, only 15, 30, and 60 nm sizes were tested, since diffusion losses decrease dramatically with increasing particle size. As with the previous test, the average and standard deviation were calculated and plotted for the 6.7 mL/min flow rate data, and Tukey's tests were used to determine statistically significant differences.
Deposition Uniformity
A third set of tests was conducted to determine the uniformity of particle deposition across the surface of the collection plate. For these tests, the same procedure for the collection efficiency tests was used but the parallel sample reservoir was removed. Each test was conducted for 6 h, using a 0.1% salt solution aerosolized from a Collison nebulizer, which produced a polydisperse aerosol with an average count median diameter of 30.8 nm and an average geometric standard deviation of 2.0. Polydisperse aerosol was used so that all sizes could be analyzed with a single experiment to minimize the time required for SEM analysis. After particle collection, the cold plate was removed from the device and systematically imaged using a field-emission scanning electron microscope (JSM-6500F, JEOL, Inc., Peabody, MA). A series of ten SEM images was taken across the width of the collection plate at distances of 2, 3.75, 5.5, 7.25, and 9 mm downstream of the inlet (fifty images total). Deposition uniformity tests were repeated twice.
After imaging the particles under the SEM, the surface concentration of deposited particles on the collection plate was determined using ImageJ (CitationRasband 2009) software for three projected area diameter ranges: 20–50, 50–100, and 100–200 nm (see online supplemental information). Measured surface concentrations of deposited particles (i.e., the number of particles counted in a given image) were normalized to the average number of particles per image counted across the entire plate. This normalization step allowed data from replicate experimental runs to be pooled. Particle deposition uniformity (i.e., the percent deviation from the number of particles in a given image compared with the mean number of particles depositing to all regions of the plate) was calculated at each location. A contour plot was constructed to visualize the uniformity of deposited particle surface concentration as a function of the collection plate region and particle size. Additionally, deposition reproducibility (i.e., whether these uniformity tests were reproducible) was evaluated though multiple repeat tests.
RESULTS AND DISCUSSION
Collection Efficiency
Particle collection efficiencies as a function of particle diameter for flow rates of 5, 20, and 6.7 mL/min (the latter with zero temperature gradient) are presented in . Each point represents the average collection efficiency for three repetitions at each size and flow rate. Error bars represent one standard deviation. When the thermal precipitator was operated at a flow rate of 5 mL/min, the average collection efficiency for each of the four particle sizes was greater than 99%, with standard deviations less than 1%. This result was expected since the precipitator was designed to collect all particle sizes with 100% efficiency at 5 mL/min. Differences in the length of time of the collection phase of testing had no effect on the collection efficiency for each particle size. Furthermore, there were no significant differences in the collection efficiencies among the various particle sizes (p = 0.72). This result was also expected, since the thermophoretic velocity is nearly independent of particle size for diameters less than 100 nm. These results verify that the thermal precipitator is effective at capturing particles from 15 to 240 nm in diameter. Higher collection efficiencies support a more precise exposure assessment by reducing the uncertainty associated with calculating breathing-zone concentrations of airborne nanoparticles.
FIG. 3 Measured collection efficiency as a function of particle size, flow rate, and applied temperature gradient (device on vs. off). Error bars represent one standard deviation.
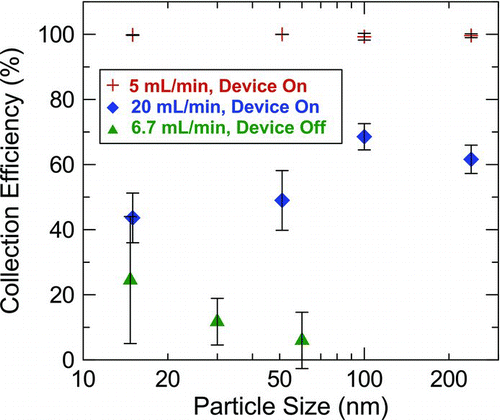
The total number of particles collected scales with the product of flow rate and collection efficiency; therefore, higher flow rates may be desired, especially if method sensitivity is important. Thus, the collection efficiency at 20 mL/min flow rate was also investigated. The observed collection efficiencies were reduced by up to a factor of 2 with the 100 nm collection efficiency significantly larger than that for the 15 and 51 nm particles (p = 0.012). It is unclear why the collection efficiency is larger for the 100 nm particles than for the smaller particles, as this goes against theory. Reduced particle collection with increased flow was expected. The measured collection efficiency data also had greater variability, and hence greater uncertainty. Therefore, the precipitator is less precise when operated at higher flow rates.
Decreased collection efficiency at an increased flow rate likely resulted from the increase in air velocity and a decrease in residence time for the particles within the collection chamber. As flow rate increases, particles entering the collection chamber have less time to migrate to the collection surface before exiting with the flow at the rear of the chamber. If lower concentrations are anticipated during measurement, the flow rate can be increased (to increase sensitivity, i.e., twice the number of particles would be collected by increasing the flow rate from 5 to 20 mL/min over a given sampling duration, after accounting for a ∼50% reduction in collection efficiency at the higher flow rate) and correction factors can account for the inefficiency of the thermal precipitator. However, at a higher flow rate, only relatively large differences in the concentration are likely to be detected, due to increased uncertainty in particle collection efficiency. Higher flow rates may also be desirable for ease of operation of the thermal precipitator. A wider variety of pumps are available at 20 mL/min and greater flow rates, and since the thermal precipitator is intended to be worn as a personal sampler, a small pump that supplies a reliable flow rate is critical to reconstruct personal exposures accurately.
Transmission Efficiency
Particle collection efficiencies at 6.7 mL/min with the device turned off are also shown in . Without an applied temperature gradient, particle collection was highly variable, yet generally less than 25%. This value represents an upper limit to the losses within the thermal precipitator because these collection efficiencies include diffusional deposition onto the lower plate, which is the desired collection surface. Further, since thermophoresis is a special form of Brownian motion, in which the overall “random” motion from air molecule collisions is directed down the temperature gradient, particles entering near the hot plate would be immediately directed toward the cold plate, reducing the overall losses in the instrument. Aerosol diffusion losses tend to decrease with increasing particle size, since smaller particles are more affected by Brownian motion than larger ones. The losses within the chamber were approximately 25% for very small nanoparticles, but rapidly decrease to relatively low levels (less than 10% of the collection efficiency at a 6.7 mL/min flow rate) for larger particles. However, due to the variability in the data, no significant differences were detected in transmission efficiency as a function of particle size (p = 0.28). The increased variability associated with these transmission losses was likely an artifact of using delay reservoirs. The particle concentrations in the reservoirs decrease exponentially as the aerosol is sampled, and because only one SMPS was used, the two reservoirs could not be sampled simultaneously.
Deposition Uniformity
The uniformity of particle deposition across the collection surface, represented as the relative surface concentration of deposited particles, is shown in . Depicted in the figure are relative particle counts (i.e., the number of particles deposited per unit surface area divided by the average number of particles per unit surface area counted across the entire plate). For example, the white contours represent the locations where the deposited particle surface concentration was equal to the average concentration across the plate. Darker contours indicate areas of increased surface deposition; hatched contours represent areas of decreased surface deposition. The median difference in surface deposition concentration was less than 30% (for any given location) among replicate tests.
FIG. 4 Uniformity and relative levels of particle deposition across the collection surface as a function of particle size. Solid and hatched contours represent positive and negative percent deviations from the average surface count (deposited particles/unit area), respectively (white contours represent locations of average surface counts). The x- and y-axes define the area of the particle collection plate, as shown in the inset. Each image represents an average of three tests.
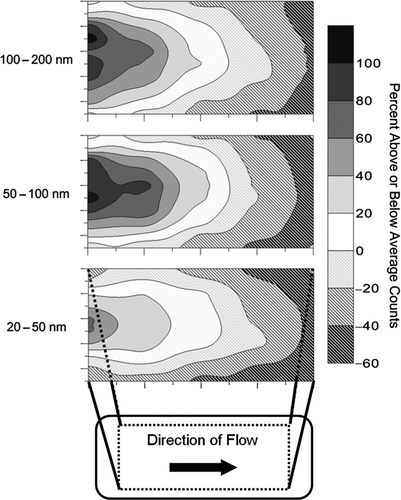
Collected particles were distributed most densely at the entrance and along the centerline of the collection plate for all three size ranges (). The increase in particle counts along the centerline contrasts with data reported by CitationLorenzo et al. (2007), who found that particles were concentrated at the edges of the collection plate. They attributed this to the parabolic flow profile established in the chamber. However, our design flow rate is about 2% of the flow rate used in their studies, so that even particles moving at a higher velocity along the flow centerline have sufficient time to collect. Instead, the increase in particle deposition along the flow centerline may result from a nonuniform temperature gradient in our device. Heat transfer at the boundary between the aluminum plates and the PTFE walls could cause the temperature gradient to decrease away from the center of the plate, which would result in a lower thermophoretic velocity at the chamber edges. The reason for the increased particle deposition near the entrance of the collection chamber is not clear. However, this finding correlates with the greater-than-predicted collection efficiency observed at 20 mL/min.
The relative standard deviation of particle deposition to any location on the cold plate was less than 30% for all three particle sizes, indicating that the relative flux of particles to a given area of the collection plate, although variable, is somewhat repeatable. Therefore, the location of an electron microscopy grid on the collection plate should be chosen based on the measurement need. For example, a TEM grid placed in the center of the collection plate will provide a sample containing approximately the average number of deposited particles per unit surface area over the entire plate. TEM analysis of these grids would provide the best estimate of the true number of sampled particles for exposure assessment. However, a TEM grid placed closer to the inlet of the device would collect more particles (as seen in ), if increased sensitivity is desired.
CONCLUSIONS AND FUTURE WORK
Personal samplers are needed to estimate human exposure and for use in toxicological studies focusing on inhaled nanoparticles. A personal thermal precipitator was designed and tested to meet this need. Three experiments were conducted to test the performance of the thermal precipitator. Design calculations were verified with experimental collection efficiencies near 100% for test aerosols with 15, 51, 100, and 240 nm diameters. The test was repeated at a flow rate of 20 mL/min to determine the decrease in collection efficiency for a higher flow rate. Increasing the flow rate by a factor of 4 decreased particle collection efficiency by approximately a factor of 2. However, the thermal precipitator's precision decreased dramatically with an increase in flow rate for the 20 mL/min flow rate. Diffusion losses were estimated and measured while the device was turned off (transmission efficiency), so that correction factors could be developed to account for particle losses during sampling.
Particles collected onto the cold plate were also analyzed to determine the homogeneity of collection across the cold plate by using SEM and imaging software. Particle collection was generally homogeneous across the center of the collection plate over a distance of approximately 2 mm. This area also coincides with the location where the average number of particles per image was obtained, which represents the ideal location for the placement of a TEM grid. Future testing should be carried out in the field in less controlled environments. Such studies can verify that the thermal precipitator coupled with TEM imaging can be used to distinguish between engineered and incidental nanoparticles and to determine limits of detection for chemical analyses.
Correction factors must also be determined to reconstruct the actual sampled aerosol concentrations from the particle counts obtained from electron microscopy analysis. Calculations using the known flow rate and particle counts from electron microscope images can provide an estimated reconstruction of the concentration measured by the thermophoretic sampler. The calculation results can be compared to the known concentration entering the device to infer a correction factor to account for losses within the device. This is an area for future research. Additionally, a suitable pump for personal aerosol sampling should be evaluated to ensure that the proper flow rate can be maintained in the field.
Currently, no standard method exists to characterize personal exposure to engineered nanoparticles, but this technique may provide a feasible option. Impaction is commonly used for aerosol sampling, but low-pressure methods are necessary to collect nanoparticles, which are not feasible for personal sampling. The National Institute of Occupational Safety and Health (NIOSH) has suggested that nanoparticles can be captured onto a filter and analyzed by following the Nanoparticle Emission Assessment Technique (CitationHodson 2009). However, filters may not be reliable for exposure reconstruction (when imaging methods are used to count and size collected particles) as nanoparticles can penetrate deep into the filter matrix—making quantitative exposure assessment difficult. Even when membrane filters (i.e., Nuclepore) are used, surface collection efficiencies are less than 55% for particles smaller than 100 nm, which collect deep within the filter pore (CitationCyrs et al. 2010).
uast_a_558943_sup_17556751.zip
Download Zip (402.7 KB)Acknowledgments
The authors wish to thank Chris Morrison and Adam Hutchinson for their assistance with prototype fabrication. This research was funded by grant no. OH009381 from the National Institute for Occupational Safety and Health.
REFERENCES
- Azong-Wara , N. , Asbach , C. , Stahlmecke , B. , Fissan , H. , Kaminski , H. , Plitzko , S. and Kuhlbusch , T. A. J. 2009 . Optimisation of a Thermophoretic Personal Sampler for Nanoparticle Exposure Studies . J. Nanopart. Res. , 11 ( 7 ) : 1611 – 1624 .
- Brouwer , D. H. , Gijsbers , J. H. J. and Lurvink , M. W. M. 2004 . Personal Exposure to Ultrafine Particles in the Workplace: Exploring Sampling Techniques and Strategies . Ann. Occup. Hyg. , 48 ( 5 ) : 439 – 453 .
- Cohen , B. S. and Mcammon , C. S. , eds. 2001 . Air Sampling Instruments , 9th ed , Cincinnati, OH : American Conference of Governmental Industrial Hygienists .
- Cyrs , W. D. , Boysen , D. A. , Casuccio , G. , Lersch , T. and Peters , T. M. 2010 . Nanoparticle Collection Efficiency of Capillary Pore Membrane Filters . J. Aerosol Sci. , 41 ( 7 ) : 655 – 664 .
- Demou , E. , Peter , P. and Hellweg , S. 2008 . Exposure to Manufactured Nanostructured Particles in an Industrial Pilot Plant . Ann. Occup. Hyg. , 52 ( 8 ) : 695 – 706 .
- Fissan , H. , Neumann , S. , Trampe , A. , Pui , D. and Shin , W. 2007 . Rationale and Principle of an Instrument Measuring Lung Deposited Nanoparticle Surface Area . J. Nanopart. Res. , 9 ( 1 ) : 53 – 59 .
- Gonzalez , D. , Nasibulin , A. G. , Baklanov , A. M. , Shandakov , S. D. , Brown , D. P. , Queipo , P. and Kauppinen , E. I. 2005 . A New Thermophoretic Precipitator for Collection of Nanometer-Sized Aerosol Particles . Aerosol Sci. Technol. , 39 ( 11 ) : 1064 – 1071 .
- Han , J. H. , Lee , E. J. , Lee , J. H. , So , K. P. , Lee , Y. H. , Bai , G. N. , Lee , S. B. , Ji , J. H. , Cho , M. H. and Yu , I. J. 2008 . Monitoring Multiwalled Carbon Nanotube Exposure in Carbon Nanotube Research Facility . Inhal. Toxicol. , 20 ( 8 ) : 741 – 749 .
- Handy , R. G. , Jackson , M. J. , Robinson , G. M. and Lafreniere , M. D. 2006 . The Measurement of Ultrafine Particles: A Pilot Study Using a Portable Particle Counting Technique to Measure Generated Particles during a Micromachining Process . J. Mater. Eng. Perform. , 15 ( 2 ) : 172 – 177 .
- Hodson , L. 2009 . Demonstration of the Nanoparticle Emission Assessment Technique (NEAT) Used by Niosh for Identifying Sources and Releases of Engineered Nanoparticles . Retrieved 12 July 2010, from http://www.mass.gov/dep/toxics/stypes/hodson_dem.pdf
- Li , L. , Chen , D.-R. and Tsai , P.-J. 2009 . Use of an Electrical Aerosol Detector (EAD) for Nanoparticle Size Distribution Measurement . J. Nanopart. Res. , 11 ( 1 ) : 111 – 120 .
- Lorenzo , R. , Kaegi , R. , Gehrig , R. , Scherrer , L. , Grobety , B. and Burtscher , H. 2007 . A Thermophoretic Precipitator for the Representative Collection of Atmospheric Ultrafine Particles for Microscopic Analysis . Aerosol Sci. Technol. , 41 ( 10 ) : 934 – 943 .
- Maynard , A. D. , Aitken , R. J. , Colvin , V. L. , Donaldson , K. , Oberdorster , G. , Philbert , M. A. , Ryan , J. , Seaton , A. , Stone , V. , Tinkle , S. S. , Tran , L. , Walker , N. J. and Warheit , D. B. 2006 . Safe Handling of Nanotechnology . Nature , 444 ( 7117 ) : 267 – 269 .
- Miller , A. , Frey , G. , King , G. and Sunderman , C. 2010 . A Handheld Electrostatic Precipitator for Sampling Airborne Particles and Nanoparticles . Aerosol Sci. Technol. , 44 ( 6 ) : 417 – 427 .
- Nemmar , A. , Vanbilloen , H. , Hoylaerts , M. F. , Hoet , P. H. M. , Verbruggen , A. and Nemery , B. 2001 . Passage of Intratracheally Instilled Ultrafine Particles from the Lung into the Systemic Circulation in Hamster . Am. J. Respir. Crit. Care Med. , 164 ( 9 ) : 1665 – 1668 .
- Oberdorster , G. , Sharp , Z. , Atudorei , V. , Elder , A. , Gelein , R. , Kreyling , W. and Cox , C. 2002 . Extrapulmonary Translocation of Ultrafine Carbon Particle Following Whole-Body Inhalation Exposure of Rats . J. Tox. Env. Health. A. , V65 ( 20 ) : 1531
- Oberdörster , G. , Sharp , Z. , Atudorei , V. , Elder , A. , Gelein , R. , Lunts , A. , Kreyling , W. and Cox , C. 2004 . Translocation of Inhaled Ultrafine Particles to the Brain . Inhal. Toxicol. , 16 ( 6–7 ) : 437 – 445 .
- Peters , T. M. , Elzey , S. , Johnson , R. , Park , H. , Grassian , V. H. , Maher , T. and Shaughnessay , P. O. 2009 . Airborne Monitoring to Distinguish Engineered Nanomaterials from Incidental Particles for Environmental Health and Safety . J. Occup. Environ. Hyg. , 6 ( 2 ) : 73 – 81 .
- Rasband , W. S. 2009 . Imagej , Bethesda, MD : US National Institutes of Health . Retrieved from http://rsb.info.nih.gov/ij/ (Accessed 11 January 2011).
- Schulte , P. A. , Schubauer-Berigan , M. K. , Mayweather , C. , Geraci , C. L. , Zumwalde , R. and McKernan , J. L. 2009 . Issues in the Development of Epidemiologic Studies of Workers Exposed to Engineered Nanoparticles . J. Occup. Environ. Med. , 51 ( 3 ) : 323
- Thomas , K. , Aguar , P. , Kawasaki , H. , Morris , J. , Nakanishi , J. and Savage , N. 2006 . Research Strategies for Safety Evaluation of Nanomaterials. Part VIII: International Efforts to Develop Risk-Based Safety Evaluations for Nanomaterials . Toxicol. Sci. , 92 ( 1 ) : 23
- Tsuji , J. S. , Maynard , A. D. , Howard , P. C. , James , J. T. , Lam , C.-W. , Warheit , D. B. and Santamaria , A. B. 2006 . Research Strategies for Safety Evaluation of Nanomaterials. Part IV: Risk Assessment of Nanoparticles . Toxicol. Sci. , 89 ( 1 ) : 42
- Vincent , J. H. 1989 . Aerosol Sampling: Science and Practice , New York : John Wiley & Sons .
- Waldmann , L. and Schmitt , K. H. 1966 . Thermophoresis and Diffusiophoresis of Aerosols, in Aerosol Science , Edited by: Davies , C. N. London : Academic Press .
- Wiesner , M. R. , Lowry , G. V. , Jones , K. L. , Hochella , M. F. Jr. , Di Giulio , R. T. , Casman , E. and Bernhardt , E. S. 2009 . Decreasing Uncertainties in Assessing Environmental Exposure, Risk, and Ecological Implications of Nanomaterials . Environ. Sci. Technol. , 43 ( 17 ) : 6458 – 6462 .